 Original Article

Affiliation:
1Discipline of Life Science, Institute of Innovation, Science and Sustainability, Federation University Australia, Ballarat, VIC 3350, Australia
Email: yutang.wang@federation.edu.au
ORCID: https://orcid.org/0000-0002-6264-6443
Affiliation:
2Department of Gerontology, the First Affiliated Hospital of Shandong First Medical University, Jinan 250021, Shandong Province, China
Affiliation:
2Department of Gerontology, the First Affiliated Hospital of Shandong First Medical University, Jinan 250021, Shandong Province, China
Affiliation:
3Department of Geriatric Medicine, School of Clinical Medicine, Weifang Medical University, Weifang 261053, Shandong Province, China
Affiliation:
2Department of Gerontology, the First Affiliated Hospital of Shandong First Medical University, Jinan 250021, Shandong Province, China
Affiliation:
2Department of Gerontology, the First Affiliated Hospital of Shandong First Medical University, Jinan 250021, Shandong Province, China
Affiliation:
4The Health Physical Examination Center, the First Affiliated Hospital of Shandong First Medical University, Jinan 250021, Shandong Province, China
Affiliation:
4The Health Physical Examination Center, the First Affiliated Hospital of Shandong First Medical University, Jinan 250021, Shandong Province, China
Affiliation:
4The Health Physical Examination Center, the First Affiliated Hospital of Shandong First Medical University, Jinan 250021, Shandong Province, China
Affiliation:
5Centre for Cardiovascular Biology and Disease Research, La Trobe University, Melbourne, VIC 3086, Australia
6Department of Microbiology, Anatomy, Physiology & Pharmacology, School of Agriculture, Biomedicine & Environment, La Trobe University, Melbourne, VIC 3086, Australia
ORCID: https://orcid.org/0000-0001-9773-4972
Affiliation:
1Discipline of Life Science, Institute of Innovation, Science and Sustainability, Federation University Australia, Ballarat, VIC 3350, Australia
Affiliation:
7School of Medicine, Deakin University, Geelong, VIC 3220, Australia
Affiliation:
2Department of Gerontology, the First Affiliated Hospital of Shandong First Medical University, Jinan 250021, Shandong Province, China
Email: yangg1972@126.com
Explor Endocr Metab Dis. 2026;3:101459 DOI: https://doi.org/10.37349/eemd.2026.101459
Received: October 27, 2025 Accepted: January 19, 2026 Published: February 12, 2026
Academic Editor: Peter Schwarz, TU Dresden, Germany
The article belongs to the special issue Current Views on Pathogenesis, Diagnosis and Management of Type 2 Diabetes Mellitus and Its Complications and Related Conditions
Aim: Hypertriglyceridemia is linked to increased risk of diabetes diagnosis, incidence, and mortality. However, whether individuals with normal triglyceride levels (i.e., < 1.7 mmol/L) uniformly exhibit low diabetes risk remains underexplored. Specifically, it is unclear whether triglyceride levels within the normal range are associated with plasma glucose levels and the prevalence of type 2 diabetes (T2DM). This study aimed to address these gaps by examining the associations between triglyceride levels and fasting plasma glucose, as well as between triglyceride levels and T2DM, in individuals with triglycerides in the normal range.
Methods: This cross-sectional study included 16,706 Chinese adults with triglyceride levels below 1.7 mmol/L. Among them, 1,067 had T2DM. Associations between triglyceride levels and fasting plasma glucose were assessed using linear regression, while associations with T2DM were evaluated using binary logistic regression. The optimal triglyceride cut-off for T2DM diagnosis was determined via receiver operating characteristic (ROC) curve analysis.
Results: Triglyceride levels were positively associated with fasting plasma glucose after multivariate adjustment (β = 0.034, P < 0.001). A one-unit increase in the natural log of triglyceride levels was associated with a 61% higher adjusted odds of T2DM [odds ratio (OR), 1.61; 95% confidence interval (CI), 1.19–2.17; P = 0.002]. The optimal triglyceride cut-off for T2DM diagnosis was 1.09 mmol/L. Participants with triglyceride levels ≥ 1.09 mmol/L had a 28% higher odds of T2DM (OR, 1.28; 95% CI, 1.07–1.53; P = 0.006) compared to those with levels below the cut-off.
Conclusions: Among individuals with normal triglyceride levels, higher triglyceride concentrations were associated with higher odds of T2DM diagnosis, with an optimal diagnostic cut-off of 1.09 mmol/L. These findings suggest that adults with triglyceride levels more than 1.09 mmol/L may benefit from closer monitoring for T2DM development.
Diabetes mellitus is one of the most significant global public health challenges. According to the World Health Organization, 14% of adults aged ≥ 18 years are affected by diabetes [1], which contributes to approximately 1.6 million deaths annually [1]. In addition to its health impact, diabetes imposes a substantial economic burden on society [2–4]. For instance, the total cost of diabetes in the United States was estimated at $413 billion in 2022 [5]. Type 2 diabetes (T2DM) accounts for approximately 90% of all diagnosed diabetes cases [6]. Diabetes affects an estimated 118 million individuals in China, corresponding to 12.4% of the adult population [7]. China bears the largest burden of diabetes globally, accounting for approximately 22% of all cases worldwide [7]. Therefore, identifying modifiable risk factors and developing effective therapeutic strategies for diabetes, particularly T2DM, is of critical importance.
Triglycerides are lipid molecules composed of three fatty acids esterified to a glycerol backbone [8]. Due to variability in the fatty acid chains, triglycerides represent a diverse group of molecules. They are the primary constituents of body fat and play a central role in energy storage and supply [9].
Circulating triglyceride levels are regulated by the balance between their production—such as dietary absorption via the intestines [10] and de novo synthesis in the liver [11, 12]—and their clearance by tissues including muscle, liver, and adipose tissue [13–16]. Maintaining triglyceride homeostasis is essential for overall health [17–19]. Conversely, elevated triglyceride levels—or hypertriglyceridemia, which is defined as a triglyceride level ≥ 1.7 mmol/L [20]—are associated with increased disease risk. For example, hypertriglyceridemia has been linked to cardiovascular conditions such as hypertension [21], atherosclerosis [22], coronary heart disease [23], and stroke [24].
Emerging evidence indicates that hypertriglyceridemia is also associated with T2DM. Epidemiological studies have shown elevated triglyceride levels in individuals with T2DM [25, 26]. Furthermore, hypertriglyceridemia is associated with increased risk of diabetes diagnosis [27, 28], incidence [29–34], and mortality [28]. It is also linked to elevated cardiovascular mortality among individuals with diabetes [35]. Two large cohort studies examined the association between glucose and triglyceride levels [36, 37] and reported a positive association between fasting glucose and triglycerides in 6,093 US adults from the general population [36] and in 1,747 Chinese patients with T2DM [37]. Many mechanisms have been proposed to explain the diabetogenic effect of hypertriglyceridemia. For example, hepatic diacylglycerol accumulation increases insulin resistance via activation of protein kinase C epsilon (PKCε) [38, 39]; excessive triglycerides could block glucose oxidation via the Randle Cycle (glucose-fatty acid cycle), likely leading to insulin resistance [40]; and hypertriglyceridemia could activate apoptosis pathways, which result in β-cell dysfunction and cell death [41].
Some researchers have questioned whether individuals with normal triglyceride levels (< 1.7 mmol/L) uniformly exhibit low risk for T2DM. To date, only two studies have investigated this question [42, 43]. In one study, Beshara et al. [42] reported that individuals with higher normal triglyceride levels (1.13–1.69 mmol/L) had an increased risk of developing T2DM compared to those with levels < 1.13 mmol/L. In the second study, conducted by our research group [43], we found that normal-range triglyceride levels were positively associated with increased diabetes-related mortality in the general U.S. population, with an optimal cut-off of 1.07 mmol/L.
However, the association between triglyceride levels and T2DM prevalence has not previously been examined in individuals with normal triglyceride concentrations (< 1.7 mmol/L) in cross-sectional studies. Additionally, it remains unclear whether triglyceride levels within the normal range are associated with plasma glucose levels. This study aimed to address these knowledge gaps by examining the associations between triglyceride levels and fasting plasma glucose, and between triglyceride levels and T2DM, in a cohort of 16,706 Chinese adults with triglycerides in the normal range. We hypothesized that higher-normal triglyceride levels were positively associated with plasma glucose and T2DM risk after controlling for metabolic confounders.
A total of 22,571 participants underwent a routine health examination between January and May 2019. Their health examination was conducted at the Health Physical Examination Center of the First Affiliated Hospital of Shandong First Medical University, Jinan, Shandong Province, China [44]. A total of 5,771 participants were excluded from the study because their triglyceride levels were ≥ 1.7 mmol/L, i.e., not in the normal range recommended by the US National Lipid Association Expert Panel [20]. Thirteen participants were further excluded due to being younger than 18 years, and another participant was excluded due to missing blood pressure data. Additionally, 80 participants who were taking insulin were excluded, and thus, diabetes in the current study was classified as T2DM. Therefore, the remaining 16,706 adult participants were included in this cross-sectional study (Figure 1). The data were extracted from hospital records.
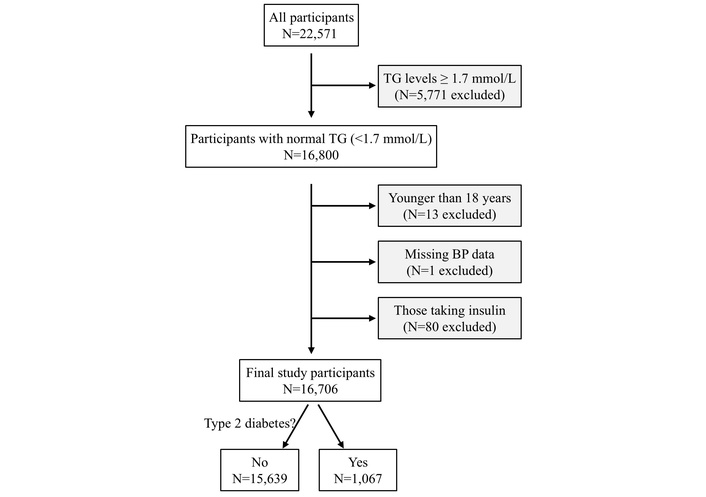
Flow diagram of the study participants. BP: blood pressure; N: number; TG: triglycerides.
This cross-sectional study complied with the Declaration of Helsinki and was approved by the Research Ethics Committee of the First Affiliated Hospital of Shandong First Medical University (approval number S545) [45]. The patient informed consent requirement was waived for this retrospective study.
T2DM was defined as fasting blood glucose ≥ 7 mmol/L or prior diagnosis or treatment of diabetes [44, 46]. In those without a diabetes diagnosis, prediabetes was defined as fasting blood glucose ≥ 5.6 mmol/L.
Covariates included age [47, 48], sex [49, 50], body mass index (BMI) [51, 52], systolic blood pressure [53, 54], low-density lipoprotein (LDL) cholesterol [55, 56], and high-density lipoprotein (HDL) cholesterol [51, 57]. The use of lipid-lowering and anti-diabetic medications was also included as covariates, as these medications affect circulating triglyceride or glucose levels.
Blood pressure in all participants was measured using Omron HBP-9020 Automated BP Monitors (Omron Healthcare Co. Ltd., Tokyo, Japan). After the participant rested for 10 minutes, their blood pressure was measured in the seated position by trained professionals two times at 2-minute intervals. The mean systolic and diastolic blood pressure values were recorded [58, 59]. BMI was calculated using the formula of weight in kilograms divided by height in meters squared [60]. Venous blood was collected from all participants following an overnight fast of approximately 8–12 hours. Fasting plasma glucose and serum concentrations of LDL cholesterol, HDL cholesterol, and triglycerides were measured using the Olympus AU2700 automatic biochemical analyzer (Olympus Corporation, Tokyo, Japan) [60]. Fasting blood glucose was measured once. The use of lipid-lowering drugs was categorized as the number of lipid-lowering drugs prescribed (0, 1, or 2). The use of anti-diabetic drugs was categorized as the number of anti-diabetic drugs prescribed (0, 1, 2, 3, or 4).
Body weight was measured using calibrated digital scales. Participants wore minimal clothing and no shoes or socks. They stood in the center of the scale platform with their arms relaxed at their sides and their gaze directed forward [61]. Body height was measured with a stadiometer equipped with a fixed vertical backboard and an adjustable headpiece. Participants stood barefoot with their weight evenly distributed and both feet flat on the platform, heels together and toes slightly apart. The back of the head, shoulder blades, buttocks, and heels were positioned in contact with the backboard, and participants maintained an upright posture with their head aligned in the Frankfort horizontal plane [62].
All statistical analyses were performed using SPSS version 29.0 (IBM SPSS Statistics for Windows, Armonk, NY, International Business Machines Corporation). Data were expressed as mean and standard deviation (SD) for continuous variables or number and percentage for categorical variables [63]. Statistical comparisons of continuous data among groups were performed using one-way analysis of variance (ANOVA) (for LDL cholesterol) or Kruskal-Wallis one-way ANOVA (for age, BMI, HDL cholesterol, triglycerides, glucose, and systolic blood pressure) [35]. Data normality was measured using the Kolmogorov-Smirnov test. Statistical comparisons of categorical data among groups were performed using Pearson’s Chi-square test [64]. The associations between triglycerides and glucose and between triglycerides and diabetes diagnosis were analyzed by linear regression [65] and binary logistic regression [66, 67], respectively, with or without adjustment for confounding factors including age, sex, BMI, systolic blood pressure, HDL cholesterol, LDL cholesterol, use of lipid-lowering drugs, and use of anti-diabetic drugs. Age, triglycerides, HDL cholesterol, fasting plasma glucose, BMI, and systolic blood pressure were natural log-transformed to improve data distribution before being put into the regression models [68, 69]. Receiver operating characteristic (ROC) curves were constructed, and the area under the curve (AUC) was calculated to assess the association of triglycerides and diabetes diagnosis [70] and to determine the optimal cut-off of triglycerides for increased odds of T2DM according to the Youden index [71]. Sensitivity analysis was conducted when 414 participants, who were taking lipid-lowering drugs, anti-diabetic drugs, or both, were excluded. All tests were two-sided, and a P value of < 0.05 was regarded as statistically significant.
The study included 16,706 participants aged 18–95 years with a mean (SD) age of 44.9 (14.3) years (Table 1). Among those participants, 1,067 had T2DM. Participants with higher triglycerides had higher fasting plasma glucose, higher prevalence of T2DM, and higher prevalence of use of anti-diabetic drugs. In addition, participants with higher triglycerides were older and had a higher percentage of males, higher BMI, higher systolic blood pressure, higher LDL cholesterol, and lower HDL cholesterol (Table 1). Moreover, serum triglyceride levels were higher when glycemic status worsened (Figure S1).
Clinical characteristics of the 16,706 participants, stratified by quartiles of triglycerides.
| Variables | Q1 | Q2 | Q3 | Q4 | Overall | P value |
|---|---|---|---|---|---|---|
| TG, mean (SD), mmol/L | 0.58 (0.10) | 0.84 (0.07) | 1.10 (0.08) | 1.45 (0.13) | 1.00 (0.34) | < 0.001 |
| Sample size, N | 4,152 | 4,179 | 4,083 | 4,292 | 16,706 | NA |
| Age, mean (SD), y | 39.9 (13.0) | 44.6 (14.2) | 46.7 (14.2) | 48.3 (14.3) | 44.9 (14.3) | < 0.001 |
| Number of males (%) | 1,538 (37.0) | 2,091 (50.0) | 2,451 (60.0) | 2,802 (65.3) | 8,882 (53.2) | < 0.001 |
| FPG, mean (SD), mmol/L | 4.97 (0.78) | 5.17 (0.96) | 5.32 (1.11) | 5.49 (1.35) | 5.24 (1.09) | < 0.001 |
| BMI, mean (SD), kg/m2 | 22.3 (3.0) | 23.7 (3.3) | 24.8 (3.3) | 25.7 (3.2) | 24.2 (3.5) | < 0.001 |
| SBP, mean (SD), mmHg | 121 (17) | 127 (18) | 131 (19) | 133 (19) | 128 (19) | < 0.001 |
| LDL-C, mean (SD), mmol/L | 2.36 (0.58) | 2.65 (0.65) | 2.84 (0.69) | 2.96 (0.70) | 2.70 (0.69) | < 0.001 |
| HDL-C, mean (SD), mmol/L | 1.47 (0.29) | 1.38 (0.27) | 1.29 (0.25) | 1.23 (0.24) | 1.34 (0.28) | < 0.001 |
| Type 2 diabetes, N (%) | 130 (3.1) | 218 (5.2) | 294 (7.2) | 425 (9.9) | 1,067 (6.4) | < 0.001 |
| Number of people on anti-diabetic drugs, N (%) | 63 (1.5) | 84 (2.0) | 109 (2.7) | 137 (3.2) | 393 (2.4) | < 0.001 |
| Number of people on lipid-lowering drugs, N (%) | 27 (0.7) | 35 (0.8) | 46 (1.1) | 46 (1.1) | 154 (0.9) | 0.085 |
The ranges of TG levels in each quartile were: ≤ 0.72 mmol/L (Q1), 0.73–0.96 mmol/L (Q2), 0.97–1.24 mmol/L (Q3), and ≥ 1.25 mmol/L (Q4). Comparisons of continuous data were performed using one-way ANOVA (for LDL-C) or Kruskal-Wallis one-way ANOVA (for age, BMI, HDL-C, TG, glucose, and SBP), and comparisons of categorical data among groups were performed using Pearson’s Chi-square test. ANOVA: analysis of variance; BMI: body mass index; FPG: fasting plasma glucose; HDL-C: high-density lipoprotein cholesterol; LDL-C: low-density lipoprotein cholesterol; N: number; NA: not applicable; SBP: systolic blood pressure; SD: standard deviation; TG: triglycerides; y: year.
The increase in triglycerides was accompanied by an increase in fasting plasma glucose (Figure 2). Linear regression analyses indicated that triglycerides were positively associated with fasting plasma glucose after adjustment for all the tested confounders (β = 0.03, P < 0.001, Table 2). The collinearity among the variables was low, with all variance inflation factors below 1.5 (Table S1). The final model (Model 4) had an R-value of 0.490 (P < 0.001). The standardized residuals were not strictly normally distributed (P < 0.001), but it was close to normally distributed according to the histogram (Figure S2). A sensitivity analysis excluding 414 participants who were taking lipid-lowering drugs, anti-diabetic drugs, or both yielded similar results (Table S2).
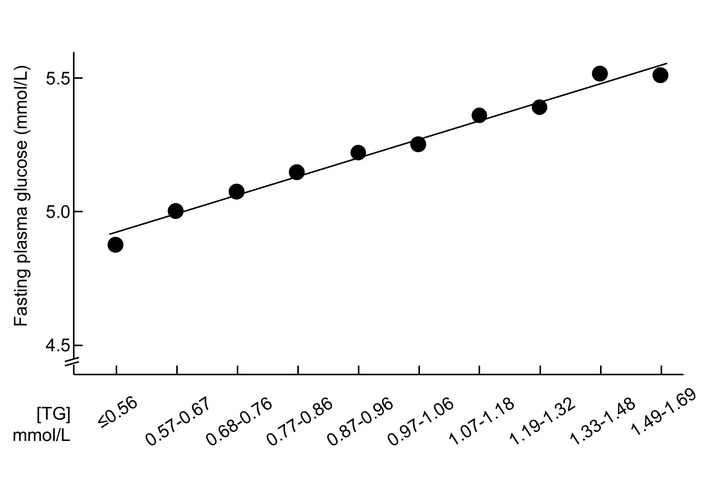
Mean fasting plasma glucose and serum triglyceride concentrations in 16,706 participants with normal triglycerides. TG were stratified according to the observed deciles. TG: triglycerides.
Association between fasting plasma glucosea (dependent) and triglyceridesa (independent) in 16,706 participants with normal triglycerides.
| Models | βb (95% confidence interval) | P value |
|---|---|---|
| Model 1 | 0.21 (0.20–0.23) | < 0.001 |
| Model 2 | 0.10 (0.08–0.11) | < 0.001 |
| Model 3 | 0.04 (0.02–0.05) | < 0.001 |
| Model 4 | 0.03 (0.02–0.05) | < 0.001 |
a: Natural log-transformed; b: standardized coefficient. The data were analyzed using multiple linear regression. Model 1: Not adjusted; Model 2: adjusted for age and sex; Model 3: adjusted for factors in Model 2 plus body mass index, systolic blood pressure, low-density lipoprotein (LDL) cholesterol, and high-density lipoprotein (HDL) cholesterol; Model 4: adjusted for factors in Model 3 plus use of lipid-lowering drugs and use of anti-diabetic drugs.
Logistic regression analyses showed that higher triglycerides (continuous variable) were associated with higher odds of T2DM, and a 1-natural-log-unit increase in triglycerides (e.g., from 0.50 to 1.36 mmol/L) was associated with 61% higher multivariate-adjusted odds of diabetes diagnosis [odds ratio (OR), 1.61; 95% confidence interval (CI), 1.19–2.17; P = 0.002; Table 3]. A sensitivity analysis excluding 414 participants who were taking lipid-lowering drugs, anti-diabetic drugs, or both yielded similar results (Table S3).
Natural log-transformed triglycerides and odds for type 2 diabetes in 16,706 participants with normal triglycerides.
| Models | Odds ratio | 95% CI | P value |
|---|---|---|---|
| Model 1 | 3.85 | 3.17–4.68 | < 0.001 |
| Model 2 | 2.21 | 1.79–2.73 | < 0.001 |
| Model 3 | 1.45 | 1.14–1.83 | 0.002 |
| Model 4 | 1.61 | 1.19–2.17 | 0.002 |
CI: confidence interval. The data were analyzed using binary logistic regression. Model 1: Not adjusted; Model 2: adjusted for age and sex; Model 3: adjusted for factors in Model 2 plus body mass index, systolic blood pressure, low-density lipoprotein (LDL) cholesterol, and high-density lipoprotein (HDL) cholesterol; Model 4: adjusted for factors in Model 3 plus use of lipid-lowering drugs and use of anti-diabetic drugs.
The ROC curve analysis indicated that higher triglycerides were significantly associated with higher odds of T2DM (AUC, 0.63; 95% CI, 0.61–0.64; P < 0.001; Figure 3). The optimal cut-off value, assessed by the Youden index, was 1.09 mmol/L, corresponding to a sensitivity of 57% and a specificity of 62%. The prevalence of T2DM was 4.5% and 9.3% in those with triglycerides < 1.09 mmol/L and ≥ 1.09 mmol/L, respectively (Table S4). The cut-off of 1.13 mmol/L (or 100 mg/dL) had a sensitivity of 52% and a specificity of 66%. When triglycerides were treated as a dichotomous variable using this optimal cut-off (i.e., ≥ 1.09 mmol/L or < 1.09 mmol/L), participants with triglycerides at or above the cut-off had 28% higher odds of diabetes diagnosis (OR, 1.28; 95% CI, 1.07–1.53; P = 0.006; Table 4) compared with those with triglycerides below the cut-off.
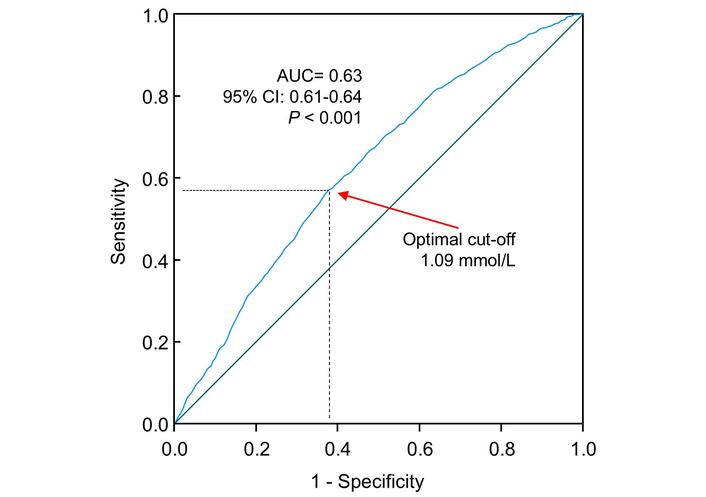
ROC curve analysis of the association of triglycerides with odds of type 2 diabetes. Sensitivity represents true-positive results, and 1 – specificity represents false-positive results. The AUC was 0.63 (95% CI: 0.61–0.64). The optimal cut-off of triglycerides for increased odds of type 2 diabetes was 1.09 mmol/L, with a sensitivity of 57% and specificity of 62%. CI: confidence interval; AUC: area under the curve; ROC: receiver operating characteristic.
OR (95% CI) for type 2 diabetes associated with higher triglycerides in 16,706 participants using the optimal cut-off (≥ 1.09 vs. < 1.09 mmol/L).
| Models | OR | 95% CI | P value |
|---|---|---|---|
| Model 1 | 2.19 | 1.93–2.48 | < 0.001 |
| Model 2 | 1.59 | 1.40–1.81 | < 0.001 |
| Model 3 | 1.26 | 1.09–1.45 | 0.002 |
| Model 4 | 1.28 | 1.07–1.53 | 0.006 |
CI: confidence interval; OR: odds ratio. The data were analyzed using binary logistic regression. Model 1: Not adjusted; Model 2: adjusted for age and sex; Model 3: adjusted for factors in Model 2 plus body mass index, systolic blood pressure, low-density lipoprotein (LDL) cholesterol, and high-density lipoprotein (HDL) cholesterol; Model 4: adjusted for factors in Model 3 plus use of lipid-lowering drugs and use of anti-diabetic drugs.
Further analyses were conducted when triglycerides were treated as quartiles. Results showed that higher triglycerides (top vs. bottom quartile) were associated with 54% higher multivariate-adjusted odds of T2DM diagnosis (OR, 1.54; 95% CI, 1.14–2.09; Table 5).
OR (95% CI) of triglycerides in quartiles for type 2 diabetes diagnosis in 16,706 participants with normal triglycerides.
| Models | Q1 | Q2 | Q3 | Q4 | P value |
|---|---|---|---|---|---|
| Model 1 | 1 | 1.70 (1.36–2.13) | 2.40 (1.94–2.97) | 3.40 (2.78–4.16) | < 0.001 |
| Model 2 | 1 | 1.20 (0.96–1.51) | 1.48 (1.19–1.84) | 1.94 (1.57–2.39) | < 0.001 |
| Model 3 | 1 | 1.03 (0.81–1.30) | 1.10 (0.87–1.39) | 1.32 (1.05–1.66) | 0.020 |
| Model 4 | 1 | 1.15 (0.84–1.58) | 1.22 (0.90–1.66) | 1.54 (1.14–2.09) | 0.009 |
The ranges of TG levels in each quartile were: ≤ 0.72 mmol/L (Q1), 0.73–0.96 mmol/L (Q2), 0.97–1.24 mmol/L (Q3), and ≥ 1.25 mmol/L (Q4). The data were analyzed using binary logistic regression. CI: confidence interval; OR: odds ratio; Q: quartile. Model 1: Not adjusted; Model 2: adjusted for age and sex; Model 3: adjusted for factors in Model 2 plus body mass index, systolic blood pressure, low-density lipoprotein (LDL) cholesterol, and high-density lipoprotein (HDL) cholesterol; Model 4: adjusted for factors in Model 3 plus use of lipid-lowering drugs and use of anti-diabetic drugs.
This study is the first to demonstrate that triglyceride levels are positively associated with both fasting plasma glucose and T2DM diagnosis in individuals with triglycerides within the normal range. Specifically, participants with high-normal triglyceride levels (1.09–1.69 mmol/L) had 28% higher multivariate-adjusted odds of T2DM compared to those with low-normal levels (< 1.09 mmol/L).
A linear relationship was observed between triglyceride levels and fasting plasma glucose among individuals with normal triglycerides. The underlying mechanism for this finding remains unclear. Shulman hypothesized that elevated circulating triglycerides may increase intracellular concentrations of fatty acid metabolites [72]. These metabolites could activate a serine/threonine kinase cascade, leading to phosphorylation of insulin receptor substrates (IRS-1 and IRS-2), thereby reducing phosphoinositide 3-kinase (PI3K) activity [73, 74], leading to hepatic insulin resistance [75]. In addition, high triglyceride levels can lead to mitochondrial lipid overload, thereby increasing the production of reactive oxygen species and ultimately contributing to the development of metabolic disorders [76, 77]. Moreover, higher triglyceride availability may enhance β-oxidation in tissues [8, 78, 79], reducing cellular glucose consumption for energy [80] and consequently increasing blood glucose. However, reverse causality—where elevated glucose leads to higher triglyceride levels—cannot be excluded. It is worth noting that elevated blood glucose levels can promote triglyceride synthesis [81], which is subsequently packaged and secreted as very LDL (VLDL) [82].
Many reports support a causal role of elevated triglycerides in diabetes pathogenesis. In individuals without diabetes at baseline, higher fasting triglycerides have been shown to predict impaired glucose tolerance [83], impaired fasting glucose, new-onset diabetes [31–34, 42], and diabetes-related mortality [28]. Mechanistically, elevated triglycerides and their fatty acid metabolites may contribute to insulin resistance [84, 85], stimulate hepatic gluconeogenesis [86, 87], impair insulin secretion [88], and promote β-cell apoptosis [89]—all central processes in diabetes development. Furthermore, triglyceride-lowering agents have been associated with improved glycemic control. These include fibrates, which are peroxisome proliferator-activated receptor (PPAR) alpha agonists [90–93], the dual PPAR alpha/delta agonist GFT505 [94], and the diacylglycerol acyltransferase 1 inhibitor pradigastat [95]. It is also important to note that diabetes itself can elevate circulating triglyceride levels; patients with poorly controlled T2DM are more likely to exhibit hypertriglyceridemia compared to those with good glycemic control [96, 97].
However, genetic studies have yielded inconsistent findings. Triglyceride-enhancing alleles have been reported to be positively associated with [98], inversely associated with [33, 99, 100], or not associated with diabetes [101]. Notably, Klimentidis et al. [33] found that while higher baseline triglyceride levels were associated with increased diabetes incidence, triglyceride-enhancing alleles were paradoxically associated with reduced risk. These discrepancies may be due to pleiotropic effects of the selected alleles beyond triglyceride regulation.
However, no prior study has examined the association between triglycerides and plasma glucose or diabetes diagnosis specifically in individuals with normal triglyceride levels. To our knowledge, this is the first study to demonstrate that triglycerides within the normal range are positively associated with both fasting plasma glucose and T2DM diagnosis. These findings extend the known association between hypertriglyceridemia and diabetes risk to individuals with “normal” triglyceride levels (< 1.7 mmol/L).
Using ROC curve analysis, we identified an optimal triglyceride cut-off of 1.09 mmol/L for predicting T2DM diagnosis in individuals with normal triglycerides. This cut-off was validated in our cohort, as individuals with triglyceride levels between 1.09 and 1.69 mmol/L had 28% higher multivariate-adjusted odds of T2DM compared to those with levels < 1.09 mmol/L. In our previous study [43], we found that a cut-off of 1.07 mmol/L was optimal for predicting diabetes mortality, with individuals above this threshold having 43% higher odds. Similarly, Beshara et al. [42] identified 1.13 mmol/L as a useful threshold for predicting new-onset diabetes, although ROC analysis was not used. It is worth noting that the OR for the association between triglycerides and diabetes was 1.61, indicating a meaningful yet modest effect. Additionally, the AUC from the ROC analysis was 0.63, suggesting that triglyceride levels have limited discriminatory ability for identifying T2DM.
Together, these studies suggest that triglyceride concentrations near the upper end of the normal range may not be truly benign. A lower threshold may be more appropriate for assessing T2DM risk. However, further research is needed to validate this proposed cut-off.
This study has several strengths. First, the associations between triglycerides and both plasma glucose and T2DM diagnosis were adjusted for HDL and LDL cholesterol, which are common confounders [94, 102, 103]. Second, the large sample size (N = 16,706) enhances the statistical power and generalizability of the findings. In addition, this study adheres to the STROBE (Strengthening the Reporting of Observational Studies in Epidemiology) guidelines. Nonetheless, this study has limitations. First, it employed a cross-sectional design; therefore, causal relationships cannot be established. Second, only a limited number of confounders were adjusted for, and other confounding factors, e.g., dietary intake, alcohol consumption, smoking, physical activity, antihypertensive medications, and use of supplements, may affect the results. Third, participants were recruited from a single hospital, which may limit the generalizability of the findings to other populations. Fourth, this study relied on single fasting glucose measurements without HbA1c or oral glucose tolerance test confirmation. Fifth, the possibility of measurement errors cannot be excluded. Sixth, the pregnancy status of women was unknown, which may affect the results [104, 105]. Therefore, further research is warranted, including longitudinal validation, Mendelian randomization, and interventional studies to assess whether triglyceride modulation can influence diabetes incidence. In addition, whether sex and age modify the association between triglycerides and glucose needs to be investigated in the future.
It is important to note that several complementary metabolic markers are available for the assessment of metabolic status. For example, remnant cholesterol—the cholesterol component of chylomicron remnants, intermediate-density lipoproteins, and VLDLs—has been proposed as an informative marker [106, 107]. In addition, postprandial triglyceride dynamics [108, 109] and the triglyceride-glucose index have been used to provide integrated insights into lipid metabolism and insulin resistance [110].
In conclusion, this study found that higher triglyceride levels within the normal range are positively associated with fasting plasma glucose and T2DM diagnosis. Alongside previous findings [42, 43], these results support reconsideration of the current triglyceride cut-off for T2DM risk. Currently, normotriglyceridemia is defined as < 1.7 mmol/L by the 2019 European Society of Cardiology Guidelines [111] and as < 2.0 mmol/L by the American College of Cardiology/American Heart Association guidelines [112]. It is plausible that a threshold of 1.13 mmol/L (100 mg/dL) may serve as an early metabolic indicator of dysglycemia, potentially allowing for earlier intervention to reduce the risk of T2DM-related morbidity and mortality. Further research is warranted to explore this possibility.
ANOVA: analysis of variance
AUC: area under the curve
BMI: body mass index
CI: confidence interval
HDL: high-density lipoprotein
LDL: low-density lipoprotein
OR: odds ratio
PI3K: phosphoinositide 3-kinase
PPAR: peroxisome proliferator-activated receptor
ROC: receiver operating characteristic
SD: standard deviation
STROBE: Strengthening the Reporting of Observational Studies in Epidemiology
T2DM: type 2 diabetes
VLDL: very low-density lipoprotein
The supplementary figures for this article are available at: https://www.explorationpub.com/uploads/Article/file/101459_sup_1.pdf. The supplementary tables for this article are available at: https://www.explorationpub.com/uploads/Article/file/101459_sup_2.pdf.
YW: Conceptualization, Formal analysis, Investigation, Writing—original draft, Funding acquisition. HL: Methodology. SM: Methodology. TQ: Methodology. HS: Methodology. QX: Methodology. XH: Methodology, Resources. WH: Resources. GZ: Resources. MJ: Writing—review & editing. YF: Writing—review & editing. DS: Writing—review & editing. GY: Conceptualization, Formal analysis, Investigation, Writing—review & editing, Funding acquisition. All authors read and approved the submitted version.
The authors declare that there are no conflicts of interest.
This study was approved by the Research Ethics Committee of the First Affiliated Hospital of Shandong First Medical University (approval number S545).
The routine health examination data were collected before the study was conceived. Due to the large number of participants, retrospective acquisition of individual informed consent was impracticable. Furthermore, all participant identifiers were fully anonymized to safeguard privacy. Accordingly, the requirement for informed consent was waived by the Research Ethics Committee.
Not applicable.
The datasets that support the findings of this study are available upon reasonable request.
This work was funded by the Shandong Natural Fund [ZR2015HL008], Shandong Province, China. YW was supported by a grant from the National Health and Medical Research Council of Australia [1062671]. The funders had no role in study design, data collection and analysis, decision to publish, or preparation of the manuscript.
© The Author(s) 2026.
Open Exploration maintains a neutral stance on jurisdictional claims in published institutional affiliations and maps. All opinions expressed in this article are the personal views of the author(s) and do not represent the stance of the editorial team or the publisher.
Copyright: © The Author(s) 2026. This is an Open Access article licensed under a Creative Commons Attribution 4.0 International License (https://creativecommons.org/licenses/by/4.0/), which permits unrestricted use, sharing, adaptation, distribution and reproduction in any medium or format, for any purpose, even commercially, as long as you give appropriate credit to the original author(s) and the source, provide a link to the Creative Commons license, and indicate if changes were made.

Elif Basaran, Gulali Aktas
Roanne Lecky ... Catriona Kelly
Mehmet Ali Kosekli
Maher Monir Akl, Amr Ahmed
Ivonne G. Narváez-Ortiz ... Alberto Maceda-Serrano
Osama Mahmoud Mehanna ... Ahmad Shaban Abd El Monsef
