Original Article

Affiliation:
1Department of Medicine, University of Missouri-Kansas City School of Medicine, Kansas City, MO 64108, USA
Email: rm5dt@umsystem.edu
ORCID: https://orcid.org/0009-0008-5873-8178
Affiliation:
1Department of Medicine, University of Missouri-Kansas City School of Medicine, Kansas City, MO 64108, USA
Email: zamdmy@umsystem.edu
ORCID: https://orcid.org/0009-0002-1818-3418
Affiliation:
1Department of Medicine, University of Missouri-Kansas City School of Medicine, Kansas City, MO 64108, USA
ORCID: https://orcid.org/0009-0005-5200-9319
Affiliation:
1Department of Medicine, University of Missouri-Kansas City School of Medicine, Kansas City, MO 64108, USA
ORCID: https://orcid.org/0009-0002-3852-1971
Affiliation:
2Department of Cardiology, University of Missouri-Kansas City School of Medicine, Kansas City, MO 64108, USA
ORCID: https://orcid.org/0009-0005-0446-0463
Explor Cardiol. 2026;4:1012107 DOI: https://doi.org/10.37349/ec.2026.1012107
Received: January 28, 2026 Accepted: April 01, 2026 Published: May 05, 2026
Academic Editor: Chiara Caselli, Consiglio National Research Council (CNR), Italy
Aim: This study aims to evaluate how demographic and treatment variables, including age, tumor type, resectability, and metastasis, affect survival outcomes across prognostic subgroups of primary malignant cardiac tumors (PMCTs).
Methods: PMCT cases diagnosed between 2000 and 2021 were identified from Surveillance, Epidemiology, and End Results (SEER) 18 registries. 730 patients were analyzed and categorized into prognosis groups based on 5-year survival (< 50%, 50–95%, > 95%). Demographic, histologic, and treatment varieties were examined using descriptive statistics, Kaplan-Meier estimates, and Cox proportional hazards models.
Results: Among 730 patients, most were middle-aged (56.6%), male (52.5%), and White (60.1%). Soft tissue sarcomas predominated in the poorest-prognosis group (80.3%), while hematologic malignancies were most common in intermediate prognosis (52.0%). Younger age significantly reduced mortality risk [hazard ratio (HR) 0.49–0.52; p < 0.01]. Brain and lung metastases increased mortality (HR 2.04 and 1.89; p < 0.05). Surgical resection improved survival in sarcoma-dominant tumors, while systemic metastasis predicted poorer outcomes in hematologic malignancies. Chemotherapy improved survival in sarcomas (ρ = 0.457; p < 0.0001) but was associated with poorer outcomes in hematologic cancers (ρ = −0.337; p < 0.0001).
Conclusions: PMCT prognosis is primarily influenced by histologic subtype and resectability. Sarcoma-dominant tumors benefit from aggressive surgical and chemotherapeutic management, conversely systemic control is key for hematologic malignancies. Younger age and absence of metastasis consistently predict better outcomes. Histology-specific and early intervention strategies are critical to improving survival in this rare malignancy.
Primary malignant cardiac tumors (PMCTs) are a rare group of disorders that are associated with a poor prognosis [1]. While less common than metastatic cardiac tumors, the average annual incidence of PMCTs has increased with time, rising from 25.1 in 1973–1989 to 46.6 in 2000–2011 [2]. Despite their rarity, these tumors carry devastating consequences, with the 1, 3, and 5-year survival rates being 45.6%, 18.8%, and 11.2%, respectively, pointing to the poor prognosis of the disease [3]. Overall, the histopathologic subtypes with the highest rate of mortality include mesotheliomas and sarcomas, whereas the lowest rate of mortality includes lymphomas.
Clinically, most PMCTs are asymptomatic, often being found incidentally. However, systemic or cardiac signs and symptoms are also possible, depending on the location and size. These findings can include new arrhythmias, congestive heart failure, new-onset dyspnea, or murmurs [4]. Consequently, diagnosis is often delayed until the tumor has reached an advanced stage, which further complicates treatment methods [5]. Advances in diagnostic imaging modalities such as echocardiography, computed tomography (CT), magnetic resonance imaging (MRI), positron emission tomography (PET), cardiac catheterization, and biopsy may have increased diagnoses and earlier identification. Despite these imaging advances, the survival rate of these cancers continues to be abysmal [6].
The rarity of PMCTs has limited the generalizability of current literature, as most data have come from case reports, retrospective analyses, or single-institution findings. National registries, such as Surveillance, Epidemiology, and End Results (SEER) database, offer a unique opportunity for wider applicability due to the broad range of populations and long time periods of evaluation. Past analyses have shown that age, histopathological subtype, and method of treatment have been strong indicators of outcomes [7]. However, systematic stratification of these tumors by prognosis category remains somewhat underexplored.
This study seeks to explore survival analysis of PMCTs using 18 registries from the SEER database between 2000 and 2021. By doing so, we aim to provide new insight into how tumor biology and treatments influence overall survival (OS) outcomes in this rare but clinically significant disease.
Preliminary findings from this study were previously presented as a meeting abstract at the American College of Cardiology Annual Scientific Session and published in the Journal of the American College of Cardiology abstract supplement.
We queried SEER*Stat (November 2023 update) to extract cases from the SEER 18 registries diagnosed between 2000 and 2021 [8]. Eligible records had the primary site coded as heart using the ICD-O-3 topography code C38.0. A total of 784 cases of PMCTs were initially identified in the SEER database between 2000 and 2021. After excluding 54 cases with missing survival information, the final analytic cohort consisted of 730 patients. Variables were harmonized using a project data dictionary. Demographic covariates included age at diagnosis, categorized as youth (< 45 years), middle (45–64 years), and elderly (≥ 65 years); sex; race/ethnicity; neighborhood median household income (quartiles) based on the national median during 2022 ($75,000); and rural-urban continuum code. These various groupings intentionally reflected factors that are associated with inequities in healthcare, including race, socioeconomic status, and population density. These populations are often less likely to have equal access to healthcare and thus, cardiac imaging and other diagnostic modalities in comparison to their counterparts [9]. Clinical and histologic covariates included tumor size (continuous), ICD-O-3 histology, a prespecified prognosis group, cancer subtype (Soft tissue, Hematologic, Embryonal, Other), and indicators of distant metastases to bone, brain, liver, and lung.
Prognosis groups were designated based on literature-derived estimates of percent survival at 5 years [7, 10, 11]. Prognosis I defines tumors with a prognosis worse than 50% at 5 years, Prognosis II defines tumors with a prognosis between 50–95% at 5 years, and Prognosis III defines tumors with > 95% survival at 5 years. Cancer subtype was determined by literature-derived histological proximity based on author consensus (> 2 authors agreeing). Stratification by author consensus was pursued in an effort to further describe pre-existing biology-driven classification of cardiac malignancy that continues to be useful but limited [12, 13]. This investigation categorized cardiac tumors by literature-derived estimates of 5-year percent survival to ascertain similarities in clinical significance over histology as a distinct tumor niche in primary cardiac tumors to elucidate large, therapeutically informative trends that address the gaps in histology-driven studies.
Treatment covariates included surgery of the primary site (SEER RX Summ—Surg Prim Site [1998+]), radiation type, and chemotherapy (yes/no). These therapies were administered as part of the first course of treatment following the initial cancer diagnosis; subsequent treatments given after disease progression or recurrence were not comprehensively captured within the database. Cases coded as “unknown/death” under the surgery variable represent death certificates that had the treatment information listed as unavailable; thus, it is unknown whether surgical treatment was performed.
OS in months and vital status were obtained from SEER, and death from any cause was considered an event. OS in months began at the time of initial diagnosis and considered death from all causes, not exclusively cancer-related. Because metastasis indicators in SEER are consistently available from 2010 forward, models that included bone/brain/liver/lung metastasis were restricted to diagnoses from 2010–2021, with complete-case analysis for those covariates.
We described cohort characteristics with standard descriptive statistics and summarized annual counts (2000–2021) for incidence visualization. To screen hypothesis-generating associations between covariates and survival time, we computed Pearson correlation between continuous variables (e.g., tumor size vs OS months) and Spearman correlation for ordinal or categorical variables vs OS (months); two-sided p-values < 0.05 were considered statistically significant. Unadjusted survival was estimated with the Kaplan-Meier (KM) methods overall and within prespecified strata (All tumors; Prognosis I; Prognosis II; Hematologic; Soft tissue; Embryonal; Other). We reported median OS and KM survival probabilities at 12, 24, and 60 months, and compared curves with log-rank tests. We then fit Cox proportional hazards models separately within each stratum with covariates including age group, sex, race/ethnicity, surgery type, radiation, chemotherapy, household income relative to the median household income in 2022 (above or below $75,000), rural-urban code, tumor size in millimeters (mm), and the four metastasis indicators (when available). Cox proportional hazards regression was used to explore factors associated with OS. Because proportional hazards diagnostics were not formally assessed, the results should be interpreted as exploratory. Given the rarity of PMCTs and small cell counts in some subgroups (particularly embryonal histologies), results from sparse strata were interpreted cautiously. Indeed, results from the embryonal and origins of other types were excluded from the final explorative analysis. Metastasis was also excluded in the subgroup correlational analysis due to low outcome variability. All analyses were conducted in Python within the Jupyter Notebook environment using pandas for data management and lifelines for survival analyses; figures were generated with matplotlib. Two-sided α was set at 0.05.
The overall cohort (n = 730) was mostly middle-aged (56.6%), male (52.5%), and White (60.1%). Soft-tissue sarcomas were the most frequent histology as seen in Table 1, followed by hematological malignancies, embryonal tumors, and other rare histologies. Half of the patients did not have surgery (49.2%), with a larger majority not having radiotherapy (83.8%). A small majority of patients had chemotherapy (53.7%).
Frequency of demographic and therapeutic factors of all non-categorized primary malignant cardiac tumors.
| Variable | Category | Count | Percent |
|---|---|---|---|
| Age group | Middle (45–64 years) | 413 | 56.58 |
| Age group | Elderly (≥ 65 years) | 256 | 35.07 |
| Age group | Youth (< 45 years) | 61 | 8.35 |
| Sex | Male | 383 | 52.47 |
| Sex | Female | 347 | 47.53 |
| Race | White | 439 | 60.13 |
| Race | Other | 220 | 30.14 |
| Race | Black | 71 | 9.73 |
| Surgery | None | 359 | 49.17 |
| Surgery | Simple/partial surgical removal of the primary site | 105 | 14.38 |
| Surgery | Excisional biopsy | 99 | 13.56 |
| Surgery | Local tumor excision, NOS | 68 | 9.32 |
| Surgery | Debulking surgery | 35 | 4.79 |
| Surgery | Enucleation | 18 | 2.47 |
| Surgery | Radical surgery | 16 | 2.19 |
| Surgery | Local tumor excision, partial/total removal, laser excision | 14 | 1.92 |
| Surgery | Surgery, NOS | 9 | 1.23 |
| Surgery | Unknown/death | 4 | 0.55 |
| Surgery | Local tumor destruction, NOS | 1 | 0.14 |
| Surgery | Local tumor excision, partial/total removal, cryosurgery | 1 | 0.14 |
| Surgery | Polypectomy | 1 | 0.14 |
| Radiation | None | 612 | 83.84 |
| Radiation | Radiation | 118 | 16.16 |
| Chemotherapy* | Yes | 392 | 53.70 |
| Chemotherapy* | None | 338 | 46.30 |
| Income | Above median household income (≥ $75,000) | 538 | 73.70 |
| Income | Below median household income (< $75,000) | 192 | 26.30 |
| Rural-urban | Urban | 662 | 90.68 |
| Rural-urban | Rural | 68 | 9.32 |
| Prognosis group | I (< 50% survival at 5 years) | 366 | 50.14 |
| Prognosis group | II (50–95% survival at 5 years) | 356 | 48.76 |
| Prognosis group | III (> 95% survival at 5 years) | 8 | 1.10 |
| Cancer subtype | Soft tissue | 458 | 62.74 |
| Cancer subtype | Heme | 212 | 29.04 |
| Cancer subtype | Other | 53 | 7.26 |
| Cancer subtype | Embryonal | 7 | 0.96 |
| Metastasis—bone | N/A | 370 | 50.68 |
| Metastasis—bone | No | 326 | 44.66 |
| Metastasis—bone | Yes | 34 | 4.66 |
| Metastasis—brain | N/A | 373 | 51.10 |
| Metastasis—brain | No | 343 | 46.99 |
| Metastasis—brain | Yes | 14 | 1.91 |
| Metastasis—liver | N/A | 372 | 50.96 |
| Metastasis—liver | No | 334 | 45.75 |
| Metastasis—liver | Yes | 24 | 3.29 |
| Metastasis—lung | N/A | 370 | 50.68 |
| Metastasis—lung | No | 306 | 41.92 |
| Metastasis—lung | Yes | 54 | 7.40 |
| Tumor size (per mm) | Median | 65 | |
| Tumor size (per mm) | IQR | 36.75 | |
*The type of Chemotherapy was not provided in the SEER data. N/A: not applicable; NOS: not otherwise specified; IQR: interquartile range.
A total of 366 patients were included in the Prognosis I cohort (prognosis worse than 50% in 5 years) (Table 2). The majority were middle-aged (68.3%), male (53.3%), and White (58.2%). Soft tissue tumors were the overwhelming majority (80.3%), followed by tumors of other origin (12.3%). And 44.0% of patients did not pursue any type of surgery, with a significant majority not pursuing radiation (82.5%). A small majority continued with chemotherapy (51.4%).
Frequency of demographic and therapeutic factors of poor prognosis primary malignant cardiac tumors.
| Variable | Category | Count | Percent |
|---|---|---|---|
| Age group | Middle (45–64 years) | 250 | 68.31 |
| Age group | Elderly (≥ 65 years) | 85 | 23.22 |
| Age group | Youth (< 45 years) | 31 | 8.47 |
| Sex | Male | 195 | 53.28 |
| Sex | Female | 171 | 46.72 |
| Race | White | 213 | 58.20 |
| Race | Other | 107 | 29.23 |
| Race | Black | 46 | 12.57 |
| Surgery | None | 161 | 43.99 |
| Surgery | Simple/partial surgical removal of the primary site | 57 | 15.57 |
| Surgery | Excisional biopsy | 50 | 13.66 |
| Surgery | Local tumor excision, NOS | 44 | 12.02 |
| Surgery | Debulking surgery | 20 | 5.46 |
| Surgery | Enucleation | 13 | 3.55 |
| Surgery | Local tumor excision, partial/total removal, laser excision | 7 | 1.91 |
| Surgery | Radical surgery | 7 | 1.91 |
| Surgery | Surgery, NOS | 4 | 1.09 |
| Surgery | Unknown/death | 2 | 0.55 |
| Surgery | Polypectomy | 1 | 0.27 |
| Radiation | None | 302 | 82.51 |
| Radiation | Radiation | 64 | 17.49 |
| Chemotherapy | Yes | 188 | 51.37 |
| Chemotherapy | None | 178 | 48.63 |
| Income | Above (≥ $75,000) | 270 | 73.77 |
| Income | Below (< $75,000) | 96 | 26.23 |
| Rural-urban | Urban | 326 | 89.07 |
| Rural-urban | Rural | 40 | 10.93 |
| Prognosis group | I (< 50% survival at 5 years) | 366 | 100.00 |
| Cancer subtype | Soft tissue | 294 | 80.33 |
| Cancer subtype | Other | 45 | 12.30 |
| Cancer subtype | Heme | 24 | 6.56 |
| Cancer subtype | Embryonal | 3 | 0.82 |
| Metastasis—bone | No | 191 | 52.19 |
| Metastasis—bone | N/A | 147 | 40.16 |
| Metastasis—bone | Yes | 28 | 7.65 |
| Metastasis—brain | No | 206 | 56.28 |
| Metastasis—brain | N/A | 150 | 40.98 |
| Metastasis—brain | Yes | 10 | 2.73 |
| Metastasis—liver | No | 198 | 54.10 |
| Metastasis—liver | N/A | 149 | 40.71 |
| Metastasis—liver | Yes | 19 | 5.19 |
| Metastasis—lung | No | 173 | 47.27 |
| Metastasis—lung | N/A | 147 | 40.16 |
| Metastasis—lung | Yes | 46 | 12.57 |
| Tumor size (per mm) | Median | 65 | |
| Tumor size (per mm) | IQR | 35 | |
N/A: not applicable; NOS: not otherwise specified; IQR: interquartile range.
There were 356 patients included in the improved prognosis cohort (50–95% survival in 5 years) (Table 3). A small majority were elderly (47.5%), male (51.1%), and White (62.4%). The majority were hematological cancers (52.0%). A small majority did not have surgery (53.9%), with a significant majority not having radiotherapy (85.4%). A majority of patients had chemotherapy (55.9%).
Frequency of demographic and therapeutic factors of improved prognosis primary malignant cardiac tumors.
| Variable | Category | Count | Percent |
|---|---|---|---|
| Age group | Elderly (≥ 65 years) | 169 | 47.5 |
| Age group | Middle (45–64 years) | 157 | 44.1 |
| Age group | Youth (< 45 years) | 30 | 8.4 |
| Sex | Male | 182 | 51.1 |
| Sex | Female | 174 | 48.9 |
| Race | White | 222 | 62.4 |
| Race | Other | 111 | 31.2 |
| Race | Black | 23 | 6.4 |
| Surgery | None | 192 | 53.9 |
| Surgery | Excisional biopsy | 48 | 13.5 |
| Surgery | Simple/partial surgical removal of primary site | 47 | 13.2 |
| Surgery | Local tumor excision, NOS | 24 | 6.7 |
| Surgery | Debulking surgery | 15 | 4.2 |
| Surgery | Radical surgery | 9 | 2.5 |
| Surgery | Local tumor excision, partial/total removal, laser excision | 7 | 2.0 |
| Surgery | Enucleation | 5 | 1.4 |
| Surgery | Surgery, NOS | 5 | 1.4 |
| Surgery | Unknown/death | 2 | 0.6 |
| Surgery | Local tumor destruction, NOS | 1 | 0.3 |
| Surgery | Local tumor excision, partial/total removal, cryosurgery | 1 | 0.3 |
| Radiation | None | 304 | 85.4 |
| Radiation | Radiation | 52 | 14.6 |
| Chemotherapy | Yes | 199 | 55.9 |
| Chemotherapy | None | 157 | 44.1 |
| Income | Above (≥ $75,000) | 261 | 73.3 |
| Income | Below (< $75,000) | 95 | 26.7 |
| Rural-urban | Urban | 328 | 92.1 |
| Rural-urban | Rural | 28 | 7.9 |
| Prognosis group | II (50–95% survival at 5 years) | 356 | 100.0 |
| Cancer subtype | Heme | 185 | 52.0 |
| Cancer subtype | Soft tissue | 159 | 44.7 |
| Cancer subtype | Other | 8 | 2.2 |
| Cancer subtype | Embryonal | 4 | 1.1 |
| Metastasis—bone | N/A | 217 | 61.0 |
| Metastasis—bone | No | 133 | 37.4 |
| Metastasis—bone | Yes | 6 | 1.7 |
| Metastasis—brain | N/A | 217 | 61.0 |
| Metastasis—brain | No | 135 | 37.9 |
| Metastasis—brain | Yes | 4 | 1.1 |
| Metastasis—liver | N/A | 217 | 61.0 |
| Metastasis—liver | No | 134 | 37.6 |
| Metastasis—liver | Yes | 5 | 1.4 |
| Metastasis—lung | N/A | 217 | 61.0 |
| Metastasis—lung | No | 131 | 36.8 |
| Metastasis—lung | Yes | 8 | 2.2 |
| Tumor size (per mm) | Median | 66 | |
| Tumor size (per mm) | IQR | 48.5 | |
N/A: not applicable; NOS: not otherwise specified; IQR: interquartile range.
Small correlations were found between several factors and survival in months, as seen in Table 4. Notably, tumors characterized by the study as having poor prognosis were associated with fewer months of survival (ρ = –0.181; p < 0.0001). Chemotherapy was associated with fewer survival in months (ρ = –0.397; p < 0.0001) while radiotherapy was associated with increased months of survival (ρ = 0.117; p < 0.01).
Correlational analysis of demographic factors and therapeutic strategies, and survival in all tumor types.
| Variable | Type | Correlation | p-value |
|---|---|---|---|
| Tumor size (per mm) | Continuous | 0.250476579 | 0.0043 |
| Age recode with < 1 year old and 90+ | Categorical | –0.075815532 | 0.0406 |
| Sex | Categorical | 0.036647961 | 0.3228 |
| Race and origin recode (NHW, NHB, NHAIAN, NHAPI, Hispanic) | Categorical | 0.005393235 | 0.8843 |
| RX Summ—Surg Prim Site (1998+) | Categorical | 0.002661549 | 0.9428 |
| Radiation recode | Categorical | 0.117303122 | 0.0015 |
| Chemotherapy recode (yes, no/unknown) | Categorical | –0.396603804 | 0.0000 |
| Median household income inflation-adjusted to 2022 | Categorical | –0.02628622 | 0.4783 |
| Rural-urban continuum code | Categorical | 0.004912835 | 0.8946 |
| ICD-O-3 Hist/behavior | Categorical | 0.120800191 | 0.0011 |
| Prognosis (I, II, III) | Categorical | –0.180536742 | 0.0000 |
| Cancer subtype | Categorical | 0.086727803 | 0.0191 |
| SEER Combined Mets at DX-bone (2010+) | Categorical | 0.117700998 | 0.0014 |
| SEER Combined Mets at DX-brain (2010+) | Categorical | 0.075304502 | 0.0419 |
| SEER Combined Mets at DX-liver (2010+) | Categorical | 0.104129826 | 0.0049 |
| SEER Combined Mets at DX-lung (2010+) | Categorical | 0.094516858 | 0.0106 |
| Sequence number | Categorical | 0.052458979 | 0.1568 |
NHAIAN: non-Hispanic American Indian/Alaska Native; NHAPI: Non-Hispanic Asian/Pacific Islander; NHB: non-Hispanic Black; NHW: non-Hispanic Whites; SEER: Surveillance, Epidemiology, and End Results.
Table 5 lists all correlations between factors and survival in months. Chemotherapy was moderately associated with improved survival in months (ρ = 0.457; p < 0.0001) while radiotherapy was loosely associated with increases in survival in months (ρ = 0.137; p < 0.01).
Correlational analysis of demographic factors and therapeutic strategies, and survival in poor-prognosis tumor types.
| Variable | Type | Correlation | p-value |
|---|---|---|---|
| Tumor size (per mm) | Continuous | –0.14908 | 0.1632 |
| Age recode with < 1 year old and 90+ | Categorical | –0.16054 | 0.0021 |
| Sex | Categorical | –0.03116 | 0.5524 |
| Race and origin recode (NHW, NHB, NHAIAN, NHAPI, Hispanic) | Categorical | 0.016637 | 0.7511 |
| RX Summ—Surg Prim Site (1998+) | Categorical | –0.01497 | 0.7753 |
| Radiation recode | Categorical | 0.136765 | 0.0088 |
| Chemotherapy recode (yes, no/unknown) | Categorical | 0.457487 | 0.0000 |
| Median household income inflation-adjusted to 2022 | Categorical | –0.03 | 0.5673 |
| Rural-urban continuum code | Categorical | –0.01419 | 0.7867 |
| ICD-O-3 Hist/behavior | Categorical | –0.01315 | 0.8020 |
| Cancer subtype | Categorical | –0.07452 | 0.1548 |
| SEER Combined Mets at DX-bone (2010+) | Categorical | 0.0276 | 0.5987 |
| SEER Combined Mets at DX-brain (2010+) | Categorical | –0.01508 | 0.7737 |
| SEER Combined Mets at DX-liver (2010+) | Categorical | 0.00000685 | 0.9999 |
| SEER Combined Mets at DX-lung (2010+) | Categorical | –0.0039 | 0.9407 |
| Sequence number | Categorical | –0.10017 | 0.0555 |
NHAIAN: non-Hispanic American Indian/Alaska Native; NHAPI: Non-Hispanic Asian/Pacific Islander; NHB: non-Hispanic Black; NHW: non-Hispanic Whites; SEER: Surveillance, Epidemiology, and End Results.
Table 6 describes all the significant correlations found in the improved prognosis group. Increasing tumor size was associated with improved survival (ρ = 0.504; p < 0.01). Chemotherapy was associated with decreases in survival months (ρ = –0.337; p < 0.0001).
Correlational analysis of demographic factors and therapeutic strategies, and survival in improved prognosis tumor types.
| Variable | Type | Correlation | p-value |
|---|---|---|---|
| Tumor size (per mm) | Continuous | 0.5044 | 0.0011 |
| Age recode with <1 year old and 90+ | Categorical | –0.1227 | 0.0206 |
| Sex | Categorical | 0.1013 | 0.0561 |
| Race and origin recode (NHW, NHB, NHAIAN, NHAPI, Hispanic) | Categorical | –0.0521 | 0.3267 |
| RX Summ—Surg Prim Site (1998+) | Categorical | –0.0009 | 0.9862 |
| Radiation recode | Categorical | 0.1174 | 0.0268 |
| Chemotherapy recode (yes, no/unknown) | Categorical | –0.3372 | 0.0000 |
| Median household income inflation-adjusted to 2022 | Categorical | –0.0129 | 0.8078 |
| Rural-urban continuum code | Categorical | 0.0479 | 0.3679 |
| ICD-O-3 Hist/behavior | Categorical | 0.1924 | 0.0003 |
| Cancer subtype | Categorical | 0.1714 | 0.0012 |
| SEER Combined Mets at DX-bone (2010+) | Categorical | 0.1485 | 0.0050 |
| SEER Combined Mets at DX-brain (2010+) | Categorical | 0.1144 | 0.0309 |
| SEER Combined Mets at DX-liver (2010+) | Categorical | 0.1454 | 0.0060 |
| SEER Combined Mets at DX-lung (2010+) | Categorical | 0.1030 | 0.0522 |
| Sequence number | Categorical | 0.0980 | 0.0647 |
NHAIAN: non-Hispanic American Indian/Alaska Native; NHAPI: Non-Hispanic Asian/Pacific Islander; NHB: non-Hispanic Black; NHW: non-Hispanic Whites; SEER: Surveillance, Epidemiology, and End Results.
Table 7 depicts statistically significant predictors of hazard from explorative Cox proportional hazards models stratified by cohort.
Statistically significant results in an explorative multivariable Cox proportional hazards regression model.
| Cohort | Predictor | Hazard ratio (95 % CI) | p-value |
|---|---|---|---|
| All tumors (n = 730) | Age—middle (45–64 years; n = 413) vs elderly (≥ 65 years; n = 256) | 0.69 (0.50–0.95) | 0.019 |
| Age—youth (< 45 years; n = 61) vs elderly (≥ 65 years; n = 256) | 0.52 (0.35–0.78) | 0.003 | |
| Brain metastases (yes; n = 14 vs no; n = 343) | 2.04 (1.01–4.11) | 0.047 | |
| Lung metastases (yes; n = 54 vs no; n = 306) | 1.89 (1.15–3.10) | 0.011 | |
| Prognosis I (n = 366) | Tumor size (per mm) | 1.01 (1.00–1.02) | 0.031 |
| Age—middle (45–64 years; n = 250) vs elderly (≥ 65 years; n = 85) | 0.56 (0.37–0.83) | 0.005 | |
| Age—youth (< 45 years; n = 31) vs elderly (≥ 65 years; n = 85) | 0.49 (0.32–0.75) | 0.004 | |
| Surgery—local tumour excision (n = 44) | 0.63 (0.40–1.00) | 0.050 | |
| Surgery—partial resection (n = 57) | 0.44 (0.23–0.82) | 0.021 | |
| Prognosis II (n = 356) | Age—middle (45–64 years; n = 157) vs elderly (≥ 65 years; n = 169) | 0.59 (0.42–0.83) | 0.003 |
| Age—youth (< 45 years; n = 30) vs elderly (≥ 65 years; n = 169) | 0.52 (0.34–0.80) | 0.004 | |
| Surgery—excisional biopsy (n = 48) | 0.50 (0.25–0.99) | 0.049 | |
| Surgery—unknown or death (n = 2) | 1.54 (1.15–2.07) | 0.004 | |
| Brain metastases (yes; n = 4 vs no; n = 135) | 2.43 (1.16–5.09) | 0.017 | |
| Lung metastases (yes; n = 8 vs no; n = 131) | 1.93 (1.17–3.18) | 0.010 | |
| Hematological (n = 212) | Age—middle (45–64 years; n = 72) vs elderly (≥ 65 years; n = 134) | 0.30 (0.17–0.55) | 0.001 |
| Age—youth (< 45 years; n = 6) vs elderly (≥ 65 years; n = 134) | 0.13 (0.04–0.38) | 0.000 | |
| Race—NHAPI (n = 29) vs others (n = 183) | 0.41 (0.18–0.90) | 0.026 | |
| Race—Hispanic (n = 33) vs non-Hispanic (n = 179) | 0.38 (0.17–0.85) | 0.020 | |
| Surgery—excisional biopsy (n = 10) | 0.44 (0.20–0.97) | 0.047 | |
| Surgery—unknown/death (n = 3) | 2.18 (1.26–3.78) | 0.006 | |
| Soft tissue (n = 458) | Tumor size (per mm) | 1.02 (1.00–1.03) | 0.017 |
| Age—middle (45–64 years; n = 311) vs elderly (≥ 65 years; n = 99) | 0.46 (0.33–0.65) | 0.000 | |
| Age—youth (< 45 years; n = 48) vs elderly (≥ 65 years; n = 99) | 0.30 (0.20–0.44) | 0.000 | |
| Surgery—enucleation (n = 14) | 0.39 (0.20–0.77) | 0.003 | |
| Surgery—excisional biopsy (n = 83) | 0.36 (0.20–0.65) | 0.001 | |
| Surgery—local tumour excision (n = 54) | 0.35 (0.23–0.53) | 0.000 | |
| Surgery—partial resection (n = 90) | 0.44 (0.27–0.71) | 0.000 | |
| Other (n = 53) | Race—NHAPI (n = 5) vs others (n = 48) | 0.12 (0.03–0.52) | 0.004 |
| Race—Hispanic (n = 8) vs non-Hispanic (n = 45) | 0.17 (0.04–0.65) | 0.009 | |
| Surgery—partial resection (n = 4) | 0.37 (0.18–0.76) | 0.007 | |
| Income—upper quartile (n = 41) | 1.73 (1.09–2.75) | 0.022 |
NHAPI: Non-Hispanic Asian/Pacific Islander.
In the All tumors cohort, younger age was protective [middle vs elderly hazard ratio (HR) 0.69 (0.50–0.95); p = 0.019; youth vs elderly HR 0.52 (0.35–0.78); p = 0.003] while brain and lung metastases conferred higher hazard (HR 2.04 and 1.89; p = 0.047 and p = 0.011, respectively).
In Prognosis I, larger tumor size was associated with a small per-mm increase in hazard (HR 1.01; p = 0.031). Younger age was protective (middle HR 0.56; p = 0.005; youth HR 0.49; p = 0.004). Limited surgical interventions were associated with lower hazard, including local excision (HR 0.63; p = 0.050) and partial resection (HR 0.44; p = 0.021).
In Prognosis II, younger age again, reduced hazard (middle HR 0.59; p = 0.003; youth HR 0.52; p = 0.004). Excisional biopsy was protective (HR 0.50; p = 0.049), whereas “unknown/death” surgical status was associated with increased hazard (HR 1.54; p = 0.004). Brain and lung metastases remained adverse (HR 2.43 and 1.93; p = 0.017 and p = 0.010).
In Hematological cancers, the age gradient was pronounced (middle HR 0.30; p = 0.001; youth HR 0.13; p < 0.0001). Non-Hispanic Asian/Pacific Islander (NHAPI) race and Hispanic ethnicity were associated with lower hazard (HR 0.41; p = 0.026 and HR 0.38; p = 0.020). Excisional biopsy was protective (HR 0.44; p = 0.047), while unknown/death surgical status increased hazard (HR 2.18; p = 0.006).
In Soft tissue tumors, size showed a modest per-mm hazard increase (HR 1.02; p = 0.017). Younger age was protective (middle HR 0.46; p < 0.0001; youth HR 0.30; p < 0.0001). Several procedures were associated with reduced hazard, including enucleation (HR 0.39; p = 0.003), excisional biopsy (HR 0.36; p = 0.001), local excision (HR 0.35; p < 0.0001), and partial resection (HR 0.44; p < 0.0001).
In Other tumors, NHAPI race and Hispanic ethnicity were associated with lower hazard (HR 0.12; p = 0.004 and HR 0.17; p = 0.009). Partial resection was protective (HR 0.37; p = 0.007), whereas upper-quartile income was associated with higher hazard (HR 1.73; p = 0.022).
As seen in Table 8, the statistical significance in survival probability was noted by prognosis grouping and cancer subtype most definitively across time points (p < 0.001). Prognosis II maintains consistently improved survival compared to Prognosis I at 30, 60, and 120 months time points. Chemotherapy status also showed strong separation of survival curves at 30, 60, and 120 months (p < 0.001). Brain metastasis was consistently associated with poorer survival at all evaluated intervals (30 months: p = 0.017; 60 months: p = 0.017; 120 months: p = 0.017), while bone metastasis was associated with poorer short- and intermediate-term survival (30 months: p = 0.017; 60 months: p = 0.028) with attenuation by 120 months (p = 0.084). Lung metastasis was associated with poorer short-term survival at 30 months (p = 0.046), but was not sustained over time. Liver metastasis did not significantly separate survival curves at any interval examined. Sex, age, race, tumor size category, income, and rural-urban status were not associated with durable long-term differences in unadjusted survival.
Results of Kaplan-Meier survival curve for all tumors summarized.
| Variable | 30-month log-rank p-value | 60-month log-rank p-value | 120-month log-rank p-value |
|---|---|---|---|
| Age group | 0.117 | 0.178 | 0.061 |
| Sex | 0.123 | 0.101 | 0.069 |
| Race | 0.729 | 0.637 | 0.543 |
| Radiation | 0.036 | 0.105 | 0.067 |
| Chemotherapy | < 0.001 | < 0.001 | < 0.001 |
| Tumor size category | 0.310 | 0.243 | 0.169 |
| Income | 0.478 | 0.673 | 0.554 |
| Rural-urban status | 0.818 | 0.889 | 0.767 |
| Prognosis group (II vs I) | < 0.001 | < 0.001 | < 0.001 |
| Cancer subtype | < 0.001 | < 0.001 | < 0.001 |
| Bone metastasis | 0.017 | 0.028 | 0.084 |
| Brain metastasis | 0.017 | 0.017 | 0.017 |
| Liver metastasis | 0.786 | 0.786 | 0.631 |
| Lung metastasis | 0.046 | 0.101 | 0.145 |
This study utilizes the SEER data regarding PMCTs and provides prognostic stratifications, specifically Prognosis I (< 50% 5-year survival) and Prognosis II (50–95% 5-year survival). While these two groups were similar in size, their demographic, histologic, and treatment-related characteristics were notably different, suggesting distinct disease processes that may require different therapeutic strategies.
Across all tumors (Table 1), the majority of patients were middle-aged (56.6%), male (52.5%), and White (60.1%). Prognosis I (Table 2) skewed younger, with 68.3% middle-aged, while Prognosis II (Table 3) skewed older, with 47.5% ≥ 65 years old. The Cox analysis (Table 7) confirmed younger age as consistently protective, with HRs of 0.52–0.69 compared to elderly patients. Older patients in Prognosis II may be more limited by comorbidities, influencing both treatment selection and survival outcomes. These results are consistent with prior studies demonstrating that younger patients tolerate aggressive multimodality treatment better and are more likely to undergo and survive large surgeries [2, 14].
Race and ethnicity distributions also differed. White patients made up the majority in both groups, but were not significantly correlated with outcomes within Prognosis I or II. Prognosis II had a higher proportion of Hispanic patients compared with Prognosis I. Findings from the hematologic tumor cohort in Table 7 suggested that NHAPI had a lower hazard of death compared to all of the other races included in the cohort (HR = 0.41). Hispanic patients had a lower hazard of death compared to non-Hispanic Whites (HR = 0.38). Similar findings were found in the “Other” tumor cohort in Table 7, where lower HRs were observed for NHAPI compared to other races (HR = 0.12) and for Hispanic patients compared to non-Hispanic Whites (HR = 0.17). While surface-level observation of this data may be of interest, these subgroups included only a small number of patients. As a result, these findings should be interpreted carefully, as small sample sizes may cause HRs that are skewed and not representative of the generalized population. Therefore, these findings should be used as an exploratory idea rather than a definitive finding.
Prognosis I tumors were predominantly soft tissue sarcomas (80.3%), while Prognosis II was composed primarily of hematologic malignancies (52.0%). These findings may reflect the locally aggressive nature of sarcomas compared to the systemic effects of hematologic malignancies. This distinction is consistent with contemporary institutional series of primary cardiac sarcoma, which report aggressive local invasion, high rates of early metastasis, and median survival often less than two years despite treatment [15].
In Prognosis I, surgical resection was strongly associated with improved survival, with partial resection (HR 0.44, p = 0.021) and local excision (HR 0.63, p = 0.050) demonstrating protective effects. Chemotherapy also correlated with longer survival (ρ = 0.457, p < 0.0001), consistent with prior reports where multimodal therapy extended survival in cardiac sarcomas despite high recurrence rates [16, 17]. Importantly, larger tumor size predicted worse outcomes (HR 1.01 per mm, p = 0.031), emphasizing the value of early diagnosis and surgical referral to maximize resectability.
In Prognosis II, surgery played a limited role, with only excisional biopsy showing benefit (HR 0.50, p = 0.049). Prognosis in this group was instead dominated by systemic progression, specifically brain metastasis (HR 2.43, p = 0.017) and lung metastasis (HR 1.93, p = 0.010). Chemotherapy was conversely associated with poorer survival (ρ = –0.337, p < 0.0001), likely reflecting confounding with advanced disease, but also emphasizing the limited strength of current chemotherapeutic regimens for primary cardiac lymphomas [18].
These findings highlight that Prognosis I outcomes are highly influenced by resectability, while Prognosis II outcomes depend on systemic disease control. Even partial resections in sarcomas may provide prolonged survival. This differs from the hematologic tumors that dominated Prognosis II, where systemic therapy would provide improved prognosis outcomes. Our analysis reflects a nuanced histopathological understanding of current standards regarding prognosis categories, thus helping inform the etiology of PMCT outcome stratifications within the SEERs database.
Interestingly, tumor size carried opposite implications across prognosis groups. In Prognosis I, larger tumor size predicted increased hazard (HR 1.01, p = 0.031, Table 7), reinforcing that early diagnosis improves resectability and outcomes. In Prognosis II, however, tumor size paradoxically correlated with improved survival (ρ = 0.50, p = 0.001, Table 6). This is likely a measurement artifact: Hematologic malignancies may present diffusely, appearing “larger” without conferring worse outcomes, whereas small sarcomas may already reflect aggressive biology.
Metastasis emerged as a dominant determinant of survival. Across all tumors (Table 7), brain (HR 2.04, p = 0.047) and lung metastases (HR 1.89, p = 0.011) were associated with significantly worse survival. This pattern was especially pronounced in Prognosis II, reflecting the systemic nature of hematologic disease. These findings reinforce the importance of comprehensive staging at diagnosis, including advanced imaging modalities such as cardiac MRI and PET/CT, to assess for systemic spread [19].
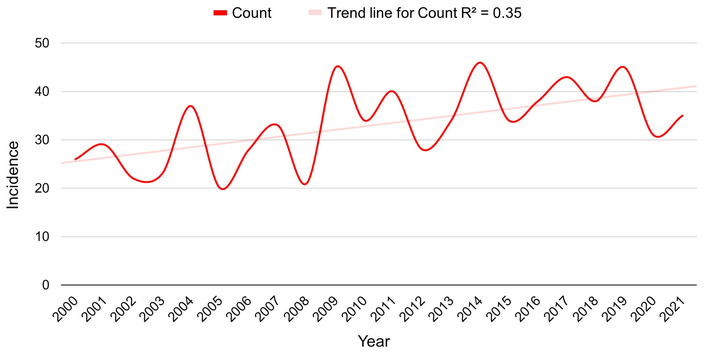
Figures 1 and 2 demonstrate a gradual increase in PMCT incidence over time, representing overall incidence and poor-prognosis incidence, respectively. While this could reflect a true biological increase, it is more likely due to improved detection through advanced imaging and greater diagnostic awareness. This parallels trends in other rare tumors, where incidence rates have risen with increased imaging utilization [2]. The continual uptick in reported cases emphasizes the importance of earlier implementation of cardiac imaging, such as echocardiography or cardiac MRI, in patients presenting with unexplained cardiopulmonary symptoms. When examining Figure 3, rates increased and plateaued in the 2010s compared with the 2000s, followed by a gradual decline in the later years of the dataset. This trend contrasts with the patterns observed in poor-prognosis and overall PMCT incidence. These findings may suggest a shift in the distribution of PMCT prognostic categories over the study period, with potentially fewer improved-prognosis tumors being diagnosed in recent years. This may be related to surveillance factors, such as increased reporting, clinical recognition of more aggressive tumors, or improvements in diagnostic tests that enhance identification of higher-risk tumors. Overall, the trends shown in the figures likely reflect evolving diagnostic and reporting practices that may influence observed incidence patterns rather than reflecting true changes in tumor biology.
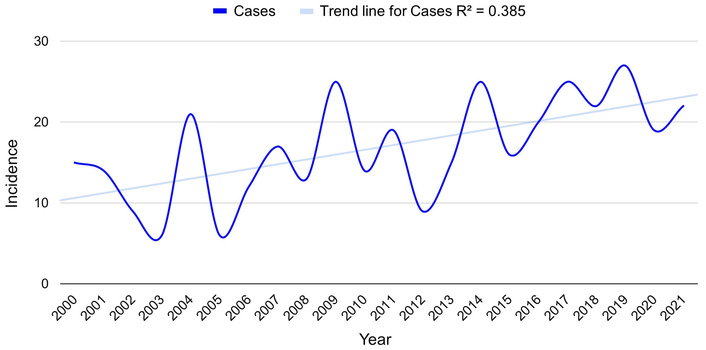
Incidence of poor-prognosis primary malignant cardiac tumors between 2000 and 2021.
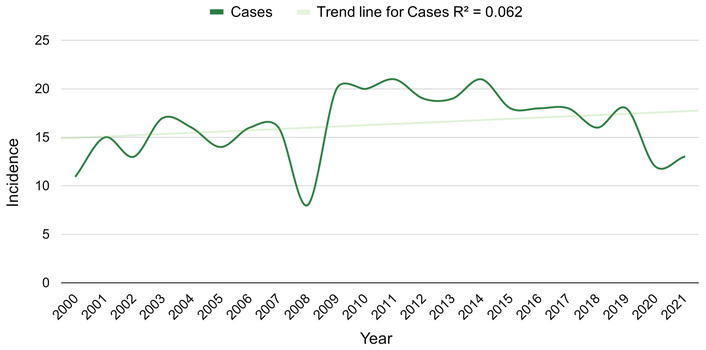
Incidence of improved prognosis primary malignant cardiac tumors between 2000 and 2021.
These findings reinforce that prognostic grouping carries clinical significance:
Prognosis I (sarcoma-dominant): Aggressive multimodality therapy is warranted, with early surgical referral emphasized. Partial resections provide tangible benefit, and chemotherapy should be integrated into multimodal treatment planning. Early imaging to detect resectable disease is also essential.
Prognosis II (hematologic-dominant): Systemic therapy, not surgery, should be prioritized. The poor outcomes associated with chemotherapy highlight the need to adapt hematologic oncology advances like rituximab-based regimes or CAR-T into cardiac manifestations of hematologic malignancies.
Across all PMCTs: Younger age and absence of metastasis are the strongest consistent predictors of survival. This emphasizes the importance of earlier diagnosis, comprehensive staging, and targeted therapeutics for optimal survival outcomes.
This study design has various limitations. First, the rarity of PMCTs, as well as the use of SEER data collection, introduces inherent selection and reporting biases that may have affected the generalizability of the findings. Given that this is the largest database that includes this tumor type, it is the best current understanding of PMCTs, but it is worth noting that as more data becomes available, the results could shift. Another key limitation of using the SEER database is the potential for confounding variables inherent in its retrospective design. Treatment modalities such as radiation, surgical resection, or chemotherapy cannot be interpreted as independently or collectively effective due to unmeasured confounders and lack of randomization. Also, the heterogeneity in the collection of data into the SEER database, such as institution-to-institution diagnostic criteria, follow-up, or treatment approaches, may have indirectly skewed the results. Furthermore, survival outcomes may have been further influenced by unmeasured variables such as referral patterns, supportive care differences, among others, all of which may have played a role in the variables measured in the paper. Next, the sample size for some of the variables, such as people who received radiotherapy, was very small, which may have played a role in the statistically significant findings noted. Another limitation revolves around the fact that since metastasis data only became consistently available in the SEER database starting in 2010 until 2021, analyses based on metastatic data would reflect only a subset of the overall study population, which spanned from 2000 to 2021. Thus, analyses done between metastatic burden and the overall study population may not be directly comparable due to various shifts in medicine, including diagnostic practices, staging accuracy, and treatment patterns during these 10 extra years. These potential shifts in medicine and PMCT care may influence the interpretation of any results and skew potential relationships investigated. The improved survival associated with surgery and chemotherapy in sarcomas may reflect selection bias, as those eligible for surgery and/or chemotherapy could have had a less severe manifestation of PMCTs to be eligible for said treatment options. Finally, because proportional hazards diagnostics were not formally assessed, interpretation of the Cox regression findings should be considered exploratory. Still, our results provide hypothesis-generating factors that contribute to primary cardiac tumor therapy and survival.
PMCTs remain an exceptionally rare cancer that is functionally challenging to manage. This study, using the SEER database, serves as a large analysis of this tumor type, offering insight into trends in incidence, demographic patterns, histologic distributions, and survival predictors. Prognosis I tumors, which were predominantly soft tissue sarcomas, were largely influenced by size and resectability, whereas Prognosis II tumors, which were often hematologic, were more strongly affected by metastases. Younger ages consistently conferred survival advantages for both groups, and select surgical interventions and chemotherapy helped improve outcomes in Prognosis I. Both groups were severely affected by metastases, especially to the lung and brain. Furthermore, PMCTs are very heterogeneous, where tumor biology not only affects prognosis, but also the ability to intervene surgically and the presence of metastatic spread.
While limited by the retrospective nature of the SEER database and incomplete areas of data collection, the results indicate an important principle of early diagnosis, screening, and tailored treatment strategies. Moving forward, prospective multicenter studies and genomic profiling may refine the classification of these tumor types, identify strong therapeutic targets, and ultimately improve outcomes for this rare but devastating group of tumors.
CT: computed tomography
HR: hazard ratio
KM: Kaplan-Meier
MRI: magnetic resonance imaging
NHAPI: Non-Hispanic Asian/Pacific Islander
OS: overall survival
PET: positron emission tomography
PMCTs: primary malignant cardiac tumors
SEER: Surveillance, Epidemiology, and End Results
The supplementary table for this article is available at: https://www.explorationpub.com/uploads/Article/file/1012107_sup_1.xlsx.
The authors would like to thank the University of Missouri-Kansas City School of Medicine for its academic support and scholarly resources.
RM: Conceptualization, Investigation, Writing—original draft, Writing—review & editing, Project administration, Supervision. ZM: Investigation, Data curation, Writing—original draft, Writing—review & editing. SK: Data curation, Formal analysis, Resources, Validation, Writing—original draft, Writing—review & editing. JJ: Writing—original draft, Writing—review & editing. TA: Supervision, Project administration. All authors read and approved the submitted version.
The authors declare no conflicts of interest.
This study utilized de-identified data from the publicly available Surveillance, Epidemiology, and End Results (SEER) Program database. As the dataset contains no identifiable patient information and involves no direct interaction with human participants, this study was considered exempt from Institutional Review Board review and the requirement for informed consent was waived, consistent with the ethical principles outlined in the Declaration of Helsinki.
This study utilized de-identified data from the publicly available Surveillance, Epidemiology, and End Results (SEER) Program database. As the dataset contains no identifiable patient information and involves no direct interaction with human participants, the informed consent was waived, consistent with the ethical principles outlined in the Declaration of Helsinki.
Informed consent was waived because this study used publicly available, de-identified data from the Surveillance, Epidemiology, and End Results (SEER) Program database, which contains anonymized cancer registry information collected for public health surveillance. No identifiable patient information was accessed.
Data is publicly available and submitted with the manuscript as supplemental materials. The data analyzed in this study were obtained from the SEER database. Requests for access to these datasets should be directed to https://seer.cancer.gov/data/access.html.
This study was not supported by any sponsor or funder.
© The Author(s) 2026.
Open Exploration maintains a neutral stance on jurisdictional claims in published institutional affiliations and maps. All opinions expressed in this article are the personal views of the author(s) and do not represent the stance of the editorial team or the publisher.
Copyright: © The Author(s) 2026. This is an Open Access article licensed under a Creative Commons Attribution 4.0 International License (https://creativecommons.org/licenses/by/4.0/), which permits unrestricted use, sharing, adaptation, distribution and reproduction in any medium or format, for any purpose, even commercially, as long as you give appropriate credit to the original author(s) and the source, provide a link to the Creative Commons license, and indicate if changes were made.

View: 639
Download: 30
Times Cited: 0