 Original Article

Affiliation:
1Universidade Católica Portuguesa, CBQF (Centro de Biotecnologia e Química Fina)-Laboratório Associado, Escola Superior de Biotecnologia, 4169-005 Porto, Portugal
2LAQV-REQUIMTE-Laboratório Associado, Department of Chemistry, University of Aveiro, 3810-193 Aveiro, Portugal
Email: lgcastro@ucp.pt
ORCID: https://orcid.org/0000-0002-4082-9679
Affiliation:
1Universidade Católica Portuguesa, CBQF (Centro de Biotecnologia e Química Fina)-Laboratório Associado, Escola Superior de Biotecnologia, 4169-005 Porto, Portugal
ORCID: https://orcid.org/0000-0001-6205-1266
Affiliation:
1Universidade Católica Portuguesa, CBQF (Centro de Biotecnologia e Química Fina)-Laboratório Associado, Escola Superior de Biotecnologia, 4169-005 Porto, Portugal
ORCID: https://orcid.org/0000-0002-7705-2293
Affiliation:
2LAQV-REQUIMTE-Laboratório Associado, Department of Chemistry, University of Aveiro, 3810-193 Aveiro, Portugal
ORCID: https://orcid.org/0000-0003-4175-2498
Affiliation:
2LAQV-REQUIMTE-Laboratório Associado, Department of Chemistry, University of Aveiro, 3810-193 Aveiro, Portugal
ORCID: https://orcid.org/0000-0002-5536-6056
Affiliation:
1Universidade Católica Portuguesa, CBQF (Centro de Biotecnologia e Química Fina)-Laboratório Associado, Escola Superior de Biotecnologia, 4169-005 Porto, Portugal
ORCID: https://orcid.org/0000-0002-0760-3184
Explor Foods Foodomics. 2025;3:101092 DOI: https://doi.org/10.37349/eff.2025.101092
Received: March 19, 2025 Accepted: June 24, 2025 Published: August 06, 2025
Academic Editor: José Ignacio Alonso-Esteban, Complutense University of Madrid, Spain
The article belongs to the special issue The food (r)evolution towards food quality/security and human nutrition
Aim: Despite being a fruit rich in resistant starch, acorns remain undervalued. Resistant starch is known to improve food acceptability when compared to traditional insoluble fibers, and recent research suggests the usage of acorn starch as an additive in fermented yogurt and milk products. Furthermore, non-thermal technologies such as high hydrostatic pressure and pulsed electric field can produce clean-labelled starches. Milk puddings are widely consumed all over the world and are usually produced using representative amounts of starch, making them an enticing food matrix for incorporating acorn starches. Hence, the effects of replacing commercial corn starch with acorn starch extracted by high hydrostatic pressure and pulsed electric field on the nutritional composition, functional and sensorial properties, and shelf-life of puddings were studied.
Methods: Extraction of starch from Quercus robur acorns was performed using high hydrostatic pressure or pulsed electric field. Extracted starch was used in chocolate puddings, replacing commercial corn starch. Shelf-life storage and microbiological analysis were conducted over 28 days, along with texture, color, pH, and nutritional composition assessments. Rheological properties, scanning electron microscopy, in vitro digestion, and soluble sugar, fatty acid, and salt content analyses were performed. Sensorial analysis was conducted with 71 volunteer panelists to evaluate the acceptability, preference, and similarity of puddings.
Results: Replacing the commercial corn starch with acorn starch improves the rheological properties of puddings and has no negative impact on the nutritional composition, internal structure, or in vitro digestibility. Sensory analysis revealed that panelists preferred the acorn starch puddings over the control. After 28 days of storage at 4°C, there was a greater stabilization of the color parameters and an improvement in textural parameters of puddings without compromising microbial safety.
Conclusions: This study demonstrates the potential usage of starch from acorns in food applications, a fruit that is so undervalued.
From temperate to tropical latitudes in the Americas, Asia, Europe, and North Africa, the Quercus spp. oaks are evergreen, semi-deciduous, or deciduous trees that bear small fruits named acorns [1]. It is estimated that in Portugal, more than 400,000 tons of acorns are produced annually, but more than half are underused [2]. Acorns are rich in carbohydrates, specifically starch, which is mostly resistant starch (RS) [3–5]. While moving through the small intestine, RS is not broken down by digestive enzymes. The intestinal flora ferments it once it reaches the colon, which has many health advantages in addition to fostering its growth [6]. Aside from being perceived as dietary fiber, it can also increase food products’ acceptability by improving palatability when compared to those elaborated with traditional, insoluble fibers [7].
High hydrostatic pressure (HP) and pulsed electric field (PEF) are non-thermal technologies that assist extraction processes from several matrices using water as extraction solvent with generally high extraction yields, improved selectivity, ability to preserve thermolabile compounds, but they have also been applied to modifying starch properties [8, 9]. In addition, starches obtained from these technologies are considered clean-labeled starches since they are not chemically modified and thus, not labeled as modified starches under paragraph 19 on Annex I of the Regulation (EC) No. 1333/2008 [10, 11]. According to the available literature, the application of HP and PEF under optimal extraction conditions allowed the modification of Quercus robur acorn starches so that they showed higher solubility values at lower temperatures compared to starches not subjected to pressurization or PEFs [3, 4]. Hence, these results encourage the usage of acorn starch as a food additive in fermented yoghurt and milk products. One of the most important uses of starch is in the manufacturing of desserts and dairy products, such as custard creams, puddings, flans, and ice creams [12]. Milk puddings are consumed regularly all over the world by youngsters to the elderly [13]. Hence, it can be an interesting food matrix for the inclusion of acorn starches. They are semi-solid food products composed of milk, sugar or sweetener, and thickener. Powdered and pre-packaged forms are found in the market, and other ingredients can be added for a variety of flavors [14]. The texture is an important factor that relies on the gelling properties of polysaccharides used, where usually starch and carrageenan may be used to promote both nutritional and sensory characteristics, which are crucial factors in consumer preference [14]. Color overlaps with that of other features, making it the initial criterion for product approval. Chocolate puddings are easy to define and control the sensorial attributes [15]. Both microbiological and physicochemical control of milk puddings must be ensured since they are highly perishable food products with a short shelf-life [16]. This work reports the effect of replacing the usage of commercial corn starch with Q. robur acorn starch extracted using HP and PEF technologies, as a source of RS, on the nutritional composition, functional and sensorial properties of chocolate milk puddings, as well as on their microbiological and physicochemical parameters during storage.
About 5 kg of Q. robur acorns were harvested in the Parque Nacional da Peneda-Gerês, Portugal, region of Assento, Terras de Bouro, and Braga on the morning of November 22, 2018. Oaks were located at Parque Cerdeira (41° 45’ 46.0” N; 8° 11’ 24.2” W), and acorns were collected by hand from the entire ground covered by the oaks’ canopies according to their visible health (absence of putrefaction, mechanical damage, and/or spoilage by larvae were defined as quality controls). Acorns were transported to the laboratory facilities in thermal plastic bags on the same day, washed with tap water to remove the foliage and soil dirt, cleaned with fabric cloth, and stored at –20°C until further use. Then, shells were removed by hand with a kitchen knife, and cotyledons were ground using a food processor (Moulinex®, AD560120 La Moulinnet 1-2-3, Portugal). Flours were screened twice using a 1 mm and a 0.5 mm sieve, homogenized, and stored in small plastic bags under a 75% vacuum at –20°C [5].
The industrial high HP equipment employed featured a 200 mm inner diameter vessel and a 2,000 mm length, with a maximum operating pressure of 600 MPa (Hiperbaric 55; Hiperbaric, Burgos, Spain). The industrial equipment was linked to a refrigeration unit (RMA KH 40 LT, Ferroli, San Bonifacio, Italy) to regulate the temperature of the water used as a pressurizing fluid. An acorn flour suspension (8% w/v) was made using deionized water in low permeability polyamide-polyethylene bags (IdeiaPack—Comércio de Embalagens, Lda, Viseu, Portugal), manually heat-sealed with a minimum quantity of air inside, and placed inside the high HP vessel. Extraction was performed at 333 MPa for 17.4 minutes at room temperature. The compression rate was 250 MPa/min, and decompression was immediate. Then, the acorn suspension was screened using 180 and 40 μm sieves, thoroughly washed with deionized water, and left to stand overnight at 4°C. The starchy material (SM) was dried at 45°C in a ventilated drying chamber until constant weight [4]. The obtained starch was labeled “HP starch”.
An industrial bench-scale continuous PEF system (Diversified Technologies, MA, USA) was used, with two ceramic parallel electrodes (3.5 mm diameter and 4.7 mm spacing) as the treatment chamber. Acorn flour suspension (8% w/v) was made with deionized water and pumped at 800 mL/min through the treatment chamber to be treated at 63.3 µs and 0.1 kV/cm. At 1,400 Hz, exponential unipolar pulses of 9.3 µs were administered. The suspension was at room temperature (22°C) with a conductivity of 1,094 ± 7 µs/cm prior to treatment. Suspension conductivity remained within 8% of starting value, and temperatures did not surpass 26°C following treatment. The acorn residue was screened using 180 and 40 μm diameter mesh sieves, thoroughly washed with water, and left to stand overnight at 4°C. The SM was dried at 45°C in a ventilated drying chamber [3]. The obtained starch was labeled “PEF starch”.
The pectin, white sugar, commercial corn starch, and chocolate milk were purchased from a nearby supermarket. Puddings were prepared by adding 12.5 g of pectin (Condi®, Condi—Alimentar SA, Lisbon), 30 g of white sugar (Sidul®, Sidul Açúcares, Lisbon), and 9.5 g of acorn starch (extracted by HP or PEF) or commercial corn starch (Hacendado®, Spain) to a kitchen pan. Then, 500 mL of chocolate milk (Hacendado®, Iparlat, Cantabria, Spain) was added, and the ingredients were mixed using a kitchen wire wand. Next, the pan was placed on an electric induction cooktop, and the mixture was gradually heated up with constant manual stirring. Reaching the boiling point (≈ 97°C), the mixture was left to cook for 3 min, placed in covered food containers, and placed in a refrigerator at 4°C. Three different batches of each formulation were prepared. Puddings made with commercial corn starch were used as control and labeled as “control pudding”, while puddings elaborated with acorn starch extracted by HP or PEF were labeled as “HP pudding” or “PEF pudding”, respectively (Figure 1).
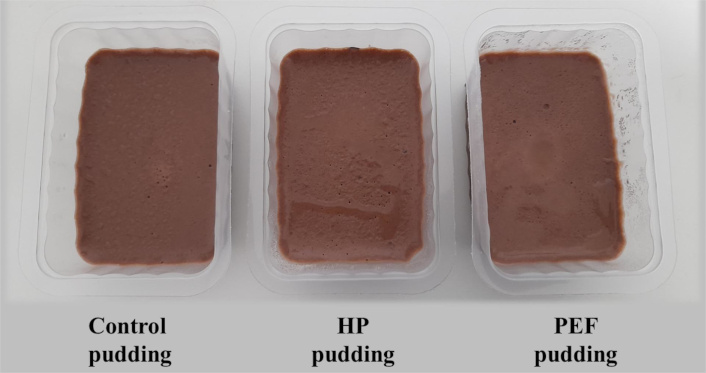
Photographic representation of the control, HP, and PEF chocolate puddings. HP: hydrostatic pressure; PEF: pulsed electric field
The chocolate milk used contained the following declared ingredients: partially skimmed milk (2.3% fat), sugar, inulin, low-fat cocoa (1%), flavoring, stabilizers (E451, E460, and E466), and emulsifier (E471). The pectin used had the following reported ingredients: sugar, gelling agent (apple pectin), dextrose, and a preservative (E200).
Immediately after cooking, a 20 mL sample of all puddings from all batches was poured into sterile plastic cups and quickly sealed tightly while the pudding was still hot. Then, the samples were brought to a refrigerator for storage at 4 ± 1°C.
Microbiological analyses were done on days 0, 8, 15, 21, and 28 according to paragraph 2.2 of chapter 2 of Annex I of the Regulation (EC) No. 2073/2005 [17]. The total aerobic mesophiles were plated in plate count agar prepared in the autoclave and enumerated after incubation at 30 ± 1°C for 3 days [18]. Bacillus cereus bacteria were enumerated using B. cereus agar according to Mossel after incubation at 30 ± 1°C for 2 days [19]. Yeasts and molds were plated in rose-bengal chloramphenicol agar prepared in the autoclave and enumerated after incubation at 25 ± 1°C for 5 days [20]. The Enterobacteriaceae bacteria were plated in violet-red bile glucose agar prepared by boiling and enumerated after incubation at 37 ± 1°C for 2 days [21].
Physicochemical measurements were performed at 4°C in triplicate on days 0 and 28. Texture analysis was done using a TA XT plus (Stable Micro Systems, Surrey, England) with a cylindrical stainless P/6 probe. The distance of penetration was 3 mm, and 0.2 g of trigger force. Hardness, adhesiveness, resilience, cohesiveness, springiness, gumminess, and chewiness were determined using the Exponent software version 6.2 (Stable Micro Systems, Surrey, England). The color was measured using a CROMA METER CR-400 colorimeter (Konica Minolta), and the L* (lightness), a* (red-green component), and b* (yellow-blue component) values were recorded. A CRISON micro pH 2002 potentiometer was used for pH evaluation.
Moisture was determined by drying in an oven at 105°C until constant weight, and the ash content was determined by incineration at 550°C for 5 h [22]. The total protein content was determined by the Kjeldahl method using a protein-nitrogen conversion factor of 6.38 [23]. The total fat content was determined by pre-treatment by boiling with 4 M HCl for 30 min under reflux conditions, followed by Soxhlet extraction using petroleum ether [24]. Total carbohydrate content was determined from the difference between 100 grams of pudding and the partial sum of the protein, ash, and lipid contents. Total dietary fiber contents were determined using a commercial enzymatic kit from Megazyme, Ireland (K-TDFR-200A). The moisture and total solids contents were reported per 100 g of pudding on an as-is basis (g/100 g P), whilst the total ash, protein, fat, total carbohydrates, starch, and dietary fiber contents were reported in their corresponding g per 100 g of pudding on a dry basis (g/100 g DP).
Energy contents were computed using the Atwater factors, i.e., 17 kJ/g for protein, 17 kJ/g for carbohydrates (without the total dietary fiber), 37 kJ/g for fat, and 8 kJ/g for total fiber [25]. Results were expressed as kJ per 1 g of DP (kJ/g DP).
A mass of 5 g of the pudding was thoroughly mixed with 10 mL deionized water and centrifuged for 20 min at 15,000 g. A 2 mL aliquot was centrifuged at 19,000 g for 15 min and filtered through a 0.22 μm filter. A volume of 20 μL of supernatant was injected using a HPLC System Gold 508 Autosampler with a 126 Solvent Module and a 168 Detector (Beckman Coulter, California, USA). Extractions were performed in triplicate, and injections were done in duplicate. The mobile phase used ultrapure water with a flow of 0.6 mL/min. The separation was conducted at 85°C using an Aminex HPX-87P column (300 × 7.8 mm) from Bio-Rad Laboratories, California (REF: 1250098) [5]. Detection was performed by the refraction index. External calibration curves of saccharose, lactose, and glucose were prepared in water. Results were reported as g of total sugar content per 100 g of DP (g /100 g DP).
About 50 mg of the pudding was weighed in glass tubes, and then 100 μL of tridecanoic fatty acid (1.5 mg/mL), 800 μL of hexane, 2.26 mL of methanol, and 240 μL of 5.4 M sodium methoxide were added. The tubes were vortexed and brought to a thermal block at 80°C for 10 min. Once cooled, a volume of 1.25 mL of dimethylformamide and 1.25 mL of 3 M H2SO4 prepared in absolute methanol were added, and the tubes were taken again to a thermal block at 60°C for 30 min. Once cooled, about 1 mL of hexane was added and vortexed for 30 s. The upper phase containing the fatty acid methyl esters was collected into vials after centrifuging for 5 min at 1,250 g. Extractions were performed in triplicate and injections were done in duplicate. The analysis was conducted in a gas chromatograph Agilent 8860 (Agilent, USA), equipped with a flame ionization detector and a BPX70 capillary column (60 m × 0.25 mm × 0.25 μm; SGE Europe Ltd, Courtaboeuf, France). Analysis conditions were as follows: injector temperature 250°C, split 25:1, injection volume 1 μL; detector (FID) temperature 275°C; hydrogen was carrier gas at 20.5 psi; oven temperature program: started at 60°C (held 5 min), then raised at 15°C/min to 165°C (held 1 min) and finally at 2°C/min to 225°C (held 2 min). Fatty acids were identified by a comparison based on the retention times of fatty acids present in the Supelco 37 Component FAME Mix from Sigma-Aldrich (REF: CRM47885) [5]. Results were reported as g of total saturated fatty acids content per 100 g of DP (g of total saturated fatty acids /100 g DP).
About 0.5 g of pudding was weighed in pre-washed digestion bottles, and 5 mL of 65% HNO3 and 3 mL of 30% H2O2 were added. Digestion was performed using a microwave digestor Mars One from CEM (Qlabo, Portugal) according to the manufacturer’s recommended conditions. The digested material was left to cool down in ice, collected, and diluted as needed. Then, a volume of 10 μL of the digested sample was injected into an Optima 7000 DV ICP-OES equipment (PerkinElmer, USA). Digestions and injections were performed in triplicate. The sample flow was 1.30 L/min, and a mixture of nitrogen, air, and argon was used as carrier gases. An external calibration curve of sodium was prepared in 5% HNO3 using a standard mix (REF: P2-MEB687579, Inorganic Ventures, USA) [5]. The salt content was computed by multiplying the sodium content by 2.5 [25]. Results were reported as g of salt content per 100 g of DP (g/100 g DP).
The rapidly digestible, slowly digestible, total digestible, and RS fractions of the starches used as ingredients (commercial corn starch, HP starch, and PEF starch) and corresponding puddings (control pudding, HP pudding, and PEF pudding, respectively) were determined using a commercial enzymatic kit from Megazyme, Ireland (REF: K-DSTRS). Total content was defined as the sum of the total digestible and RS fractions. In case of starches, results were expressed in grams of starch per 100 g of SM on a dry basis (g/100 g SM). For puddings, results were reported as g of salt content per 100 g of DP (g/100 g DP).
The oscillatory measurements were conducted using a controlled stress rheometer model CS-50 (Bohlin Instruments, Cranbury NJ, USA) equipped with a cone and a plate geometry sensor (40 mm diameter, 4° cone angle, and 0.15 mm gap) at 5°C. Samples of pudding were loaded onto the equipment, and the mechanical spectra were obtained by frequency sweep from 0.63–62.8 rad/s at a constant strain of 0.5%. The complex modulus (G*), elastic modulus (G’), viscous modulus (G”), and complex viscosity (η*) were recorded as function frequency (ω) and fitted to the equations reported by Castro et al. [3, 4] (r2 > 0.98), where K*, K’, and K” are the complex, elastic, and viscous consistency coefficients (Pa.sn) and n*, n’, and n” are the complex, elastic, and viscous index values (dimensionless), respectively. H is the complex viscosity index value. Measurements were performed in triplicate.
A JOEL JSM-5600LV scanning electron microscope (SEM) was used to take scanning electron micrographs. Starch powders were added on top of the observation pins covered in double-sided adhesive carbon tape (NEM tape; Nisshin, Japan). Samples were then visualized after being coated with gold/palladium on a sputter coater (Polaron, Germany). Using the secondary electron detector, analyses were conducted with the apparatus running at a high vacuum and an accelerating voltage of 20 kV.
In vitro digestion was done in triplicate according to the INFOGEST protocol [26]. A mass of 5 g of the pudding was mixed with 4 mL of simulated oral fluid. Then, 25 µL of 0.3 M CaCl2(H2O)2, 750 µL of 75 U/mL salivary α-amylase, and 225 µL of deionized water were added. The mixture was incubated while mixing for 2 min at 37°C. After adjusting the pH from 7.0 to 3.0 with 400 µL of 5 M HCl, a volume of 8 mL of simulated gastric fluid, 5 µL of 0.3 M CaCl2(H2O)2, 667 µL of 2,000 U/mL pepsin, 480 µL of 2,000 U/mL gastric lipase, and 448 µL of deionized water were added. The mixture was then incubated while mixing for 2 h at 37°C. After adjusting the pH from 3.0 to 7.0 with 800 µL of 5 M NaOH, a volume of 8 mL of simulated intestinal fluid, 4 µL of 0.3 M CaCl2(H2O)2, 5 mL of 100 U/mL trypsin in pancreatin, 3 mL of 10 mM bile salts, and 3.16 mL of deionized water were added. The mixture was then incubated while mixing for 2 h at 37°C. Aliquots of 1 mL were collected at all digestion stages, and the glucose content was quantified using a commercial enzymatic kit from Megazyme, Ireland (REF: K-GLUC). Results were expressed in mg of glucose per 100 g of DP (mg G/100 g DP).
The simulated oral, gastric, and intestinal fluids were prepared by mixing 0.5 M KCl (15.1, 6.9, and 6.8 mL, respectively); 0.5 M KH2PO4 (3.7, 0.9, and 0.8 mL, respectively); 1 M NaHCO3 (6.8, 12.5, and 42.5 mL, respectively); 2 M NaCl (0, 11.8, and 9.6 mL, respectively); 0.15 M MgCl2(H2O)6 (0.5, 0.4, and 1.1 mL, respectively), 0.5 M (NH4)2CO3 (0.06, 0.5, and 0 mL, respectively); and 6 M HCl (0.09, 1.3, and 0.7 mL, respectively) solutions prepared in deionized water.
A total of 71 lactose-tolerant volunteer panelists performed a quantitative descriptive hedonic sensory analysis on the puddings regarding overall acceptability, appearance, color, aroma, flavor, sweetness, texture, and consistency using a hedonic scale, where “1” is disliked very much and “9” is liked very much [27]. Panelists’ population was 68% women and 32% male from diverse academic backgrounds (from high school to doctorate). Of the population, 79% were 35 years of age or younger. Furthermore, 52% of panelists reported consuming puddings 1–3 times per year, while 21% reported 1–3 times per month, 7% reported 1–3 times biweekly, 7% reported 1–3 times per week, and 13% reported never consuming puddings. Panelists were also asked to indicate: “Which pudding did you like best?”, “Which pudding did you like the least?”, and “What is the most similar pudding to a commercial pudding?”. The acceptability index (AI, %) was computed by dividing the average of the scores given to overall acceptability by panelists by the highest score given to the overall acceptability [28].
A one-way ANOVA was used to assess the statistical significance of all results, while the Kruskal-Wallis non-parametric test with Dunn’s post hoc was utilized to evaluate the statistical differences in scores awarded by panelists for overall acceptability, appearance, color, aroma, flavor, sweetness, texture, and consistency parameters between puddings. All significant results were only defined at P < 0.05.
On days 0, 8, 15, 21, and 28, no colonies of aerobic mesophiles, B. cereus, yeasts and molds, and Enterobacteriaceae were found in 10 g of pudding according to paragraph 2.2 of chapter 2 of Annex I of Regulation (EC) 2073/2005 [17].
On days 0 and 28, the pH, color, and texture analyses of puddings were evaluated (Table 1). Regarding pH, no statistical differences were found between puddings on day 0. However, the pH of the control, HP, and PEF puddings increased 2, 3, and 2%, respectively, from day 0 to day 28.
pH, texture profile, and color of the control, HP, and PEF puddings on days 0 and 28 (results are represented as mean ± standard deviation)
| Parameter | Day | Control pudding | HP pudding | PEF pudding |
|---|---|---|---|---|
| pH | 0 | 6.28 ± 0.02aA | 6.24 ± 0.03aA | 6.26 ± 0.03ªA |
| 28 | 6.41 ± 0.03aB | 6.40 ± 0.02aB | 6.41 ± 0.02ªB | |
| Hardness (g) | 0 | 28.5 ± 1.1bA | 26.6 ± 0.9aA | 25.7 ± 0.7aA |
| 28 | 55.6 ± 5.8bB | 31.9 ± 3.7aB | 31.7 ± 3.5aB | |
| Adhesiveness (g.s) | 0 | –24.4 ± 2.4abB | –25.0 ± 1.0aB | –21.5 ± 1.7bB |
| 28 | –54.6 ± 5.4ªA | –34.0 ± 1.9bA | –30.9 ± 3.2bA | |
| Resilience (%) | 0 | 16.9 ± 0.5bB | 15.1 ± 0.4aB | 15.9 ± 0.5aB |
| 28 | 10.8 ± 0.6bA | 9.7 ± 0.7aA | 9.4 ± 0.3aA | |
| Cohesion (unitless) | 0 | 0.5 ± 0.0aA | 0.5 ± 0.0aA | 0.5 ± 0.0aA |
| 28 | 0.5 ± 0.0aA | 0.5 ± 0.0aA | 0.5 ± 0.0aA | |
| Springiness (%) | 0 | 87.9 ± 1.3ªA | 87.8 ± 0.3aA | 89.6 ± 0.9bA |
| 28 | 88.7 ± 1.2ªA | 89.8 ± 0.6abB | 91.0 ± 1.1bA | |
| Gumminess (unitless) | 0 | 13.0 ± 0.2ªA | 12.4 ± 0.7aA | 12.6 ± 0.5aA |
| 28 | 26.3 ± 2.9bB | 15.1 ± 1.9aB | 14.9 ± 1.6aB | |
| Chewiness (unitless) | 0 | 11.8 ± 0.6ªA | 10.9 ± 0.6aA | 11.3 ± 0.5aA |
| 28 | 23.3 ± 2.7bB | 13.8 ± 1.8aB | 13.5 ± 1.4aB | |
| L* | 0 | 24.4 ± 0.6aA | 23.2 ± 1.4aA | 23.7 ± 1.5ªA |
| 28 | 25.7 ± 0.8aA | 25.8 ± 1.5aA | 26.4 ± 1.4aA | |
| a* | 0 | 5.6 ± 0.1ªA | 6.3 ± 0.3aA | 6.1 ± 0.5ªA |
| 28 | 7.1 ± 0.1aB | 6.4 ± 0.3ªA | 6.4 ± 0.6ªA | |
| b* | 0 | 3.5 ± 0.3aA | 4.8 ± 0.6bA | 5.0 ± 0.5bA |
| 28 | 5.7 ± 0.5bB | 4.6 ± 0.3aA | 4.7 ± 0.1aA |
a*: red-green component; b*: yellow-blue component; L*: lightness. HP: hydrostatic pressure; PEF: pulsed electric field. Significant differences between puddings on the same day and parameters are represented by superscript lower-case letters, and values in the same row with the same letters are not statistically significant (P > 0.05). Significant differences between pairs of days for each parameter are represented by superscript capital-case letters, and pairs of values in the same column with the same letters do not have statistical significance (P > 0.05)
Concerning texture at day 0, the control puddings had significantly higher hardness and resilience than HP or PEF puddings. The PEF puddings had significantly higher springiness than the control or HP puddings. Significant differences in adhesiveness were only discovered between HP and PEF pudding, where the HP pudding showed a higher significant absolute value of adhesiveness than the PEF pudding. No statistical differences were found in cohesion, gumminess, or chewiness between puddings.
After 28 days of storage, the control pudding showed a significant increase in hardness, gumminess, and chewiness (95, 102, and 97%, respectively) compared to the acorn puddings (20, 22, and 27% for the HP pudding and 23, 18, and 19% for the PEF pudding, respectively). Also, there was a significant increase in the absolute value of adhesiveness in the control pudding (124%) when compared to acorn puddings (36% and 44% for HP and PEF puddings, respectively). Resilience decreased significantly by 36, 36, and 41% for control, HP, and PEF puddings, respectively, but was more evident in control puddings.
Regarding color, no significant differences were found in the L* and a* components between puddings on day 0. Yet, both HP and PEF puddings had significantly higher b* components than the control, but no differences were found between the acorn puddings. No significant differences were found in the color components between days for HP and PEF puddings after 28 days of storage, but significant differences were found in the control. The L* component remained unchanged, but the a* and b* components increased significantly. Regarding the color of the starches, the commercial starch presented a significantly higher L* value than either of the acorn starches (HP or PEF) (Table 2). However, these presented significantly higher a* and b* values compared to the commercial starch. According to Figure 2, the commercial starch has a white color while acorn starches (HP or PEF) have a brown color.
Color of the commercial starch, and acorn starches extracted by HP or PEF (results are represented as mean ± standard deviation)
| Color (component) | Commercial starch | HP starch | PEF starch |
|---|---|---|---|
| L* | 66.8 ± 2.9b | 46.1 ± 3.3a | 43.8 ± 2.4a |
| a* | 2.9 ± 0.1a | 3.7 ± 0.2b | 3.5 ± 0.2b |
| b* | –1.0 ± 0.1a | 8.3 ± 0.3c | 7.7 ± 0.4b |
a*: red-green component; b*: yellow-blue component; L*: lightness. HP: hydrostatic pressure; PEF: pulsed electric field. Differences are represented by superscript lower-case letters and values in the same row with the same letters do not have statistical significance (P > 0.05)
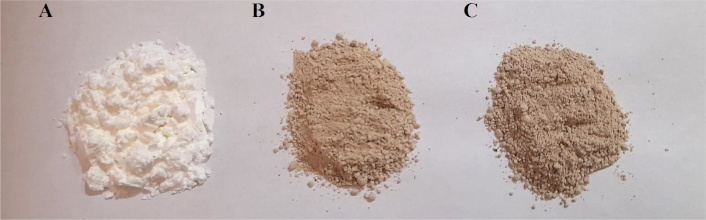
Photographic representation of the commercial starch (A), Q. robur starch extract by HP at 333 MPa for 17.4 min (B), and Q. robur starch extract by PEF using an electric field intensity of 0.1 kV/cm for 63.3 µs (C). HP: hydrostatic pressure; PEF: pulsed electric field
Several parameters were determined to assess the impact of replacing commercial corn starch with acorn starch on the nutritional composition of puddings (Table 3).
Nutritional composition of the control, HP, and PEF puddings (results are represented as mean ± standard deviation)
| Nutritional parameter | Control pudding | HP pudding | PEF pudding |
|---|---|---|---|
| Moisture (g/100 g P) | 70.6 ± 1.3ª | 69.4 ± 1.1ª | 70.5 ± 0.8ª |
| Ash (g/100 g DP) | 2.9 ± 0.1ª | 2.8 ± 0.0ª | 2.9 ± 0.0ª |
| Protein (g/100 g DP) | 8.1 ± 0.1ª | 8.3 ± 0.8ª | 8.7 ± 02ª |
| Fat (g/100 g DP) | 7.7 ± 0.2ª | 7.2 ± 0.0ª | 7.6 ± 0.4ª |
| Saturated fatty acids1 (g/100 g DP) | 4.2 ± 0.1ª | 4.2 ± 0.2ª | 4.1 ± 0.4ª |
| Carbohydrate (g/100 g DP) | 81.3 ± 0.1ª | 81.7 ± 0.8ª | 80.8 ± 0.3ª |
| Sugars2 (g/100 g DP) | 39.2 ± 1.7ª | 35.4 ± 4.0ª | 40.0 ± 2.1ª |
| Dietary fiber (g/100 g DP) | 10.8 ± 0.5ª | 10.4 ± 0.8ª | 10.8 ± 0.4ª |
| Starch (g/100 g DP) | 8.2 ± 0.4ª | 8.0 ± 0.6ª | 8.3 ± 0.3ª |
| RDS (g/100 g DP) | 7.3 ± 0.4ª | 7.5 ± 0.6ª | 7.6 ± 0.1ª |
| SDS (g/100 g DP) | n.d. | n.d. | n.d. |
| TDS (g/100 g DP) | 8.1 ± 0.4ª | 7.8 ± 0.6ª | 8.1 ± 0.3ª |
| RS (g/100 g DP) | 0.14 ± 0.01ª | 0.15 ± 0.01ª | 0.16 ± 0.01ª |
| Salt (g/100 g DP) | 0.86 ± 0.04ª | 0.81 ± 0.01ª | 0.83 ± 0.02ª |
| Energy (kJ/g DP) | 17.1 ± 0.1ª | 17.0 ± 0.1ª | 17.1 ± 0.0ª |
1 Sum of capric, lauric, myristic, pantadecylic, palmitic, margaric, stearic, and arachidic fatty acids; 2 sum of glucose, saccharose, and lactose. DP: pudding on a dry basis; HP: hydrostatic pressure; n.d.: not detected; P: pudding on an as-is basis; PEF: pulsed electric field; RDS: rapidly digestible starch; RS: resistant starch; SDS: slowly digestible starch; TDS: total digestible starch. Significant differences between puddings are represented by superscript lower-case letters and values in the same row with the same letters do not have statistical significance (P > 0.05)
No differences were seen in the parameters analyzed between puddings. Regarding the starches used, commercial starch presented significantly higher contents of rapidly digestible starch (RDS), slowly digestible starch (SDS), and total digestible starch (TDS) compared to acorn starches (HP or PEF) (Table 4). However, these presented a significantly higher content of RS compared to commercial starch. Additionally, no significant differences were observed in the total starch (TS) contents between the starches.
Characterization of the commercial starch and acorn starches extracted by HP or PEF (results are represented as mean ± standard deviation)
| Starch (g/100g SM) | Commercial starch | HP starch | PEF starch |
|---|---|---|---|
| RDS | 21.8 ± 0.1b | 12.5 ± 0.1a | 13.2 ± 0.7a |
| SDS | 37.6 ± 2.8b | 17.4 ± 0.2a | 15.4 ± 0.1a |
| TDS | 81.3 ± 6.2b | 45.0 ± 0.8a | 40.8 ± 0.8a |
| RS | 10.3 ± 0.3a | 49.7 ± 3.3b | 51.5 ± 2.1b |
| TS | 91.6 ± 5.9a | 94.7 ± 4.1a | 91.9 ± 4.0a |
HP: hydrostatic pressure; PEF: pulsed electric field; RDS: rapidly digestible starch; RS: resistant starch; SDS: slowly digestible starch; SM: starchy material; TDS: total digestible starch; TS: total starch. Differences are represented by superscript lower-case letters and values in the same row with the same letters do not have statistical significance (P > 0.05)
The complex viscosity measures the total resistance to flow with angular frequency [3, 4]. The control pudding had significantly lower G* values and significantly higher H values than the HP or PEF puddings (Table 5). However, no significant differences were found between the acorn puddings.
Dynamic oscillation characterization of the control, HP, and PEF puddings (results are represented as mean ± standard deviation)
| Measurement | Linearized parameter | Control pudding | HP pudding | PEF pudding |
|---|---|---|---|---|
| η* | H (unitless) | –0.874 ± 0.014b | –0.904 ± 0.002a | –0.904 ± 0.001a |
| G* (Pa) | 38.8 ± 3.7a | 66.4 ± 2.0b | 64.9 ± 6.2b | |
| G* | n* (unitless) | 0.101 ± 0.008b | 0.090 ± 0.002a | 0.092 ± 0.001ab |
| K* (Pa.sn) | 247.4 ± 23.0a | 433.6 ± 23.5b | 409.0 ± 3.82b | |
| G’ | n’ (unitless) | 0.100 ± 0.008a | 0.089 ± 0.001a | 0.092 ± 0.001a |
| K’ (Pa.sn) | 244.4 ± 22.8a | 429.0 ± 23.3b | 404.3 ± 37.8b | |
| G” | n” (unitless) | 0.092 ± 0.005a | 0.099 ± 0.005a | 0.093 ± 0.003a |
| K” (Pa.sn) | 42.7 ± 3.7a | 69.2 ± 4.1b | 68.7 ± 6.6b |
HP: hydrostatic pressure; PEF: pulsed electric field. G*, G’, G”, and η* are the complex modulus, elastic modulus, viscous modulus, and complex viscosity, respectively; H is the complex viscosity index value; n*, n’, and n” are the complex, elastic, and viscous index values, respectively; K*, K’, and K” are the complex, elastic, and viscous consistency coefficients, respectively. Significant differences between puddings for each linearized parameter are represented by superscript lower-case letters, and values in the same row with the same letters do not have statistical significance (P > 0.05)
The overall material’s resistance to deformation can be measured by the complex modulus [3, 4]. The control pudding had significantly lower complex consistency coefficients than the HP or PEF puddings, but no significant differences were found between the acorn puddings. Additionally, the control pudding had a significantly higher complex index value than the HP but was statistically similar when compared to PEF puddings (Table 5).
The control pudding had significantly lower elastic and viscous consistency coefficients values when compared to HP or PEF puddings, but no significant differences were found between the acorn puddings. Moreover, no significant differences were found in the elastic and viscous index values between puddings.
Puddings had a similar amount of glucose. A significant increase in glucose was observed after the oral phase for the control, HP, and PEF puddings, respectively, at 447, 519, and 522% (Table 6).
Glucose concentration (mg/100g DP) present at the end of the oral, gastric, and intestinal phases resulting from the in vitro digestion of control, HP, and PEF puddings (results are represented as mean ± standard deviation)
| Digestion phase | Control pudding | HP pudding | PEF pudding |
|---|---|---|---|
| Undigested | 0.32 ± 0.01aA | 0.32 ± 0.01aA | 0.32 ± 0.02aA |
| Oral | 1.75 ± 0.11aB | 1.98 ± 0.16aB | 1.99 ± 0.15aB |
| Gastric | 1.81 ± 0.14aB | 1.95 ± 0.21aB | 1.90 ± 0.12aAB |
| Intestinal | 2.15 ± 0.14aC | 2.18 ± 0.23aB | 2.29 ± 0.16aC |
HP: hydrostatic pressure; PEF: pulsed electric field. Significant differences between puddings are represented by superscript lower-case letters and values in the same row with the same letters do not have statistical significance (P > 0.05). Significant differences between digestion phases are represented by superscript capital-case letters and values in the same column with the same letters do not have statistical significance (P > 0.05)
From the oral phase to the end of the gastric phase, no significant changes in the amount of glucose. Lastly, a statistically significant increase of 19 and 21% was observed for the control and PEF puddings, respectively, from the gastric to the intestinal phase, which was not observed for the HP pudding. No significant differences were found between the puddings at end of the oral, gastric, and intestinal phases.
Figure 3 shows the radar chart of the sensorial attributes of puddings. Although no statistical differences were observed between the puddings concerning the sensory attributes, the radar analysis allowed them to infer that the PEF and control puddings were better rated in all parameters concerning HP. Furthermore, the PEF pudding showed a higher score in terms of color, appearance, and texture, while the control scored better in terms of aroma and flavor (P > 0.05). Regarding sweetness, the three puddings had similar scores, but this was slightly higher for HP and PEF puddings compared to the control pudding (P > 0.05).
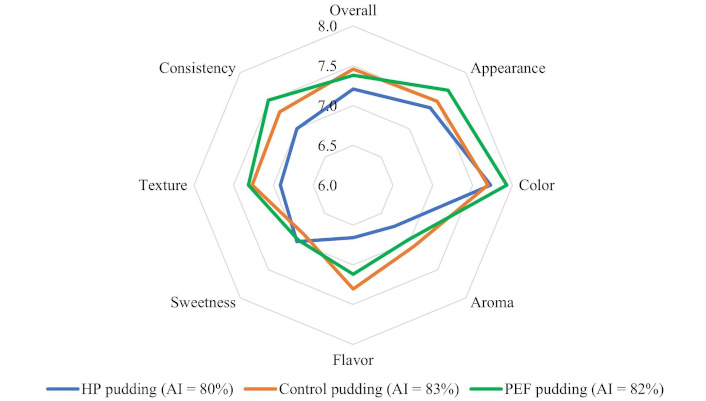
Radar chart of the sensorial attributes (overall acceptability, appearance, color, aroma, flavor, sweetness, texture, and consistency) of the control (orange line), HP (blue line), and PEF (green line) chocolate puddings. AI: acceptability index; HP: hydrostatic pressure; PEF: pulsed electric field
Figure 4 shows the SEM images of the internal structure of puddings. It can be observed that the surface of the internal structure of the PEF pudding appears to be more similar to that of the control pudding than to that of the HP pudding.
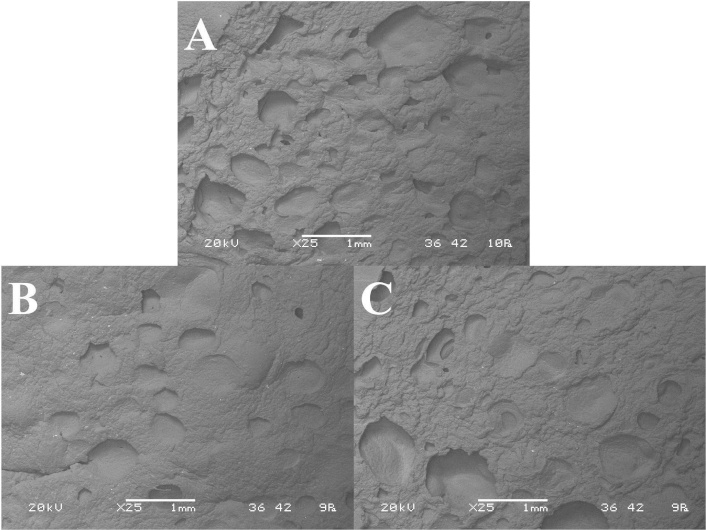
SEM images of the internal structure of the control (A), HP (B), and PEF (C) chocolate puddings at a 25× magnification. HP: hydrostatic pressure; PEF: pulsed electric field; SEM: scanning electron microscope
The absence of colonies of aerobic mesophiles, B. cereus, yeasts and molds, and Enterobacteriaceae shows that the replacement of commercial starch with acorn starch does not compromise the microbiological safety of puddings after 28 days of storage at 4°C.
Regarding pH, the significant but small increase observed between days 0 and 28 may have been due to the dissociation of casein micelles and the consequent release of phosphate ions [29] (Table 1).
Concerning texture at day 0, the significantly higher hardness and resilience of the control puddings over the HP or PEF puddings indicate that a greater force is required to compress the control pudding between the tongue and palate, but also a faster recovery after compression (Table 1). Additionally, the significantly higher springiness of PEF pudding shows that it has a greater degree of return to the original shape after compression over the HP or control puddings. Furthermore, the significantly higher absolute value of adhesiveness of the HP pudding over the PEF pudding indicates that after compression between the tongue and the palate, a greater force would be required to remove the HP pudding than the PEF pudding. These changes are thought to be due to the different amylose and amylopectin contents of the different starches used, as well as how entangled the amylose may be between the amylopectin chains and/or other constituents of the pudding matrix, such as pectin used [3, 4]. No statistical differences were found in cohesion, gumminess, or chewiness between puddings.
After 28 days of storage, the control pudding showed a significant increase in hardness, gumminess, and chewiness compared to the acorn puddings shows that the control pudding would require a greater compression force against the tongue and palate than HP or PEF puddings, as well as greater energy and time to disintegrate the pudding until it is ready to swallow (Table 1). Also, the most pronounced increase in the absolute value of adhesiveness of the control pudding when compared to acorn puddings indicates that, after compression between the tongue and the palate, a greater force would be required to remove the control pudding than either acorn puddings. The significant decrease in resilience shows that puddings don’t recover well after compression and may stay deformed (more plastic or viscous behavior).
Regarding color, the significant changes found on the b* components between HP and PEF puddings and the control were due to color differences between starches (Table 2, Figure 2).
Since differences were seen in the parameters analyzed between puddings, this shows that the replacement of commercial starch with acorn starch does not compromise the nutritional of puddings (Table 3). The majority of starch present in the puddings was RDS, with RS comprising only a minor fraction (> 0.2%). However, Table 4 shows that HP and PEF acorn starches had significantly lower RDS, SDS, and TDS and higher RS contents when compared to the commercial starch. Nevertheless, it is important to consider that the starches incorporated into the puddings underwent gelatinization during cooking at 97 °C. This process disrupted the granular structure of the starch, leading to a reduction in RS.
Regarding complex viscosity, the control pudding had significantly higher H values than acorn puddings. The H values indicate how the complex viscosity changes with the angular frequency. Since these decrease with the angular frequency, this denotes a transition from a viscoelastic solid to a viscoelastic fluid (Table 5). Hence, the HP and PEF puddings had significantly lower transition from a viscoelastic solid to a viscoelastic fluid when compared to the control.
The overall material’s resistance to deformation can be measured by the complex modulus [3, 4]. Complex modulus increased with the frequency, but differences were found between puddings. The complex consistency coefficient of the control was significantly lower than acorn puddings, but no significant differences were found between acorn puddings. Moreover, the complex index value of the HP pudding was significantly lower than the control, indicating a lower dependence of the complex modulus on the frequency. Hence, HP acorn pudding had a higher resistance towards deformation than the commercial pudding.
The complex modulus is the sum of the contributions of elastic (G’) and viscous (G”) moduli. The former refers to the ability to store energy, while the latter refers to the ability to dissipate energy [3, 4]. Since G’ > G” with no crossover, puddings exhibit a solid-like behavior. Both moduli increased with frequency (as indicated by the positive index values), but G” values were greater than G’ values. This shows that the mechanical rigidity of gels develops slowly. Concerning the elastic and viscous moduli, the control had lower consistency indexes than the acorn puddings, but no differences were found between the HP and PEF puddings. No differences were found in the elastic and viscous indices between puddings.
The significant increase in glucose was observed after the oral phase for the control, HP, and PEF puddings, respectively, in relation to the undigested puddings is due to the enzymatic action of salivary α-amylase (Table 6). This enzyme is responsible for the hydrolysis of starch chains into dextrin, maltose, and free glucose through random cleavage of α-(1,4) bonds. Due to the inactivation of α-amylase caused by the decrease in pH from 7.0 to 3.0, the contents of the puddings remained similar from the end of the oral to the end of the gastric phase. When the pH was raised from 3.0 to 7.0, the enzymatic action of α-amylase may have been reactivated, increasing the free glucose concentration from the gastric to the intestinal phase. Thus, we can infer that the replacement of commercial starch with acorn starch does not affect the in vitro digestibility of puddings.
From the questionnaires, 54% of the panelists indicated that puddings made with acorn starches were more similar to a regular commercial pudding. Of these, 53% stated the HP pudding as being the most like a commercial pudding, in contrast to the 47% who stated the PEF pudding. Additionally, 61% of the panelists liked the acorn puddings more, while 39% of the panelists liked the control puddings. Of the 61%, about 58% indicated that they liked PEF pudding more, while 42% liked the HP pudding more. These results agree with the calculated acceptability indices since the PEF pudding had a higher AI than the HP pudding and was similar to the control pudding (Figure 3). Additionally, the scores given to the texture parameter of the different puddings agree with the SEM images of the internal structure of the puddings (Figure 4). It can be observed that the surface of the internal structure of the PEF pudding appears to be more similar to that of the control pudding than to that of the HP pudding.
The replacement of commercial corn starch with Q. robur acorn starch extracted by HP at 333 MPa for 17.4 min or extracted by PEF using an electric field intensity of 0.1 kV/cm for 63.3 µs did not change the nutritional composition or internal structure of the chocolate puddings, but there was an improvement in the rheological properties. Furthermore, tasters had a positive preference towards the acorn-starch-based puddings, especially the PEF pudding (higher AI), compared to the commercial corn-starch-based pudding, without negatively affecting the in vitro digestibility between puddings. Moreover, it did not have any microbiological implications on the chocolate puddings during storage, but there was color stabilization and improved texture when compared to the control puddings. Hence, the usage of Q. robur acorn starch can positively impact the physicochemical characteristics of chocolate puddings without conditioning their shelf-life after 28 days of storage at 4°C. These results show the potential of acorn starch in food matrices, but future studies will be necessary to transport these products to the market, thus contributing to the valorization of this undervalued fruit. This study opens the door to the use of starches in various food categories such as sauces, soups, meat and fish items, food creams, and ice cream.
AI: acceptability index
DP: pudding on a dry basis
HP: hydrostatic pressure
PEF: pulsed electric field
RDS: rapidly digestible starch
RS: resistant starch
SDS: slowly digestible starch
SEM: scanning electron microscope
SM: starchy material
TDS: total digestible starch
Acknowledgements are given to the Universidade Católica Portuguesa by providing financial support to CBQF Associate Laboratory under the UID/Multi/50016/2021 FCT (Fundação para a Ciência e a Tecnologia) project and to Aveiro University and Laboratório Associado LAQV-REQUIMTE (UIDB/50006/2020) through national funds and, where applicable, co-financed by the FEDER, within the PT2020 Partnership Agreement.
LMGC: Conceptualization, Data curation, Formal analysis, Funding acquisition, Investigation, Methodology, Software, Validation, Visualization, Writing—original draft, Writing—review & editing. SCS: Data curation, Formal analysis, Methodology, Validation, Writing—review & editing. MM: Data curation, Formal analysis, Methodology, Validation, Writing—review & editing, Funding acquisition. EMCA: Conceptualization, Supervision, Funding acquisition, Validation, Investigation, Writing—review & editing, Resources. JAS and MP: Conceptualization, Supervision, Validation, Investigation, Writing—review & editing, Resources. All authors read and approved the submitted version.
The authors declare that they have no conflicts of interest.
Not applicable.
Informed consent to participate in the study was obtained from all participants. Participants gave written informed consent via the statements “Do you consent to participate voluntarily and anonymously?” and “Are you lactose-intolerant and/or allergic to dairy products?”. Only those who answered “yes” to the first question, and “no” to the second question were admitted to participate. The study was explained to participants in the questionnaire, and they were able to withdraw from the survey at any time without giving a reason. All participants acknowledged an informed consent statement to participate in the study.
Not applicable.
Data can be provided to any qualified researchers on reasonable request.
Authors Luís M.G. Castro [SFRH/BD/136882/2018, COVID/BD/152756/2022] and Manuela Machado [SFRH/BD/136701/2018] are grateful for the financial support provided by FCT (Fundação para a Ciência e a Tecnologia) through the Doctoral Grants. Author Elisabete M.C. Alexandre is also grateful for the financial support of this work funded by national funds (OE), through FCT, I.P., in the scope of the framework contract foreseen in the numbers 4, 5 and 6 of the article 23, of the Decree-Law 57/2016, of August 29, changed by Law 57/2017, of July 19. The funders had no role in study design, data collection and analysis, decision to publish, or preparation of the manuscript.
© The Author(s) 2025.
Open Exploration maintains a neutral stance on jurisdictional claims in published institutional affiliations and maps. All opinions expressed in this article are the personal views of the author(s) and do not represent the stance of the editorial team or the publisher.
Copyright: © The Author(s) 2025. This is an Open Access article licensed under a Creative Commons Attribution 4.0 International License (https://creativecommons.org/licenses/by/4.0/), which permits unrestricted use, sharing, adaptation, distribution and reproduction in any medium or format, for any purpose, even commercially, as long as you give appropriate credit to the original author(s) and the source, provide a link to the Creative Commons license, and indicate if changes were made.

Leonel Pereira
Micaela Antón ... Rafael Borneo
Rut Domínguez ... Manuel Domínguez
Eliseo Sánchez-Loredo ... Juan A. Ascacio-Valdés
Ayla Elmi Kashtiban ... Sayna Zahedinia
Shafa’atu Giwa Ibrahim, Roselina Karim
Brice Ulrich Foudjo Saha ... Lifoter Kenneth Navti
Olamide Akande ... Daniel Ajewole
Evans Ntim Amedor ... James Owusu-Kwarteng
José Pinela, José Ignacio Alonso-Esteban
