Original Article

Affiliation:
1Instituto de Ciencia y Tecnología de los Alimentos-Córdoba (ICYTAC-CONICET-UNC), Av. J. Filloy S/N, Córdoba X5000, Argentina
†
Affiliation:
1Instituto de Ciencia y Tecnología de los Alimentos-Córdoba (ICYTAC-CONICET-UNC), Av. J. Filloy S/N, Córdoba X5000, Argentina
†
Affiliation:
2Instituto de Investigaciones en Físico-Química de Córdoba (INFIQC). Universidad Nacional de Córdoba, Córdoba X5000, Argentina
3Facultad de Ciencias Exactas, Físicas y Naturales, Universidad Nacional de Río Cuarto, Córdoba X5000, Argentina
Affiliation:
3Facultad de Ciencias Exactas, Físicas y Naturales, Universidad Nacional de Río Cuarto, Córdoba X5000, Argentina
Affiliation:
1Instituto de Ciencia y Tecnología de los Alimentos-Córdoba (ICYTAC-CONICET-UNC), Av. J. Filloy S/N, Córdoba X5000, Argentina
4Facultad de Ciencias Exactas, Físicas y Naturales, Universidad Nacional de Córdoba, Av. Vélez Sarsfield 1600, Córdoba X5000, Argentina
5Instituto Superior de Desarrollo, Investigación y Servicios en Alimentos (ISIDSA), Secretaría Ciencia y Tecnología (SECYT), Universidad Nacional de Córdoba, Córdoba X5000, Argentina
ORCID: https://orcid.org/0000-0002-7828-319X
Explor Foods Foodomics. 2023;1:221–234 DOI: https://doi.org/10.37349/eff.2023.00017
Received: June 20, 2023 Accepted: October 12, 2023 Published: October 31, 2023
Academic Editor: José Pinela, Polytechnic Institute of Bragança, Portugal
The article belongs to the special issue The food (r)evolution towards food quality/security and human nutrition
Aim: The extraction of polyphenols is commonly accomplished using conventional techniques such as solid-liquid and liquid-liquid extraction, which are associated with the use of high quantities of organic solvents, long extraction times, and low selectivity and reproducibility. These limitations have led to the development of innovative extraction technologies. The purpose of this study was to investigate the ultrasound-assisted extraction (UAE) and microwave-assisted extraction (MAE) of polyphenols from partially defatted chia flour (PDCF).
Methods: The effect of four factors on the extraction of polyphenols (percentage in relation to the initial weight of PDCF) and on the antioxidant activity [quantified by 2,2’-azino-bis-3-ethylbenzthiazoline-6-sulphonic acid (ABTS) and ferric reducing antioxidant power (FRAP) methods] was investigated and the UAE and MAE processes were optimized using the response surface methodology (RSM).
Results: It was found that MAE improved the extraction yield (polyphenol content and antioxidant activity) in shorter extraction times when compared to UAE.
Conclusions: The application of these alternative green technologies improved the performance of the polyphenol extraction process from PDCF. Overall, both techniques could be used as efficient green alternatives.
Chia (Salvia hispanica L.), belonging to the Lamiaceae plant family, was a very important food for Mesoamericans in pre-Columbian times and it has been cultivated in Central America since those times [1]. This crop has been successfully introduced and developed in Argentina, mostly in the northern part of the country, where it has been turned into a very important economic activity [2]. Chia seeds are one of the best natural sources of polyunsaturated fatty acid (PUFA) α-linolenic acid [ALA; 18:3(n-3)], showing a highly beneficial proportion of ω-3/ω-6. The oil content of these seeds is around 30% and the protein content is between 19% and 27% [3] with a very good balance of essential amino acids, especially methionine and cysteine. Additionally, the dietary fiber content is significant, ranging from 34–50% [1].
Chia seeds are rich in phenolic compounds [3] and have a high antioxidant capacity [3, 4]. The polyphenols responsible for the antioxidant activity are mainly flavonoids and cinnamic acid derivatives. The amount of phenolic compounds in chia is about 0.88–1.6 mg gallic acid equivalents (GAE)/g. They contain significant concentrations of gallic, caffeic, chlorogenic, ferulic, and rosmarinic acids. In addition, they also contain myricetin, quercetin, and kaempferol [4, 5].
After the oil is extracted from chia seeds, a fiber-rich, protein-rich, and polyphenol-rich fraction remains as a by-product. This fraction, the partially defatted chia flour (PDCF) could be used to naturally improve the nutritional profile and the antioxidant capacity of food formulations [6].
Polyphenols have shown positive effects on human health attributed mainly to their antioxidant activities [7]. The benefits of polyphenols may come from the positive effect on reducing oxidative stress, which arises from an excess of active forms of oxygen. Oxidative stress is related to aging, cardiovascular and nervous system diseases, among others. The extraction of phenolic compounds from different matrices (fruit, vegetables, agricultural by-products) is becoming important for the manufacture of functional foods and food ingredients [8]. The extraction process is important in the isolation of polyphenols. The extraction capacity depends on the solvent characteristics, the nature and preparation of the material to be extracted, the chemical structure of the polyphenols, the processing temperature, the extraction time, the solid-liquid ratio, the extraction method used, and the presence of interference substances [9, 10]. Classic techniques are commonly based on the use of different solvents and heat-intensified methods. These traditional methods have limitations in terms of processing time, cost, and quantity of solvent used. There is also the problem of the effect of temperature on thermolabile compounds [9]. Additionally, the use of dangerous organic solvents, such as acetone and chloroform, has raised red flags from an environmental point of view [10, 11]. These limitations have led to the exploration and development of innovative extraction technologies such as microwave-assisted extraction (MAE) and ultrasound-assisted extraction (UAE) that could be used to extract the polyphenols contained in plant matrices such as chia seeds [12].
UAE is faster than traditional methods due to the high contact surface between the solid and liquid phase, and the reduction in particle size [11, 12]. Additionally, acoustic cavitation causes the breakdown of plant cell walls, intensifying mass transfer and improving the effect of solvent penetration in the plant and capillary tissue [13]. This technology provides high reproducibility in short times, is simple handling, and allows reduced energy consumption by decreasing the extraction time and temperature [14].
MAE has been used for a wide variety of plant products. It offers a rapid delivery of energy to the solid-liquid mixture with subsequent efficient and homogeneous heating. Since the water inside the plant matrix absorbs microwave energy, cell rupture is caused by internal overheating, which facilitates the absorption of the matrix chemicals [15]. The main advantages of using MAE include shorter extraction times and lower solvent volumes than conventional extraction techniques [15, 16].
The aim of this investigation was to study the alternative UAE and MAE methods on the total phenolic content (TPC) and antioxidant capacity of extracts from PDCF.
Chia seeds cultivated in Argentina (Salvia hispanica L.) were acquired from local markets. All chemicals were purchased from Sigma-Aldrich (Merck KGaA, Darmstadt, Germany).
The PDCF was obtained by cold-pressing chia seeds [17]. Chia seeds were placed into air-tight bags, hydrated to a moisture content of 9.5% with distilled water, and homogenized by shaking them every 20 min during 48 h. Hydrated chia seeds were warmed at 60°C for 20 min and screw pressed in a Komet (Model CA 59 G, IBG Monforts, Mönchengladbach, Germany). The acquired product outcome was called PDCF, and it was reduced in particle size using a knife grinder and sieved (0.25 mm). PDCF had the following physicochemical characteristics: 11.80% ± 0.08% moisture, 30.55% ± 0.28% protein, 50.73% ± 1.75% total dietary fiber, and 5.62% ± 0.15% ashes.
In order to identify the best combination of factors (or independent variables) for a high-yield polyphenol extraction process, a reduced experimental composite design of Draper-Lin [18] with 18 runs was proposed using the Statgraphics Centurion statistical software (Statgraphics Technologies, Inc. The Plains, Virginia, USA) [19] for process optimization. The effects of the factors X1 [ethanol concentration, v/v (%)], X2 [emulsifier, sodium stearoyl lactylate (%)], X3 [time, (min)], and X4 [PDCF:solvent (g/mL)] were investigated on the response (or dependent) variables TPC (Y1) and antioxidant activity measured by ferric reducing antioxidant power (FRAP; Y2) and 2,2’-azino-bis-3-ethylbenzthiazoline-6-sulphonic acid (ABTS; Y3) methods. The fitting of the experimental data was performed using the following second-order polynomial equation:
Where Y is the dependent variable to be modeled, Xi and Xj represent the factors or independent variables, β0 represents the constant term, βi represents the coefficient of the linear term, and βii and βij represent the coefficients of the quadratic and interaction terms, respectively.
Draper-Lin design is a subset of response surface methodology (RSM) used for efficiently exploring and modeling the relationships between input variables (factors) and a response variable in a systematic way. Draper-Lin small composite designs are particularly valuable in situations where experimentation can be costly or time-consuming, as they provide a systematic and efficient way to gather information about the relationships between factors and responses, reducing the number of experimental runs necessary to obtain meaningful results [19]. For example, a full factorial experiment with 4 factors and three levels requires 81 runs, while a Draper-Lin small composite design requires only 18 runs.
The UAE process was carried out in an ultrasound bath (Cleanson, Buenos Aires, Argentina). Minimum and maximum values for each factor were established by preliminary experiments. Table S1 and Table S2 indicate the minimum and maximum for each factor.
Samples were extracted evaluating four factors, namely: proportion of PDCF:solvent (5/100 g/mL to 10/100 g/mL), ethanol concentration (60% to 80%, v/v), time (10 min to 30 min), and percentage of emulsifier (0.4% to 1.5%). After that, the extracts were centrifuged (5,000 g; 15°C) for 30 min. All supernatants were fractionated and stored at –20°C until analysis.
The MAE process was accomplished on a microwave Anton Paar (900 W, 2,450 MHz, Graz, Austria). Minimum and maximum values for each factor are indicated in Table S1 and Table S2. During extraction, four factors were evaluated, namely: proportion of PDCF:solvent (3/100 to 5/100), ethanol concentration (50% to 70%, v/v), temperature (40°C to 80°C), and time (2 min to 5 min). The extracts were centrifuged, fractionated, and stored as described above for UAE.
After the extraction processes, the crude extracts were tested for TPC by the Folin-Ciocalteu method [20]. Thirty μL of each extract were diluted with 80 μL of ultrapure water and mixed with 300 μL of aqueous sodium carbonate (20%) and 1,680 μL of ultrapure water. Then, 100 μL of Folin-Ciocalteu reagent was incorporated, stirred in a vortex for 30 s, and left to rest for 120 min in darkness at room temperature. The absorbance was read at 750 nm (Mettler-Toledo Spectrophotometer UV Vis) against a blank without sample. The TPC was calculated using gallic acid as the standard by linear regression (Figure 1). The TPC was expressed as mg GAE in relation to the weight of the initial PDCF material (100 g PDCF). All samples were analyzed in triplicate.
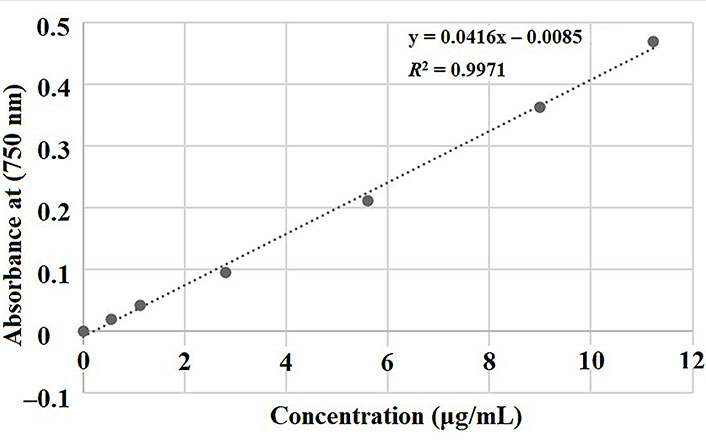
Calibration curve for total polythenols content (x = gallic acid concentration, y = absorbance)
Antioxidant activity was quantified by two chemical methods. The ABTS+ radical cation [2,2’-azino-bis-(3-ethylbenzothiazoline-6-sulphonic acid)] decolorization assay as used to measure the radical scavenging activity [21]. ABTS+ radical cation solution was prepared by reacting 2.45 mmol/L potassium persulfate and 7 mmol/L ABTS in 10 mL of ultrapure water and stored in the dark for 12–16 h at room temperature before use. The resulting solution was diluted with ultra-pure water to get an absorbance of 0.70 ± 0.02 at 734 nm. Forty-five μL of each sample was diluted with 55 μL of ultrapure water and was added to 3 mL of working solution. The mixtures were incubated in darkness for 30 min and absorbance was measured at 734 nm against a reagent blank. The FRAP assay [22] was utilized to measure the reducing power and it was accomplished by mixing 15 μL of sample, 5 μL of ethanol and 3 mL of FRAP solution [10 mmol/L 2,4,6-tris-(2-pyridyl)-S-triazine (TPTZ; Fluka™) + 20 mmol/L FeCl3.6H2O + buffer acetate]. This mixture was allowed to stand in the dark for 30 min and the absorbance was measured at 593 nm. Trolox 1 mmol/L (6-hydroxy-2,5,7,8-tetramethyl-94 chroman-2- carboxylic acid) was acquired from Sigma Aldrich® (Switzerland), was used as standard for FRAP and ABTS methods and the results were expressed as mg of Trolox equivalents (TE)/100 g PDCF.
To describe the behavior of the data set and for the purpose of making statistical predictions, the polynomial model equation presented above was used to construct predictive model equations using the Statgraphics Centurion statistical software (Statgraphics Technologies, Inc. The Plains, Virginia, USA) [19]. Statistically significant differences between samples were assessed with ANOVA (P < 0.05), and a posteriori test [Fisher’s least significant difference (LSD)] was performed to reveal paired differences among means. The statistical analysis of data was carried out using the R statistical software (R Foundation for Statistical Computing, Vienna, Austria) [23].
The extraction method of bioactive compounds from plant materials, as well as the type and concentration of solvent, the solvent/sample ratio, time, and temperature selected are crucial factors that can affect the efficiency of the phenolic compound recovery process [24]. Methanol and acetone are organic solvents widely used for the extraction of bioactive compounds from botanical materials. However, the use of non-toxic food grade solvents called “generally recognized as safe” (GRAS) by the US Food and Drug Administration such as ethanol, n-butanol, and isopropanol are suggested to produce quality food extracts [25]. Based on this, we decided to use different mixtures of ethanol and water as extraction solvents. According to preliminary experimental tests and previous results that different authors reported for the extraction of polyphenols from botanical materials through different techniques [26–30], maximum and minimum levels were identified for the independent variables used in the RSM design. Maximums and minimums for each factor were selected because, below the minimum or above the maximum, no significant differences were observed regarding the TPC. As an example, we selected the minimum and maximum for the percentage of ethanol as 60% and 80%, respectively (Table S1). We found that above 80% ethanol no increase in extraction was obtained. Below 60% (the minimum selected) extraction yield diminished very steeply.
The results obtained in the experimental design (UAE, Table 1) showed significant variations (P < 0.05) in the polyphenol extractions with a minimum value of 408.0 mg GAE/100 g PDCF (run 7 didn’t show statistical differences with run 1) to a maximum of 871.2 mg GAE/100 g PDCF (run 9 showing statistical difference compared to the rest of the runs). The data reported here appear to support that the extracts with the lowest yield of polyphenols content (runs 1 and 7) had in common the use of high concentrations of ethanol (80% to 87%) and medium to high proportions of sample:solvent (0.075 g PDCF/mL to 0.1 g PDCF/mL). In general terms, this means that there is a strong possibility that the polyphenol extraction will achieve maximum yield at a sonication time close to 20 min, a low solvent sample ratio equal to 0.030 g PDCF/mL, a medium ethanol:water concentration of 70:30 and an emulsifier content of 0.10%, which corresponds to the run 9. These extraction yields are higher than those found by Corona-Jimenez et al. [31], who evaluated the polyphenolic content of UAE-obtained whole chia seed methanolic extracts for 15 min (194.06 mg of GAE/100 g of chia). On the other hand, our UAE results are also much higher than those reported by Reyes-Caudillo et al. [32] (92.1 mg and 88.0 mg of GAE/100 g). This improvement in the UAE yield is due to the collapse of the cavitation bubbles that form near the cell walls [33]. The ultrasound waves break them contributing to the mass transfer and improving the contact between the matrix and the solvent. That is why the UAE yields were better compared to those found by these authors who carried out extraction in a conventional way.
Experimental design for UAE and results obtained for TPC and antioxidant activity
| Runs* | Factors | Responses | |||||
|---|---|---|---|---|---|---|---|
| X1 | X2 | X3 | X4 | Y1: TPC (mg GAE/100 g PDCF) | Y2: FRAP (mg TE/100 g PDCF) | Y3: ABTS (mg TE/100 g PDCF) | |
| 1 | 87 | 0.10 | 20 | 0.075 | 458.9 ± 7.6 a | 770.1 ± 44.3 b | 10405.3 ± 666.3 c |
| 2 | 80 | 0.04 | 30 | 0.100 | 518.1 ± 11.6 b | 652.9 ± 5.2 a | 4675.8 ± 76.3 b |
| 3 | 70 | 0.00 | 20 | 0.075 | 612.5 ± 8.7 b | 909.9 ± 41.2 c | 5613.0 ± 44.4 b |
| 4 | 70 | 0.10 | 3 | 0.075 | 672.5 ± 35.6 b | 962.5 ± 41.1 c | 4731.2 ± 666.9 b |
| 5 | 70 | 0.19 | 20 | 0.075 | 748.5 ± 4.7 c | 1219.3 ± 55.9 e | 14258.3 ± 74.3 e |
| 6 | 70 | 0.10 | 37 | 0.075 | 622.9 ± 9.2 b | 1008.5± 17.4 d | 5672.2 ± 400.0 b |
| 7 | 80 | 0.04 | 10 | 0.100 | 408.0 ± 25.0 a | 723.7 ± 40.8 b | 4362.5 ± 195.5 b |
| 8** | 70 | 0.10 | 20 | 0.075 | 564.8 ± 55.3 b | 1090.5 ± 29.0 d | 5463.1 ± 190.8 b |
| 9 | 70 | 0.10 | 20 | 0.030 | 871.2 ± 1.2 d | 1433.9 ± 1.1 g | 5020.3 ± 445.3 b |
| 10 | 80 | 0.15 | 10 | 0.050 | 554.4 ± 86.8 b | 916.4 ± 7.7 c | 3637.9 ± 394.0 a |
| 11 | 60 | 0.04 | 30 | 0.051 | 631.6 ± 79.4 b | 1163.6 ± 63.2 e | 12750.4 ± 449.8 d |
| 12 | 53 | 0.10 | 20 | 0.075 | 600.5 ± 65.4 b | 1311.9 ± 48.1 f | 13251.7 ± 665.0 d |
| 13** | 70 | 0.10 | 20 | 0.075 | 639.7 ± 10.9 b | 1167.5 ± 40.9 e | 11058.5 ± 735.2 c |
| 14 | 60 | 0.15 | 10 | 0.102 | 570.8 ± 7.0 b | 1076.5 ± 47.8 e | 11519.1 ± 266.0 c |
| 15 | 60 | 0.15 | 30 | 0.100 | 591.1 ± 59.6 b | 1096.4 ± 9.94 e | 12632.8 ± 515.7 d |
| 16 | 60 | 0.04 | 10 | 0.050 | 717.2 ± 31.3 c | 1177.4 ± 33.3 g | 13306.3 ± 46.4 d |
| 17 | 80 | 0.15 | 30 | 0.050 | 654.5 ± 70.2 b | 1052.8 ± 37.8 d | 9489.5 ± 62.2 b |
| 18 | 70 | 0.10 | 20 | 0.120 | 543.1 ± 16.6 b | 1037.6 ± 25.1 d | 12572.4 ± 220.4 d |
Y1 (TPC-UAE) = –76.3287 – 17,494.9 × X4 + 48.5288 × X1 – 27.8374 × X3 + 3,660.92 × X2 + 25,101.3 × X42 + 119.06 × X4 × X1 + 52.4201 × X4 × X3 + 6,838.17 × X4 × X2 – 0.445927 × X12 + 0.346365 × X1 × X3 – 61.5881 × X1 × X2 – 0.037622 × X32 + 16.4098 × X3 × X2 + 2,971.08 × X22 Y2 (FRAP-UAE) = 26.6855 – 16,261.8 × X4 + 51.076 × X1 + 26.8571 × X3 + 719.841 × X2 + 22,844.6 × X42 + 155.681 × X4 × X1 – 86.7275 × X4 × X3 – 1,096.76 × X4 × X2 – 0.545876 × X12 + 0.0745313 × X1 × X3 – 4.13553 × X1 × X2 – 0.742027 × X32 + 5.47602 × X3 × X2 – 152.824 × X22 Y3 (ABTS-UAE) = 169,760 – 218,631 × X4 – 3,619.56 × X1 – 352.56 × X3 – 55,341.6 × X2+ 1.68226E6 × X4 2 – 1,270.48 × X4 × X1 – 1,934.39 × X4 × X3 + 193,392 × X4 × X2 + 21.2344 × X12 + 7.00881 × X1 × X3 + 544.449 × X1 × X2 – 2.1948 × X32 + 163.818 × X3 × X2 – 332.42 × X22 | |||||||
* Derived from a Draper-Lin reduced composite design (16 random orthogonal runs and ** 2 center points). X1: ethanol concentration (%); X2: emulsifier (%); X3: extraction time (min); X4: g PDCF/mL solvent; ABTS: radical scavenging activity. In each column samples with different letters are statistically different at the level of alpha = 0.05. Equations at the bottom of the table are those of the fitted model based on the regression coefficients for the different responses
The surface response plot (Figure 2A) presents the TPC at different concentrations of ethanol and different proportions of PDCF:solvent, keeping the time and percentage of the emulsifier constant at 20.0 min and 0.095%, respectively. Whereas none of the factors was statistically significant in the exploratory test, this plot revealed a higher TPC when the PDCF:solvent ratio was close to the minimum (0.03 g/mL) and the ethanol percentage was near 70%. Figure 2B shows that each factor presents a trend and behavior that could potentially be significant in the extraction process if the ranges of the experimental factors were modified. The main effects presented in this figure allow us to evaluate that the phenolic concentrations in the extracts tend to be higher when it works with a low amount of sample, medium ranges of ethanol concentrations and times, and amounts of emulsifier close to the maximum range.
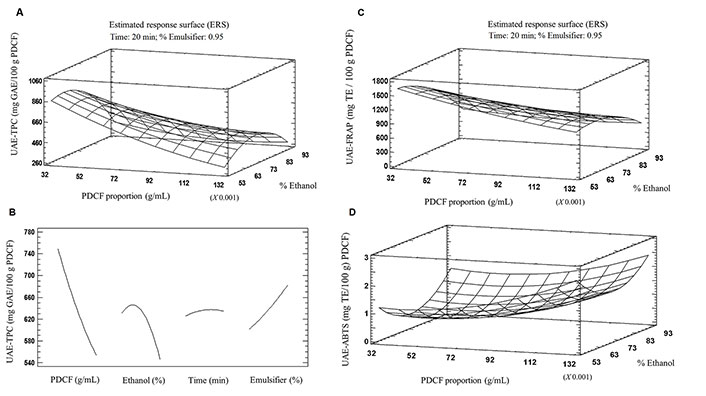
Response surface plots illustrating the effects of UAE on A: TPC and B: respective projections of the main effects of each factor, and effects on the C: FRAP and D: ABTS activities of the extracts
Since we corroborate that the PDCF has a high TPC that can contribute to consumer health due to its antioxidant capacity [17], one of the purposes of studying the residual from the chia oil extraction process is to be able to revalue it taking advantage of its antioxidant properties and to evaluate in this sense the methodology with the greatest potential for the extraction of these compounds. The different methodologies for measuring antioxidant activity in foods exert their action by generating different radicals and various mechanisms, such as the generation of a colored radical or an active redox compound where the capacity of the sample under study to either reduce the active redox compound or remove the radical is determined by spectrophotometry. The reducing power of PDCF extracts obtained by UAE was found between 652.20 mg TE/100 g PDCF and 1,433.9 mg TE/100 g PDCF (Table 1). The junction of factor levels that indicated maximum FRAP-UAE antioxidant values also coincides with run number 9 (70:30 ethanol:water, 0.03 g of sample, 0.10% emulsifier, 20 min). Decreasing the sample proportion from 0.1 g PDCF/mL to 0.03 g PDCF/mL and ethanol concentration from 90% to 70% significantly increased FRAP-UAE (Figure 2C). A previous study [34] showed that the reducing power of extracts depends on the polarity of the solvent used. Another study [32] argued that the bioactive compounds from seeds would be more easily extracted in less polar solvents. In this sense, it is probable that PDCF organic material with the highest polarity was solubilized in 30% of water and the compounds with less polarity were solubilized in 70% of ethanol.
The effect of factor levels on antioxidant activity of the PDCF extracts evaluated by the ABTS method showed significant differences from 3,637.9 mg TE/100 g PDCF to 14,258.3 mg TE/100 g PDCF (Table 1). Compared to the behavior of TPC and FRAP results by UAE, the highest antioxidant activity by the ABTS method was obtained under the conditions of run number 5 (70% ethanol; 0.075 g of PDCF/mL; 0.19% emulsifier, 20 min) instead of run number 9 (70% ethanol; 0.030 g of PDCF; 0.10% emulsifier, 20 min). Ethanol concentration (70%) and time (20 min) were the factors that were not modified in these two runs. As a matter of fact, the data reported in Figure 2D support that increasing the sample proportion from 0.03 g PDCF/mL to 0.075 g PDCF/mL and ethanol concentration from 50% to 70% significantly increased the antiradical capacity by ABTS-UAE. These results are higher compared to the results obtained by other authors [30], who evaluated chia seeds antioxidant capacity by ABTS in extracts obtained by UAE.
The use of microwave energy for the extraction of polyphenols is a process based on molecular interaction with the electromagnetic field. The energy release from this interaction is fast and efficient [35–37]. The TPC obtained by MAE from PDCF yielded a minimum value of 834.52 mg GAE/100 g PDCF corresponding to run number 18 (60% ethanol; 0.50 g of PDCF; 60°C temperature, 3.50 min), and a maximum of 1,425.1 mg GAE/100 g of PDCF corresponding to run number 12 (60% ethanol; 0.20 g of PDCF; 60°C temperature, 3.50 min; Table 2). Run number 12 did not show significant differences compared to: run number 3 (40% ethanol; 0.40 g of PDCF; 60°C temperature, 3.50 min), run number 9 (50% ethanol; 0.30 g of PDCF; 80°C temperature, 2 min) and run number 15 (60% ethanol; 0.40 g of PDCF; 90°C temperature, 3.50 min). The surface response plot (Figure 3A) shows the effect of PDCF proportion and the temperature on TPC obtained for 3.5 min and 60% ethanol. Time was the only factor that had no significant influence on the MAE yield of TPC. The findings from the most relevant effects (Figure 3B) suggested that decreasing ethanol concentrations from 80% to 60%, sample content from 0.05 g PDCF/mL to 0.02 g PDCF/mL, extraction time from 5 min to 3.50 min, and temperature from 80°C to 60°C, can have a positive effect on TPC-MAE.
Experimental design for MAE and results for and antioxidant activity
| Runs* | Factors | Responses | |||||
|---|---|---|---|---|---|---|---|
| X1 | X2 | X3 | X4 | Y1: TPC mg (GAE/100 g PDCF) | Y2: FRAP (mg TE/100 g PDCF) | Y3: ABTS (mg TE/100 g PDCF) | |
| 1 | 50 | 40 | 5.0 | 0.03 | 991.5 ± 107.6 a | 851.3 ± 80.9 c | 15,979.5 ± 18.6 a |
| 2** | 60 | 60 | 3.5 | 0.04 | 1,163.6 ± 112.6 a | 789.3 ± 90.3 b | 17,668.5 ± 1,323.5 a |
| 3 | 40 | 60 | 3.5 | 0.04 | 1,311.1 ± 105.1 b | 984.2 c ± 41.7 c | 17,709.5 ± 1,172.6 a |
| 4 | 60 | 30 | 3.5 | 0.04 | 1,004.8 ± 162.8 a | 614.1 ± 22.6 a | 16,404.2 ± 1,230.7 a |
| 5 | 80 | 60 | 3.5 | 0.04 | 950.2 ± 50.2 a | 589.5 ± 14,0 a | 16,396.0 ± 708.2 a |
| 6 | 60 | 60 | 1.0 | 0.04 | 1,083.5 ± 53.9 a | 890.4 ± 13.4 c | 18,645.5 ± 2,240.8 a |
| 7 | 50 | 80 | 5.0 | 0.05 | 1,199.9 ± 46.1 a | 1,345.3 ± 49.8 e | 22,738.6 ± 278.6 b |
| 8 | 70 | 80 | 5.0 | 0.03 | 1,168.9 ± 83.9 a | 783.1 ± 48.0 b | 21,467.2 ± 2,461.4 b |
| 9 | 50 | 80 | 2.0 | 0.03 | 1,423.7 ± 117.4 b | 1,213.6 ± 7.55 d | 26,218.0 ± 1,377.8 b |
| 10 | 70 | 40 | 5.0 | 0.03 | 1,149.9 ± 72.7 a | 1,120.9 ± 57.6 d | 17,526.6 ± 232.2 a |
| 11 | 70 | 80 | 2.0 | 0.05 | 995.7 ± 21.7 a | 1,208.2 ± 0.47 d | 16,460.0 ± 885.9 a |
| 12 | 60 | 60 | 3.5 | 0.02 | 1,425.1 ± 143.3 b | 1,792.2 ± 150.2 f | 16,858.5 ± 1,932.0 a |
| 13** | 60 | 60 | 3.5 | 0.04 | 1,064.1 ± 64.2 a | 1,079.5 ± 88.8 d | 16,127.9 ± 716.8 a |
| 14 | 60 | 60 | 6.0 | 0.04 | 1,201.8 ± 63.5 a | 942.9 ± 42.9 c | 16,918.0 ± 1,378.4 a |
| 15 | 60 | 90 | 3.5 | 0.04 | 1,308.8 ± 48.7 b | 1,333.2 ± 8.9 e | 23,174.1 ± 1,555.1 b |
| 16 | 50 | 40 | 2.0 | 0.03 | 1,113.8 ± 104.2 a | 751.1 ± 3.9 b | 14,877.0 ± 125.2 a |
| 17 | 70 | 40 | 2.0 | 0.05 | 988.6 ± 17.3 a | 757.7 ± 61.9 b | 13,121.2 ± 593.8 a |
| 18 | 60 | 60 | 3.5 | 0.05 | 834.5 ± 6.8 a | 1,077.3 ± 21.0 d | 15,932.4 ± 416.5 a |
Y1 (TPC-MAE) = –22.9608 – 22,057.7 × X4 + 14.7794 × X1 + 23.8296 × X2 + 540.248 × X3 – 7,640.92 × X42 + 366.208 × X4 × X1 – 70.875 × X4 × X2 – 3,602.78 × X4 × X3 – 0.00481 × X12 – 0.31 × X1 × X2 – 6.03412 × X1 × X3 + 0.0219546 × X22 – 0.373333 × X2 × X3 + 1.67959 × X32 Y2 (FRAP-MAE) = –3,479.08 – 167,341 × X4 + 156.152 × X1 + 31.1404 × X2 + 1,518.47 × X3 + 1.60984E6 × X42 + 90.7463 × X4 × X1 + 512.344 × X4 × X2 – 5,395.72 × X4 × X3 – 0.681016 × X12 – 0.527356 × X1 × X2 – 16.6156 × X1 × X3 – 0.00511725 × X22 – 3.15329 × X2 × X3 – 13.7563 × X32 Y3 (ABTS-MAE) = –10,913.2 + 804,789 × X4 + 423.605 × X1 + 382.589 × X2 – 8,219.49 × X3 – 484,542 × X42 – 13,930.5 × X4 × X1 – 3,239.76 × X4 × X2 + 67,615.9 × X4 × X3 + 1.83932 × X12 – 6.76285 × X1 × X2 + 79.89 × X1 × X3 + 2.87847 × X22 – 16.583 × X2 × X3 + 196.291 × X32 | |||||||
*Derived from a Draper-Lin reduced composite design (16 random orthogonal runs and ** 2 center points). X1: ethanol concentration; X2: temperature; X3: extraction time; X4: g PDCF/mL solvent. In each column samples with different letters are statistically different at the level of alpha = 0.05. Equations at the bottom of the table are those of the fitted model based on the regression coefficients for the different responses
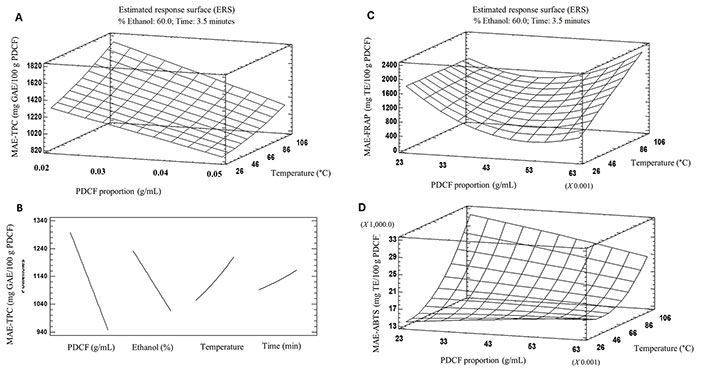
Response surface plots illustrating the effects of MAE on A: TPC and B: respective projections of the main effects of each factor, and effects on the C: FRAP and D: ABTS activities of the extracts
The effect of MAE variables on reducing power of the PDCF extracts is shown in Table 2. The results presented significant differences (P < 0.05) in MAE-produced PDCF extracts from 614.1 mg TE/100 g PDCF to 1,792.2 mg TE/100 g PDCF. The combination of variables that allowed the extraction of phenolic compounds with the highest reducing power was also the same combination (run 12; Table 2) observed in MAE-TPC (60:40 ethanol:water; 60°C, 0.02 g of PDCF for 3.5 min). These results reaffirm what was mentioned for UAE regarding the affinity of PDCF antioxidant compounds for intermediate to less polar mixtures of solvents. Decreasing sample proportion from 0.05 g PDCF/mL to 0.03 g PDCF/mL and increasing temperature from 40°C to 80°C significantly improved the reducing power of the extracts (Figure 3C).
The effect of MAE factors on the free radical scavenging ability of the PDCF extracts is shown in Table 2. MAE results oscillated from 13,121.2 mg TE/100 g PDCF to 26,218.0 mg TE/100 g PDCF. Compared to the behavior of TPC-MAE and FRAP-MAE results, the highest antioxidant activity by the ABTS method was obtained under the conditions of run 9 (50% ethanol; 0.03 g of PDCF; 80°C, 2 min) instead of run number 12 (60% ethanol; 0.02 g of PDCF, 60°C for 3.5 min). The findings from ABTS-MAE results (Figure 3C) suggested that increasing temperature from 60°C to 90°C, the proportion of sample/solvent to above 0.03 g PDCF/mL, maintaining 60% of ethanol concentration for 3.5 min, can have an improvement on the solubilization of PDCF antioxidant compounds and its free radical scavenging ability. Akbari et al. [38] have also obtained promising results (18,000 mg GAE/100 g) of fenugreek seeds MAE extracts using 0.09 g/mL, 2.4 min, and 63% ethanol concentration.
In the present work, MAE provided the highest extraction capacity compared to UAE (Figure 4). The MAE methodology improved the extraction, being the best extractive conditions: 60% ethanol, 0.20 g PDCF/mL, and 60°C, allowing a higher extraction yield (1,425.20 mg GAE/100 g HPDC) in less time (3.50 min) as compared to 20 min for UAE (871.26 mg GAE/100 g HPDC). A possible explanation for these results may be due to the direct interaction and localized heating of the microwaves with the solvent and sample, which causes the breakdown of the cell walls, the penetration of the solvent, the solubilization of the solutes and therefore, the release of bioactive compounds to the environment quickly and efficiently [32]. Polyphenols, being polar molecules, absorb microwave energy causing an increase in temperature, accelerating the completion of the extraction [39]. While the cavitation effect of ultrasonic waves breaks sample cell walls, improves mass transfer, and to some extent increases the solubilization of these compounds, it takes longer periods of extraction time [39, 40]. The acoustic cavitation generated by UAE could cause a possible degradation of the polyphenols extracts by hydroxyl radicals causing a decrease in the extraction yields [41].
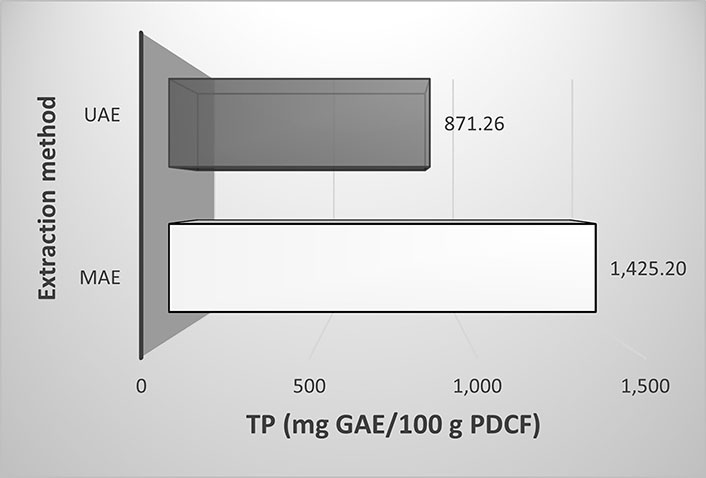
Comparison of maximum value of total phenolic content (TPC) obtained using UAE and MAE (run 12)
The efficiency of different extraction methods for chia cake seed polyphenols, such as Soxhlet, maceration, UAE, and supercritical technology, was studied by Guindani et al. [41]. The authors obtained higher extraction yields than in the present work; however, all techniques used excessive extraction times (from 1 h to 6 days). In another study, researchers carried out acid and hydroalcoholic extractions of polyphenols from defatted chia flour with much lower results than those described in this study [32].
The assays of this study were executed based on RSM with a Draper-Lin SCD. The data obtained was fitted to regression models and the predicted second-order polynomial equations of each response are detailed in Table 1 and Table 2. The UAE-TPC coefficient of determination R2 of the fitted model was able to explain 91% of the data variability of polyphenol extraction and the fitted model for MAE was able to explain 98.3% of the data variability of the response. The MAE exploratory test reveals that the experimental factors that significantly affected the TPC were: sample/solvent ratio (X4) with a P-value of 0.004, ethanol:water concentration (X1) with a P-value of 0.015, and temperature (X2) with a P-value of 0.011. The interactions of ethanol and temperature (X1:X2) and ethanol and time (X1:X3) were also statistically significant at P < 0.05.
In the case of UAE antioxidant activity results, the R2 was close to 1, showing a high degree of correlation between the observed and predicted values [0.975 for Y2 (FRAP-UAE) and 0.987 for Y3 (ABTS-UAE)]. Three of the experimental factors had a significant effect on the FRAP-reducing capacity of the extracts obtained by UAE. The reducing power was statistically significantly affected by the sample/solvent ratio (X4) at P < 0.05 (P = 0.032), by the percentage of ethanol (X1) at P = 0.014, and by the quadratic interaction at the time of extraction (X3X3) at P = 0.042. On the other hand, five effects had a P-value lower than 0.05 on UAE-ABTS results. The quadratic terms X4X4, X4X2, X1X1, X1X2, and X4 were highly significantly influenced by the radical scavenging activity (ABTS-UAE) at P = 0.012, 0.037, 0.017, 0.005, and 0.0122, respectively. In the case of MAE antioxidant activity, the R2 showed a high degree of correlation between the observed and predicted values [0.95 for Y2 (FRAP-MAE) and 0.967 for Y3 (ABTS-MAE)]. Three factors had a significant effect on the reducing capacity (FRAP) of MAE extracts: sample:solvent ratio (X4) at P = 0.045, its quadratic interaction of (X4X4) at P = 0.036 and temperature (X2) at P = 0.027. On the other hand, only the temperature factor had a significant effect on MAE-ABTS results at 0.006.
The PDCF ethanolic extracts obtained by UAE and MAE can be used as a source of phenolic compounds that could be incorporated into food products to improve their antioxidant activity. However, the concentration of polyphenols extracted differed with the application of different extraction methods and with different experimental factors. This study showed that the PDCF:solvent ratio and water:ethanol ratio are the factors that statistically influenced the polyphenol extraction yield. The highest content of polyphenols with antioxidant activity was obtained by the MAE method, optimizing the extraction process by 63%.
Thus, as a general conclusion of this research, it can be stated that the application of alternative green technologies, both MAE and UAE, improves the performance of the PDCF polyphenol extraction process. MAE was the most efficient method under the following conditions: 0.02 g HPDC/mL, ethanol:water (60:40), and 60°C for 3.5 min. Therefore, it could be used as an efficient green alternative to conventional methods.
ABTS: 2,2’-azino-bis-3-ethylbenzthiazoline-6-sulphonic acid
FRAP: ferric reducing antioxidant power
GAE: gallic acid equivalents
MAE: microwave-assisted extraction
PDCF: partially defatted chia flour
RSM: response surface methodology
TPC: total phenolic content
UAE: ultrasound-assisted extraction
The supplementary material for this article is available at: https://www.explorationpub.com/uploads/Article/file/101017_sup_1.pdf.
This research was supported by Secretaría de Ciencia y Tecnología (Universidad Nacional de Córdoba) and Consejo Nacional de Investigaciones Científicas y Técnicas (CONICET). We would like to thank Fernanda Quiroga for her technical help.
MA: Data aquisition, Formal analysis, Methodology, Writing—original draft. CA: Methodology, Writing—original draft. DD and LM: Data acquisition, Methodology. AA: Conceptualization, Study design, Funding acquisition. RB: Conceptualization, Study design, Formal analysis, Funding acquisition, Writing—review & editing.
The authors declare that they have no conflicts of interest.
Not applicable.
Not applicable.
Not applicable.
Not applicable.
This research was supported by Secretaría de Ciencia y Tecnología (Universidad Nacional de Córdoba) and Consejo Nacional de Investigaciones Científicas y Técnicas (CONICET). The funders had no role in study design, data collection and analysis, decision to publish, or preparation of the manuscript.
© The Author(s) 2023.
Copyright: © The Author(s) 2023. This is an Open Access article licensed under a Creative Commons Attribution 4.0 International License (https://creativecommons.org/licenses/by/4.0/), which permits unrestricted use, sharing, adaptation, distribution and reproduction in any medium or format, for any purpose, even commercially, as long as you give appropriate credit to the original author(s) and the source, provide a link to the Creative Commons license, and indicate if changes were made.

Leonel Pereira
Rut Domínguez ... Manuel Domínguez
Eliseo Sánchez-Loredo ... Juan A. Ascacio-Valdés
Ayla Elmi Kashtiban ... Sayna Zahedinia
Shafa’atu Giwa Ibrahim, Roselina Karim
Brice Ulrich Foudjo Saha ... Lifoter Kenneth Navti
Olamide Akande ... Daniel Ajewole
Evans Ntim Amedor ... James Owusu-Kwarteng
Luís M.G. Castro ... Manuela Pintado
José Pinela, José Ignacio Alonso-Esteban