Original Article

Affiliation:
1Department of Biochemistry, Faculty of Science, University of Douala, Douala 24157, Cameroon
Affiliation:
1Department of Biochemistry, Faculty of Science, University of Douala, Douala 24157, Cameroon
Affiliation:
1Department of Biochemistry, Faculty of Science, University of Douala, Douala 24157, Cameroon
ORCID: https://orcid.org/0000-0001-8571-9927
Affiliation:
1Department of Biochemistry, Faculty of Science, University of Douala, Douala 24157, Cameroon
ORCID: https://orcid.org/0000-0003-3983-1402
Affiliation:
2Laboratory of Food Science and Metabolism, Faculty of Science, University of Yaoundé, Yaoundé 812, Cameroon
Email: marlynemananga@yahoo.fr
Affiliation:
1Department of Biochemistry, Faculty of Science, University of Douala, Douala 24157, Cameroon
ORCID: https://orcid.org/0000-0002-6210-6869
Affiliation:
3Research Unit of Biochemistry of Medicinal Plants, Food Science and Nutrition, Department of Biochemistry, Faculty of Science, University of Dschang, Dschang 67, Cameroon
Email: stambotene@yahoo.fr
ORCID: https://orcid.org/0000-0002-2454-5983
Affiliation:
1Department of Biochemistry, Faculty of Science, University of Douala, Douala 24157, Cameroon
Affiliation:
1Department of Biochemistry, Faculty of Science, University of Douala, Douala 24157, Cameroon
Affiliation:
1Department of Biochemistry, Faculty of Science, University of Douala, Douala 24157, Cameroon
Affiliation:
1Department of Biochemistry, Faculty of Science, University of Douala, Douala 24157, Cameroon
Affiliation:
3Research Unit of Biochemistry of Medicinal Plants, Food Science and Nutrition, Department of Biochemistry, Faculty of Science, University of Dschang, Dschang 67, Cameroon
ORCID: https://orcid.org/0000-0002-8176-762X
Affiliation:
1Department of Biochemistry, Faculty of Science, University of Douala, Douala 24157, Cameroon
Affiliation:
1Department of Biochemistry, Faculty of Science, University of Douala, Douala 24157, Cameroon
Email: kanamod@yahoo.com
Explor Foods Foodomics. 2025;3:101091 DOI: https://doi.org/10.37349/eff.2025.101091
Received: March 09, 2025 Accepted: May 24, 2025 Published: August 06, 2025
Academic Editor: Yi Chen, Chinese Academy of Sciences, Huaiyin Institute of Technology, China
Aim: Soya (Glycine max L.) is a legume rich in nutrients (proteins, lipids, carbohydrates, and minerals) but also in anti-nutrients such as oxalate, which hampers the bioavailability of nutrients. The various processes used to treat it reduce the anti-nutrient content while affecting the protein content to a greater or lesser extent. This study aimed to evaluate the impact of a soaking period followed by cooking on the reduction of oxalates and enhancement of protein availability in soya flour.
Methods: To achieve this, the response surface methodology with the centred composite design was used to reduce the oxalate content and increase the protein content of cooked soya flour. The factors chosen were soaking time (5–24 h), cooking time (15–50 min), and cooking temperature (70–100°C). The soya flours obtained were characterised for protein and oxalate content using standard methods. The optimal samples were also characterised.
Results: The results obtained showed that cooking and soaking times, followed by the quadratic effect of soaking time, significantly (p < 0.05) increase the protein content and decrease the oxalate content. In terms of optimal conditions, a soaking time of 25.44 h, a cooking temperature of 101.05°C, and a cooking time of 61.93 min reduced the oxalate content by 87.43% and also increased the protein content from 35.98 g/100 g DM to 49.16 g/100 g DM. Optimal conditions of the different treatments also increase lipids, reducing sugar, and the main minerals like Ca, P, Mg, and Fe.
Conclusions: The application of such conditions would help to combat protein deficiencies.
Pulses are dried seeds from plants with pods [1]. They have an interesting nutritional profile, and are considered to be crucial sources of protein and constitute alternatives to the consumption of proteins of animal origin. The high expense of animal-based nutrient sources like meat, fish, and poultry makes them inaccessible to low-income populations. For human nutrition, plant protein sources are crucial due to their affordability and readily available [2]. But the nutritional value of pulses is generally poorly understood, and their consumption is not fully appreciated. A number of initiatives have therefore been launched to raise awareness of the need to improve the nutritional quality of pulses. With this in mind, the Food and Agriculture Organization of the United Nations (FAO) has declared 2016 the International Year of Pulses under the slogan “Nutritious seeds for a sustainable future” [3].
Among these legumes, soya, thanks to its richness in nutrients, is a nutritious legume because, apart from its high availability, its 32% protein content and 17% lipid content, it provides all essential amino acids, dietary fibers, vitamins, and minerals (phosphorus, calcium, zinc, magnesium, iron) [4]. It also plays a number of roles in terms of health, due to its beneficial physiological effects. It helps to prevent and control a wide range of chronic and nutritionally linked diseases like diabetes, obesity, cardiovascular diseases, and cancer [5]. Being low in fat, soya is important for better management of obesity. Its richness in protein and micronutrients helps to alleviate diseases linked to malnutrition through deficiency [6].
Despite the nutritional benefits of this legume, eating soya still causes many problems related to its digestion (flatulence, bloating, burping, enzyme inhibition) because of the presence of relatively high concentrations of anti-nutritional factors like phytic acid, oxalate, tannins, and saponins [7, 8]. When soya is digested, antinutrients interfere with the absorption and use of important minerals, thereby reducing protein digestibility. As a result, they make nutrients less available and thus reduce the nutritional value of this food [9]. Reducing these antinutrients to low concentrations would improve the nutritional quality of soya. Specific treatments, including soaking, roasting, cooking, germination, and fermentation, have been shown to considerably decrease the levels of these anti-nutrients [10]. Previous work done by Fotso et al. [4] found that soaking soya for 24 hours and steaming it for 19 minutes resulted in a 47.06% reduction in phylate and a 44.68% reduction in trypsin inhibitor. Similarly, the work of Ikese et al. [11] found that roasting soy flour for 30 minutes increased protein nutritional value by 39.21%. Building on this, the current study was initiated with the aim of assessing the impact of optimized soaking and cooking on soya protein and oxalate content.
The sample included dry soybean seeds (variety TGX-1835-10-E). Twenty-five kilograms of the seeds were obtained at the “Institute of Agricultural Research for Development (IRAD)” in Foumbot (latitude: 5° 30’ 29’ N; longitude: 10° 38’ 12’ E and altitude: 1,054 m) in Cameroon and stored in a hermetically sealed plastic bag at room temperature. The choice of this locality was justified by the identification of the soybean variety. Once the soya beans had been collected, they were transported to the Biochemistry Laboratory of the University of Douala’s Biochemistry Department, where they were used to produce various flours. This material was chosen due to its year-round availability, accessibility, and integration into local dietary habits. The reagents were purchased from local suppliers and were all HPLC grade. It consisted of Hexane for lipid quantification, H2SO4 and KMnO4 for oxalates extraction and titration respectively, HBO3, HCl, and NaOH for protein quantification.
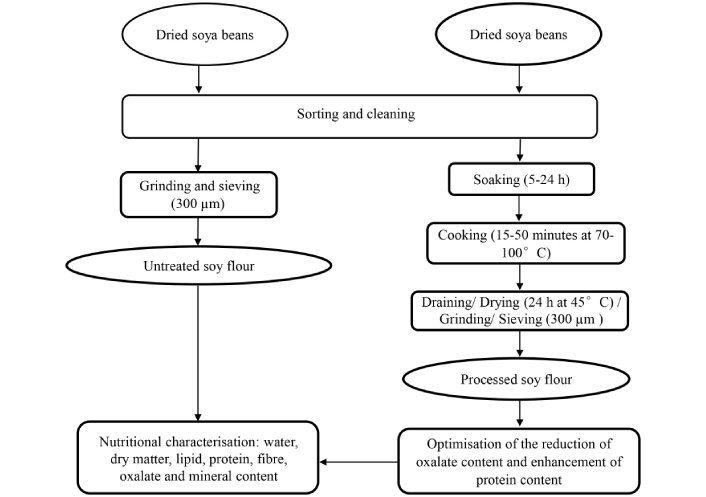
Following the transport to the Biochemistry Laboratory and division into two one-kilogram batches, the first lot underwent sorting, cleaning, and crushing with a 5000-watt Silver Crest (SC 1589, 5000 W, Germany) food processor, and particle size fractionation using a 300 μm sieve to yield untreated soy flour. The second batch of beans was sorted and washed. They were then soaked in tap water (1 kg of beans in 3 L of water) at different times (5–24 h). Cooking was performed in a water bath (HWS, Bangalore, India), with time ranging from 15–50 min and temperatures from 70–100°C. After draining, the beans were oven-dried at 45°C for 24 h. Finally, they were ground using a Silver Crest blender (SC 1589, 5000 W, Germany) and sieved through a 300 μm sieve. The flours were stored in Kraft’s paper in batches of 2. The different processes are shown in Figure 1.
The methodology of response surfaces through a centred composite design was used to optimise the reduction of oxalates and enhancement of protein in soy flour. The factors chosen were cooking time, cooking temperature, and soaking time. The responses studied were protein (Y1) and oxalate (Y2) content. The domains of the different factors were taken based on the results of preliminary experiments and an extensive literature review. Table 1 gives the different respective domains of each factor.
Definition of the experimental domain
| Factors | Abreviation | Range | ||
|---|---|---|---|---|
| –1 | 0 | 1 | ||
| Cooking time (min) | X1 | 15 | 32.5 | 50 |
| Cooking temperature (°C) | X2 | 70 | 85 | 100 |
| Soaking time (h) | X3 | 5 | 14.5 | 24 |
Randomized experiments were conducted, with responses measured in triplicate. The mathematical model, as described by equation 1, was proposed (polynomial degree 2) [4]:
where: Y: the response or magnitude of interest; b0: the constant; b1, b2, b3: the linear coefficients; b12, b13, b23, b123: the interaction coefficients; X1, X2, X3, X1X2, X1X3, X2X3, X12, X22, X32, X1X2X3 are the levels of the independent variables; £: The error
According to the equation and the matrix generated by the software, the 3-factor centred composite design has generated 20 experiments with 6 replicates in the centre of the domain. All the experiments performed are summarised in Table 2.
Presentation of the experimental matrix
| No. | Coded values | Real values | ||||
|---|---|---|---|---|---|---|
| X1 | X2 | X3 | Cooking time (X1) | Cooking temperature (X2) | Soaking time (X3) | |
| 1 | –1 | 1 | 1 | 15.00 | 100.00 | 24.00 |
| 2 | –1.68 (–α) | 0 | 0 | 3.07 | 85.00 | 14.50 |
| 3 | 0 | 0 | 1.68 (+ α) | 32.50 | 85.00 | 28.77 |
| 4 | 0 | 0 | 0 | 32.50 | 85.00 | 14.50 |
| 5 | + 1.68 (+ α) | 0 | 0 | 61.93 | 85.00 | 14.50 |
| 6 | 1 | 1 | 1 | 50.00 | 100.00 | 24.00 |
| 7 | –1 | –1 | 1 | 15.00 | 70.00 | 24.00 |
| 8 | 0 | –1.68 (–α) | 0 | 32.50 | 59.77 | 14.50 |
| 9 | 0 | 0 | 0 | 32.50 | 85.00 | 14.50 |
| 10 | –1 | –1 | –1 | 15.00 | 70.00 | 5.00 |
| 11 | 1 | 1 | –1 | 50.00 | 100.00 | 5.00 |
| 12 | 0 | 0 | 0 | 32.50 | 85.00 | 14.50 |
| 13 | 0 | 0 | –1.68 (–α) | 32.50 | 85.00 | 3.26 |
| 14 | –1 | 1 | –1 | 15.00 | 100.00 | 5.00 |
| 15 | 1 | –1 | –1 | 50.00 | 70.00 | 5.00 |
| 16 | 0 | +1.68 (+ α) | 0 | 32.50 | 110.23 | 14.50 |
| 17 | 0 | 0 | 0 | 32.50 | 85.00 | 14.50 |
| 18 | 0 | 0 | 0 | 32.50 | 85.00 | 14.50 |
| 19 | 0 | 0 | 0 | 32.50 | 85.00 | 14.50 |
| 20 | 1 | –1 | 1 | 50.00 | 70.00 | 24.00 |
Coded value refers to the value given by the software, which corresponds to the real value that we will use during experimentation in the laboratory
According to Tene et al. [12], the mathematical model was deemed acceptable provided that the determination coefficient, R2, exceeds 75%, the absolute average deviation mean is zero, and the bias factor (bf) falls within the range of 0.75 to 1.25.
In order to highlight the influence of processing conditions on the chemical quality of soya flour, the protein and oxalate contents were determined. The Association of Official Analytical Chemists (AOAC) [13] method was used to quantify protein in the various samples. After mineralisation with Kjedahl, the ammoniacal nitrogen was titrated with 0.1 N HCl, and the protein content was calculated using the formula N × 6.25. After extraction with 1.5 M H2SO4, oxalates were titrated hot with 0.1 M KMnO4 [14]. The titration was stopped when the solution turned a persistent purplish red for 30 s.
The soya flour with the best proteins (higher) and oxalates (lower) contents were used for characterisation in comparison to the untreated one. The proximate composition of the samples was determined using the AOAC [13] protocol. Moisture content was established by oven drying (Heraeus), at 105°C for 24 h until a stable weight was reached. Kjeldahl nitrogen analysis (N × 6.25) was used to calculate crude protein content. Fat content was obtained through 8 h of continuous extraction with hexane in Soxhlet apparatus (HWS-26, 1008748, Japan). Ash content was quantified by incinerating 2 g of flour at 550°C for 6 h and weighing the resulting residue. For the crude fibres, 2 g of flour was digested with a solution containing 50 mL of H2SO4 (0.25 N) and 50 mL of NaOH (0.3 N). The insoluble residue obtained was washed with hot water and dried in an oven at 105°C until a constant weight was obtained. The dried residue was then incinerated (550°C) and weighed to evaluate the crude fibre content by double digestion. The carbohydrate content was calculated using equation 2.
The method described by Fischer and Stein [15] that uses 3, 5-dinitrosalicylic reagent permits evaluation of reducing sugar. Maltose at a concentration of 0.2 g/L was used as a standard.
The mineral content (iron, zinc, magnesium, sodium, potassium, phosphorus, and calcium) of various samples was determined by the standard method of the AOAC [13]. Samples were ashed, and the resulting ash was dissolved in a 6 N HCl solution (1:1 H2O:HCl). Atomic absorption spectrophotometry (Shimadzu UNICAM 919, England) was employed to quantify zinc, iron, magnesium, potassium, calcium, and sodium content. Phosphorus content was analyzed colorimetrically using a molybdo-vanadate solution.
Oxalate levels were determined based on the modified titrimetric method of Aina et al. [14]. In the presence of H2SO4 and when hot, oxalic acid is oxidised by potassium permanganate. The oxidation of oxalic acid is marked by the medium turning pink, marking the end of the reaction.
Tukey’s test was used to assess the significance of individual factors. The determination coefficient R2 for the regression equations was evaluated using Fisher’s test. Statistical analyses were conducted in MINITAB 18, with a confidence level of p < 0.05. Contour plots were generated using SIGMAPLOT 12.0, and the effects of individual factors on the response were visualized using MINITAB 18.
Table 3 shows the macronutrient and anti-nutrient composition of treated soya. It was a question of defining the soaking time, cooking time, and cooking temperature that make it possible to obtain a soya flour with the lowest possible oxalate content and the best protein values that can contribute to the fight against food insecurity. The protein content varied between 29.07% (trial 2) and 52.77% (trial 5), while the oxalate content was between 0.42 (trial 5) and 1.73 mg/100 g (trial 2). There was a marked reduction in oxalate content with increasing soaking and cooking time. Similarly, there was no negative variation in the values of the two responses as a function of the trials. In fact, hydrolysis of the protein-oxalate complexes and elimination of the oxalates during processing would lead to an improvement in protein content.
Experimental values for protein and oxalate content in soya flour after treatments
| No. essais | Cooking time (X1) | Cooking temperature (X2) | Soaking time (X3) | Proteins (%) | Oxalates (mg/100 g) |
|---|---|---|---|---|---|
| 1 | 15.00 | 100.00 | 24.00 | 33.78 ± 0.04k | 1.52 ± 0.10b |
| 2 | 3.07 | 85.00 | 14.50 | 29.07 ± 0.35o | 1.73 ± 0.03a |
| 3 | 32.50 | 85.00 | 28.77 | 44.75 ± 0.13e | 1.22 ± 0.04de |
| 4 | 32.50 | 85.00 | 14.50 | 41.69 ± 0.05g | 1.12 ± 0.04ef |
| 5 | 61.93 | 85.00 | 14.50 | 52.77 ± 0.05a | 0.42 ± 0.04h |
| 6 | 50.00 | 100.00 | 24.00 | 46.20 ± 0.02b | 0.61 ± 0.01g |
| 7 | 15.00 | 70.00 | 24.00 | 31.42 ± 0.03m | 1.62 ± 0.04b |
| 8 | 32.50 | 59.77 | 14.50 | 42.33 ± 0.01f | 1.34 ± 0.01c |
| 9 | 32.50 | 85.00 | 14.50 | 40.92 ± 0.05j | 1.22 ± 0.06de |
| 10 | 15.00 | 70.00 | 5.00 | 30.90 ± 0.02n | 1.61 ± 0.03b |
| 11 | 50.00 | 100.00 | 5.00 | 45.65 ± 0.02c | 1.09 ± 0.01f |
| 12 | 32.50 | 85.00 | 14.50 | 41.09 ± 0.02ij | 1.11 ± 0.02ef |
| 13 | 32.50 | 85.00 | 3.26 | 32.95 ± 0.01l | 1.31 ± 0.04cd |
| 14 | 15.00 | 100.00 | 5.00 | 31.09 ± 0.01m | 1.62 ± 0.01b |
| 15 | 50.00 | 70.00 | 5.00 | 45.90 ± 0.03c | 0.52 ± 0.01gh |
| 16 | 32.50 | 110.23 | 14.50 | 41.55 ± 0.01h | 1.17 ± 0.02ef |
| 17 | 32.50 | 85.00 | 14.50 | 41.37 ± 0.01hi | 1.12 ± 0.04ef |
| 18 | 32.50 | 85.00 | 14.50 | 41.33 ± 0.005hi | 1.10 ± 0.03ef |
| 19 | 32.50 | 85.00 | 14.50 | 41.26 ± 0.01i | 1.09 ± 0.01f |
| 20 | 50.00 | 70.00 | 24.00 | 45.33 ± 0.01d | 0.46 ± 0.03h |
Values are expressed as mean ± standard deviation. Values with different letters in the same column are significantly different (p ˂ 0.05)
The protein and oxalate content of soya flour can be predicted by the following equations:
Proteins (Y1)
Oxalates (Y2)
These mathematical models indicate a positive correlation between protein yield (Y1) and both cooking time (X1), cooking temperature (X2), soaking time (X3), and cooking temperature-soaking time interactions (X2X3), but decrease with the quadratic effects of cooking time. Conversely, protein content (Y1) has a negative correlation with the quadratic terms of cooking period (X1X1), cooking temperature (X2X2), soaking time (X3X3), and cooking time-cooking temperature (X1X2) and cooking time-soaking time (X1X3) interactions. Similarly, the quantity of oxalates (Y2) increases with cooking time (X1), the quadratic effects of cooking temperature (X2X2), soaking time (X3X3) and cooking time-cooking temperature interactions (X1X2) and decreases with cooking time (X1), soaking time (X3), quadratic effects of cooking time (X1X1) and cooking time-soaking time (X1X3) interactions, cooking temperature-soaking time (X2X3). An exponential increase in the conditions of the various factors, as shown by the quadratic effects, would lead to a combined loss of proteins and oxalates. Similarly, the combination of soaking and cooking temperature favours the reduction of oxalates, due to their soluble nature and low thermostability, given the nature of the bonds that form this molecule (low-energy electrostatic bonds).
The Pareto diagrams for the protein and oxalate content of soya flour are shown in Figure 2. It can be seen from this figure that cooking time is the factor that significantly affects (p ˂ 0.05) the amount of protein, which increases with cooking time, soaking time and the quadratic effects of soaking time. Protein content significantly decreased (p < 0.05) with quadratic effects of cooking time and temperature, the temperature-soaking and time-temperature interactions and the linear temperature effect. Similarly, oxalate content was significantly influenced (p < 0.05) by the linear cooking period and the cooking time-cooking temperature interaction, while other factors (linear temperature and soaking time, quadratic effects and temperature-soaking and time-soaking interactions) had minimal influence. Figure 3 shows that cooking time gives the best protein content and a better reduction in oxalate content.
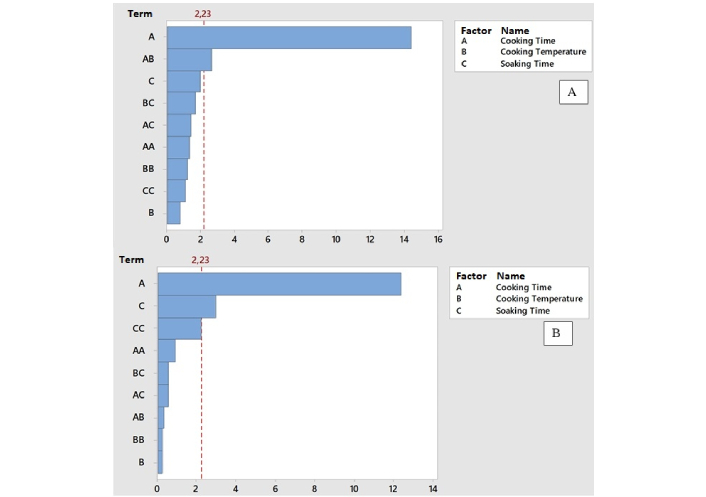
Pareto chart showing the significant effect of different factors on protein (A) and oxalate (B) content. Values of p < 0.05 indicate that there is a 95% significant effect of the level of confidentiality. AA: quadratic effect of cooking time; CC: quadratic effect of soaking time; BB: quadratic effect of cooking temperature; AB: interactions between cooking time and cooking temperature; BC: interactions between cooking temperature and cooking time; AC: interactions between cooking time and soaking time
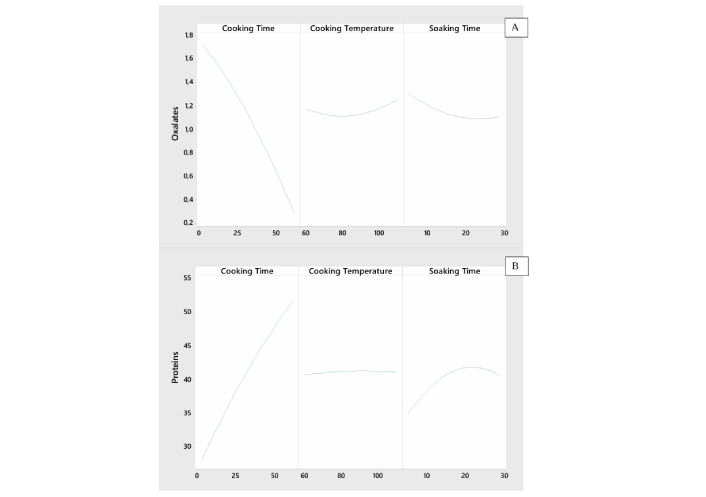
Curves showing the effects of cooking time, soaking time and cooking temperature on the protein (A) and oxalate (B) content of soya flour
Table 4 shows that the coefficients of determination (R2) for each of the two proposed models gave values of 94.39% for the protein content and 95.82% for the amount of oxalate. Similarly, the absolute mean deviation analysis (AADM) values obtained were 0.04 for protein content, 0.02 for oxalate and those for the bias factor 1.08 (proteins) and 1.05 (oxalates), confirming the validation of the models.
Model validation elements
| Validation elements | Symbols | Proteins (%) | Oxalate (mg/100 g) | Standard value |
|---|---|---|---|---|
| Determination coefficient | R2 | 94.39% | 95.82 | 75% |
| absolute average deviation of the mean | AADM | 0.04 | 0.02 | 0 |
| Bias factor | Bf | 1.08 | 1.05 | 0.75 ˂ Bf ˃ 1.25 |
The main effects of the different factors on protein and oxalate levels (p < 0.05) obtained using MINITAB 18 software are shown in Figure 3. This figure shows a rise in the protein content with cooking time (continuously), soaking time until reaching respective peaks of 25 h (soaking) and cooking temperature until 100°C (cooking). A decrease in protein content after 25 h of soaking could be due to the leaching of soluble protein. We also note a decrease in the quantity of oxalates with all the parameters. Cooking time must reduce the oxalate content, and then confirm the coefficient of this factor. Cooking induces leaching and thermal degradation of oxalates.
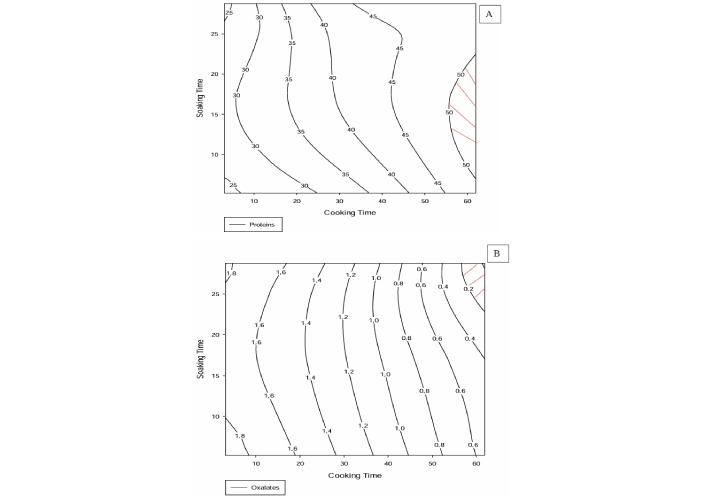
The contour plots for the compromises obtained using SIGMA PLOT 12 software to show the zone where the application of the treatments simultaneously results in a protein and oxalate content within the recommended range are shown in Figure 4. This figure shows that soaking for 26 h and cooking for 64 min resulted in a lower oxalate content. However, soaking for 23 h and 61 min resulted in a higher protein content and soaking for 30 h and 61 min resulted in a lower oxalate content. According to this figure, the hatched area of the plot represents the zone satisfied with the anti-nutrient and macronutrient content.
For the determination of the optimum conditions, the MINITAB 18.0 software was used to define the best combinations for associating the different factors to obtain the best responses. Table 5 displays the predicted values from MINITAB 18.0 for the optimized combinations. To confirm the accuracy of these predictions, laboratory tests were conducted under the optimized conditions, with the experimental results presented in the following table. The optimum conditions that allow enhancing protein values and reducing oxalates were 61.93 min of cooking at 101.05°C and soaking for 25.44 h. All these conditions were covered by the chosen domain, which then demonstrates the accuracy.
Comparison of experimental and calculated values
| Soya flour | Optimal conditions | Experimental optimum value | Optimal predicted value | Desirability |
|---|---|---|---|---|
| Cooking time | 61.93 | |||
| Soaking time | 25.44 | |||
| Cooking temperature | 101.05 | |||
| Proteins (%) | 49.16 ± 0.5 | 51.20 | 0.93 | |
| Oxalates (mg/100 g) | 0.39 ± 0.03 | 0.31 | 1 |
Table 6 shows the proximate composition of treated and untreated soya flours. Cooking soya significantly altered (p < 0.05) the macronutrient content. Indeed, treatment significantly (p ˂ 0.05) enhances moisture, proteins, lipids and reducing sugars and reduces ash, total carbohydrates and fibres.
Macronutrient content of soy flour (g/100g DM)
| Parameters | Untreated soya | Optimised soya |
|---|---|---|
| Moisture content (%) | 4.35 ± 0.43b | 5.01 ± 0.25a |
| #Ash (%) | 3.74 ± 0.42a | 2.24 ± 0.16b |
| #Proteins (%) | 35.98 ± 0.83b | 49.16 ± 0.46a |
| #Lipids (%) | 19.06 ± 0.29b | 26.26 ± 0.20a |
| Total carbohydrates (%) | 33.74 ± 0.24a | 14.95 ± 0.13b |
| Fibres (%) | 3.13 ± 0.04a | 2.38 ± 0.05b |
| Reducing sugars (% of carbohydrates) | 2.14 ± 0.05b | 7.79 ± 0.63a |
Values with different superscript letters in the same row are significantly different (p ˂ 0.05). # The results for lipid, protein, and ash content were adapted from the work published by Dongmo et al. [16]. © 2024 The Author(s). CC-BY NC
The mineral and oxalate content of the soya bean is shown in Table 7. Phosphorus (P) is the most representative mineral, followed by potassium (K). The proportions vary respectively between 101.44 ± 2.41 (optimal soya flour) and 184.78 ± 0.29 mg/100 g (untreated soya flour) (K), and 179.90 ± 2.67 (optimal soy flour) and 130.34 ± 0.35 mg/100 g (untreated soya flour) (P). Treatment significantly (p ˂ 0.05) enhances calcium, magnesium, phosphorus and iron. The oxalate content is significantly reduced (p ˂ 0.05) by cooking the soya. This reduction is at least 87.43%.
Minerals and oxalate content of soy flour (mg/100 g DM)
| Parameters | Untreated soya | Treated soya |
|---|---|---|
| K | 184.78 ± 0.29a | 101.44 ± 2.41b |
| Na | 27.07 ± 0.23a | 15.98 ± 1.80b |
| Ca | 34.52 ± 0.44b | 104.24 ± 0.65a |
| Mg | 62.7 ± 0.27b | 112 ± 2.05a |
| P | 130.34 ± 0.35b | 179.90 ± 2.67a |
| Fe | 2.36 ± 0.20b | 4.40 ± 0.23a |
| Zn | 3.80 ± 0.01a | 2.63 ± 0.13b |
| Oxalates | 3.34 ± 0.11a | 0.42 ± 0.04b |
Values with different superscript letters in the same row are significantly different (p ˂ 0.05)
Water content increased from 4.35% in the untreated samples to 5.01% in the treated samples. Cooking facilitated water diffusion into the seeds due to cell wall weakening [4, 17]. Water influx into the seeds led to the outward diffusion of minerals, resulting in reduced ash content [12]. Untreated soybeans had a fibre content of 3.13%, while treated soybeans had 2.38%. The decrease in fibre content after double treatment can be attributed to the solubilization and loss of fibre components during heat-induced cellulose wall breakdown. Dongmo et al. [17] reported that heat treatment had an inverse effect on reducing sugars (increasing them) and starch content (decreasing it). In the same vein, Tene et al. [12] demonstrated that the sharp reduction in amylose content after various treatments was due to the low rigidity of this molecule compared with amylopectin.
The ash content of the various samples shows that treated and untreated soya flour exhibits a significant variation. This difference could be due to the treatments applied to the soya beans, as it has been shown that during soaking and cooking, for example, there is a loss of minerals, which are the constituents of ash, which could explain the lower ash content in the optimal soya flour [18]. These results are in agreement with those of Kavitha and Parimalavalli [19], who showed a decrease in the ash content of some legumes and cereals under the effect of roasting.
The protein contents of samples were 35.98 g/100 g and 49.16 g/100 g DM for untreated and treated soya beans, respectively. This increase could be explained by the breakdown of crude protein into amino acids during soaking and cooking [8]. These observations corroborate those of Fotso et al. [4], who demonstrated that cooking increased the protein content of soya beans. However, these results disagree with those of Mananga et al. [8], who demonstrated that soaking reduced the protein content of legumes. This difference in results can be explained by the soaking time, as a long soaking time leads to a loss of nutrients in the food.
The increase in lipid content would be due to the destruction of the cell structure in relation to the degree of heat during heat treatment, resulting in the degradation of certain active substances and thus the effective release of lipids [17, 20] and to the loss of other elements. However, they were higher compared to those reported by Farinde et al. [21] (1.22 and 1.14 g/100 g DM) on raw and processed lima beans. Nevertheless, these results are comparable to those observed by Fotso et al. [4] in Cameroon (17.40 g/100 g DM) on soya beans. Thus, the lipid content observed in these samples shows that soya could be used to cover the body’s lipid requirements.
Total carbohydrates represent the fraction that can be metabolised by humans. It varies from 33.74 g/100 g DM (untreated soya flour) to 14.95 g/100 g DM (treated soya flour). This shows that soaking and cooking influence this content. Treatments lead to a reduction in total sugar content. This may be due to the soaking effect, which hydrolyses these carbohydrates. Similarly, cooking in water leads to a loss of soluble carbohydrates by diffusion into the water, noting that reducing carbohydrates are likely to react with certain amino groups in proteins during heat treatment: this is the Maillard reaction [22]. In the same vein, Tene et al. [12] demonstrated that the sharp reduction in amylose content after various treatments was due to the low rigidity of this molecule compared with amylopectin.
Fibre represents the non-digestible carbohydrate fraction. It varies from 3.13 g/100 g DM (untreated soya flour) to 2.38 g/100 g DM (treated soya flour), which shows that variety as well as treatment have a significant effect (p ˂ 0.05) on it. These low fibre contents would be due to the operations unit required to produce the flours, in this case, soaking, which results in the elimination of the fibre-rich bran.
Reducing sugar contents ranged from 2.14 g/100 g (untreated soya flour) to 7.79 g/100 g (treated soya flour). This increase could be due to the hydrolysis of starch during cooking [23]. These values are higher than those reported by [8].
Generally speaking, the results obtained in these various analyses revealed that mineral contents (Calcium, Magnesium, Phosphorus and Iron) in treated samples were higher than those in untreated samples on the one hand, and decreased (Potassium, Sodium and Zinc) on the other. This increase could be due to the fact that soaking and cooking are applied to reduce anti-nutrients, thereby increasing the content and availability of minerals [24]. This reduction in minerals is related to the soaking/cooking treatments. The presence of large quantities of nutrients in these food matrices does not necessarily guarantee that they are available, as the presence of anti-nutrients in quantities above tolerable thresholds could hinder the body’s optimal use of these nutrients. Once the effect of the treatments on macro- and micronutrient content had been assessed, the next step was to determine the effect of these treatments on the anti-nutrient content of the matrices used. On the one hand, this reduction in anti-nutrients may be due to soaking, as it has been shown that soaking leads to a reduction in anti-nutrients [4]. On the other hand, cooking may also be responsible for this drop in anti-nutrient content because, in addition to improving protein quality by destroying or inactivating protein inhibitors, cooking also reduces heat-labile anti-nutrients such as phenolic compounds and oxalates [25, 26]. Agume et al. [27] found that the effects of soaking and cooking could reduce the levels of anti-nutrients (phytates, oxalates and tannins) in soya flour by up to 96%. Furthermore, to complex minerals, some of these anti-nutrients, such as tannins, can complex proteins, thereby reducing their bioavailability at the intestinal level [6, 28].
This work aimed to optimise oxalate reduction and protein increase in soya flour. Analyses showed that soaking time, cooking temperature and cooking time had a negative impact on oxalate content and a positive impact on protein content. The study of optimal conditions showed that 25.44 h soaking time, 101.05°C cooking temperature, and 61.93 min cooking time resulted in a reduction of oxalate content and an increase in protein content, with values of 87.43% and 49.16 g/100 g, respectively. Treatments also increase many nutrients like minerals (Ca, P, Mg, and Fe), lipids, and reducing sugars. Such treatments could therefore be recommended for the processing of legumes to enhance their nutritional values and the availability of many nutrients.
Protein-energy malnutrition is caused by the low nutritional value of supplementary feeds, but above all by the low availability of many nutrients, such as proteins. The results of this work show the way for the production of supplemental flours with better nutritional and digestible values, while limiting the presence of anti-nutrients.
The optimum conditions for producing sprouted soya flour with a high protein content and good digestibility have been demonstrated.
The oxalate content was reduced by more than 87%.
A mathematical model has been obtained that is reproducible beyond 95% and can be used by manufacturers.
Extend this work to other plant matrices.
Integrate other factors such as the mass/soaking water ratio, the cooking method and the concentration of different organic salts (NaCl, NaHCO3…).
TDD: Conceptualization, Formal analysis, Investigation, Methodology, Writing—original draft. NM: Data curation, Formal analysis, Investigation, Methodology, Writing—review & editing. ARFM and NPN: Formal analysis, Methodology, Writing—review & editing. MJM: Conceptualization, Data curation, Investigation, Methodology, Writing—review & editing. FFDD, JCMK, UFT, MY, YO, HD, and JNN: Methodology, Writing—review & editing. STT: Data curation, Formal analysis, Methodology, Writing—original draft, Writing—review & editing. MMKS: Conceptualization, Data curation, Formal analysis, Funding acquisition, Methodology, Project administration, Resources, Software, Supervision, Validation, Visualization, Writing—review & editing.
The authors do not have any conflicts of interest.
Not applicable.
Not applicable.
Not applicable.
The raw data supporting the conclusions of this manuscript will be made available by the authors, without undue reservation, to any qualified researcher.
The authors received funding from the Nestlé Foundation in March 2023. The funders had no role in study design, data collection and analysis, decision to publish, or preparation of the manuscript.
© The Author(s) 2025.
Open Exploration maintains a neutral stance on jurisdictional claims in published institutional affiliations and maps. All opinions expressed in this article are the personal views of the author(s) and do not represent the stance of the editorial team or the publisher.
Copyright: © The Author(s) 2025. This is an Open Access article licensed under a Creative Commons Attribution 4.0 International License (https://creativecommons.org/licenses/by/4.0/), which permits unrestricted use, sharing, adaptation, distribution and reproduction in any medium or format, for any purpose, even commercially, as long as you give appropriate credit to the original author(s) and the source, provide a link to the Creative Commons license, and indicate if changes were made.

View: 7317
Download: 216
Times Cited: 0