 Original Article


Affiliation:
Department of Analytical Chemistry, University of Valencia, 46100 Burjassot, Spain
†These authors contributed equally to this work.
ORCID: https://orcid.org/0009-0004-7238-0150

 ,
,
Affiliation:
Department of Analytical Chemistry, University of Valencia, 46100 Burjassot, Spain
†These authors contributed equally to this work.
ORCID: https://orcid.org/0009-0009-4225-3712
,
Affiliation:
Department of Analytical Chemistry, University of Valencia, 46100 Burjassot, Spain
Email: david.perez-guaita@uv.es
ORCID: https://orcid.org/0000-0002-2640-2927

Explor Foods Foodomics. 2026;4:1010176 DOI: https://doi.org/10.37349/eff.2026.1010176
Received: February 13, 2026 Accepted: April 26, 2026 Published: July 06, 2026
Academic Editor: Bruno Alves Rocha, University of São Paulo, Brazil
The article belongs to the special issue Food Contaminants: Analysis, Occurrence and Risk Assessment
Aim: Mycotoxins are toxic secondary metabolites produced by various fungal species, commonly found as contaminants in food products and biological matrices. Due to their potential adverse effects on human health, reliable analytical methods for their detection are essential.
Methods: This study presents the development and validation of an analytical method based on ultra-high-performance liquid chromatography coupled with tandem mass spectrometry (UHPLC-MS/MS) for the simultaneous determination of the emerging mycotoxins citrinin (CIT) and sterigmatocystin (STG) in human urine. Sample preparation was optimized, performed using the QuEChERS (Quick, Easy, Cheap, Effective, Rugged, and Safe) extraction technique, selected for its high recovery rates and reproducibility.
Results: The method demonstrated satisfactory linearity, precision, and sensitivity, with limits of quantification of 2.5 pg/mL and 0.75 pg/mL for CIT and STG, respectively. Analysis of twenty urine samples revealed the presence of CIT in six samples at trace concentrations, while STG was not detected above the quantification limit.
Conclusions: A preliminary risk assessment of CIT indicated that the detected levels do not pose a significant toxicological risk. The validated method shows great potential for application in human biomonitoring studies aimed at assessing exposure to mycotoxins.
Mycotoxins are toxic secondary metabolites produced by certain filamentous fungi or moulds. These substances can contaminate foods and feeds, especially under favourable temperature and humidity, posing serious risks to human and animal health [1]. Human exposure to mycotoxins can occur directly through the consumption of contaminated food or indirectly by ingesting animal-derived products [2]. According to the Rapid Alert System for Food and Feed (RASFF), mycotoxins were the most frequently reported contaminant category in Europe in 2024 [3].
Among mycotoxins, citrinin (CIT) is produced by fungi of the Aspergillus, Penicillium, and Monascus genera. According to previous reports from the European Food Safety Authority (EFSA), the primary source of human exposure to CIT is dietary intake, particularly from red rice, red yeast rice, and products derived from them [4]. However, several studies have reported its presence in a broader range of food commodities, such as cereal-based products [5], nuts [6], spices, and dried fruits [7]. Exposure to CIT represents a toxicological concern, and its toxicity has been extensively studied [8]. The kidney has been identified as the primary target organ [4], thus, the EFSA has classified CIT as a nephrotoxic compound. Additionally, this toxin has shown effects on reproductive toxicity in mice [9]. Given these toxicological concerns, the European Commission has set a maximum limit of 100 μg/kg for CIT in food supplements based on fermented red yeast Monascus purpureus [10]. Also, the EFSA has established a provisional tolerable daily intake (PTDI) of 0.2 µg/kg (body weight) per day for this mycotoxin [4].
STG is a mycotoxin primarily produced by fungi of the Aspergillus genus and is commonly found in a broad range of foodstuffs [11]. Regarding toxicity, the International Agency for Research on Cancer (IARC) has classified STG as a possible human carcinogen (Group 2B) [12]. STG has exhibited hepatotoxic and nephrotoxic effects in animals [13]. Toxicologic research has identified two distinct mechanisms of STG mutagenicity, involving the formation of a highly reactive epoxide group that covalently binds to DNA [14] or the hydroxylation of the aromatic ring, producing a catechol that can also react with DNA [15]. Short-term exposure to STG can also modulate immune function in a dose-dependent and tissue-specific manner, further supporting immunotoxicity as a principal mechanism underlying the carcinogenic potential of this compound [13, 16]. Despite this known toxicity, no regulatory maximum limit has yet been established for STG.
Consequently, there is an increasing urgency to monitor mycotoxin exposure. This can be achieved through external exposure assessment, by determining levels in food and estimating dietary intake, or through internal exposure assessment, by biomonitoring mycotoxins and their metabolites in biological samples [17]. Measurement in food allows estimation of dietary exposure, although it does not capture other sources, such as the environment. On the other hand, while urinary biomarkers vary with daily intake, biological samples are easy to obtain and reflect internal exposure [18]. Most mycotoxins and their metabolites are excreted in urine, making it the most commonly used matrix for biomonitoring and epidemiological studies of mycotoxin exposure [19]. Additionally, urine is non-invasive, easy to collect in relatively large volumes, reflects recent exposure, and allows for simple sample preparation compared to other biological matrices. Approximately 40% of ingested CIT is metabolized, and roughly half of this portion undergoes detoxification to form dihydrocitrinone (DH-CIT) [20, 21]. While exposure in biomonitoring studies is usually expressed as the sum of both species [22, 23], its free form has also been detected in urine samples, so exposure can also be calculated exclusively from CIT concentrations by applying the appropriate metabolization ratio [24]. While the metabolic profile of sterigmatocystin (STG) is still poorly characterized, its glucuronide is generally considered the main metabolite [25]. However, detecting its free form, even at lower concentrations, is a viable approach that simplifies sample pretreatment and prevents further matrix fouling [26]. CIT levels in urine reported in previous studies range from 0.02 to 5.96 ng/mL [20, 22], while STG ranged from 1.6 to 3.7 ng/mL [24, 26].
Numerous analytical techniques have been developed for the analysis of mycotoxins in urine, with liquid chromatography coupled with tandem mass spectrometry (LC-MS/MS) considered one of the most efficient due to its high intrinsic sensitivity and selectivity in complex matrices [27]. Some authors have employed the dilute-and-shoot approach [28], which is fast and simple, but may suffer from reduced sensitivity, increased matrix effects (MEs), and potential clogging of the equipment [29]. Consequently, most methods incorporate extraction and purification steps. Among these, immunoaffinity column (IAC) and solid-phase extraction (SPE) are the most commonly used clean-up techniques [30]. The QuEChERS (Quick, Easy, Cheap, Effective, Rugged, and Safe) method has been previously applied in multi-analyte methods [31]. This technique is ideal for the precise quantification of mycotoxins and their metabolites at trace levels. In particular, QuEChERS combined with dispersive SPE (d-SPE) has been reported to provide comparable recoveries to more selective methods such as MultiSep® or IAC, while offering advantages in terms of speed, simplicity, and lower cost [32].
This study aimed to develop a simple, efficient, and straightforward procedure for determining CIT and STG in human urine based on ultra-high-performance LC-MS/MS (UHPLC-MS/MS), and to validate it in accordance with the Commission Implementing Regulation (EU) 2023/2782 [33], which establishes the criteria for method performance in the official control of mycotoxins. The main performance characteristics were assessed, including the sensitivity, selectivity, accuracy, and precision. Following validation, a monitoring study was conducted to evaluate the occurrence and concentration of these mycotoxins in a group of 20 volunteers from Valencia province (Spain). Additionally, a risk assessment of CIT exposure in the Valencian population was performed using urinary biomonitoring data, and the results were compared with assessments from other regions to contextualize potential health risks.
Formic acid (HCOOH) with 98–100% purity was supplied by Scharlab (Barcelona, Spain). Ammonium formate for HPLC with 99% purity was provided by Fluka Analytical (Buchs, Switzerland). Methanol (MeOH) supplied by Fisher Chemical (Madrid, Spain) and acetonitrile (ACN) supplied by PanReac AppliChem, ITW Reagents (Barcelona, Spain), both with a purity of 99.9% and LC-MS grade, were also employed. For the extraction process, QuEChERS extraction kits (4 g MgSO4, 1 g NaCl, 1 g trisodium citrate dihydrate, and 0.5 g disodium citrate sesquihydrate) and ceramic homogenizers for QuEChERS extraction were obtained from Scharlab (Barcelona, Spain). SPE cartridges Supel™ Swift HLB (200 mg, 6 mL) were purchased from Merck (Madrid, Spain). Ultrapure water (18.2 MΩ cm) was obtained using a Milli-Q water purification system from Adrona (Riga, Latvia).
High-purity standards (> 99.9%) of CIT (CAS 518-75-2) and CIT-13C13 (CAS 2802898-41-3), provided by LGC (Barcelona, Spain), were used as ACN solutions at concentrations of 100.2 ± 1.2 and 10.17 ± 0.12 mg/L, respectively. STG (CAS 10048-13-2) was supplied by Merck (1 × 1 mg), and STG-13C18 (unlabelled CAS 10048-13-2) was provided by CymitQuimica (1 × 1.2 mL), both at 25 ppm. Finally, an internal standard calibration curve was prepared in ACN with CIT concentrations of 0.025 to 20 ng/mL of CIT and 1 ng/mL of CIT-13C13. For STG, concentrations of 0.010 to 5 ng/mL were used, and 2.5 ng/mL of STG-13C18. Stock, intermediate, and calibration standard solutions were stored in a freezer at –20°C.
During the development of the CIT and STG determination method, several concentrated first-morning urine samples collected from different individuals were used in accordance with the Internal Regulations of the Ethics Committee (2024-OTRO-3210712) for Research of the University of Valencia (CEC-UV). Written informed consent was obtained from all participants prior to sample collection. Different sample preparation approaches, including direct analysis, SPE, and QuEChERS, were systematically evaluated for the extraction and purification of CIT and STG from urine. Based on recovery, reproducibility, and compliance with regulatory criteria, QuEChERS was selected as the most suitable method for the analysis of the samples.
Ten milliliters of urine sample was transferred into a 50 mL centrifuge tube. Subsequently, 50 μL of a 10 ng/mL solution of CIT-13C13 and 12.5 μL of a 100 ng/mL solution of STG-13C18 were added as internal standards. Subsequently, 10 mL of an ACN:H2O solution (80:20, v/v) containing 0.1% HCOOH was added, along with a QuEChERS extraction salt packet (4 g MgSO4, 1 g NaCl, 1 g trisodium citrate dihydrate, and 0.5 g disodium citrate sesquihydrate) and a ceramic homogeniser. Then, the mixture was manually shaken for a minute, followed by vortexing for an additional minute. The mixture was then subjected to a centrifugal process at 6,000 rpm for a period of 10 min. The resultant upper layer was transferred to a 50 mL tube, evaporated under nitrogen stream, and reconstituted with 500 μL of ACN. The extract was then filtered through a 0.22 μm nylon filter and transferred to a topaz vial. Finally, the samples were analysed by UHPLC-MS/MS.
UHPLC separation was conducted at a column temperature of 40°C, with an injection volume of 10 μL and a flow rate of 0.4 mL/min. Chromatographic separation was achieved using a Gemini® NX-C18 column (150 × 2.0 mm, 3 µm particle size, 110 Å pore size; Phenomenex, Torrance, CA, USA). Isocratic elution was performed using a mobile phase consisting of 1 mM ammonium formate in water with 0.1% HCOOH (mobile phase A) and 1 mM ammonium formate in MeOH (mobile phase B), mixed in a ratio of 20:80 (v/v) with a total analysis time of 5 min.
A Thermo Fisher Scientific TSQ Quantum Ultra triple quadrupole mass spectrometer (Madrid, Spain) was used for the analysis, operating in electrospray ionization (ESI) mode: negative (ESI–) for CIT and positive (ESI+) for STG. The ESI source parameters were configured as follows: spray voltage of 4,000 V for CIT and 5,000 V for STG, sheath gas pressure of 35 arbitrary units (a.u.), auxiliary gas pressure of 15 a.u., and capillary temperature of 350°C. Table 1 summarizes the multiple reaction monitoring (MRM) transitions, collision energies (CEs), tube lens values, and retention time used for the determination of each analyte. According to the European Commission’s guidance document on the identification of mycotoxins and plant toxins in food and feed (2023), confirmation of analytes was based on three main criteria [34].
No fewer than two ion products per analyte, with one used for the quantification and the other one for the confirmation.
The retention time of the analytes in unknown samples must match that of the calibration standards within a maximum tolerance of ± 0.1 min in the same batch.
The relative ion ratio of the two product ions in the samples must be within ± 30% of the average ratio observed in the calibration standards from the same batch.
Spectrometric and chromatographic parameters used for CIT and STG determination.
| Compound | Precursor ion | Q1 (m/z) | Tube lens (V) | Q3 (m/z) | CE (V) | Rt (min) |
|---|---|---|---|---|---|---|
| CIT | [M + MeOH]– | 281.0 | 49 | 249.3 | 19 | 2.3 |
| 205.0 | 27 | |||||
| CIT-13C13 | [M + MeOH]– | 294.1 | 37 | 262.2 | 19 | 2.3 |
| STG | [M + H]+ | 325.0 | 89 | 281.0 | 45 | 1.6 |
| 310.1 | 25 | |||||
| STG-13C18 | [M + H]+ | 342.9 | 43 | 327.3 | 33 | 1.6 |
CE: collision energy; CIT: citrinin; MeOH: methanol; Q1: parent ion; Q3: product ion; Rt: retention time; STG: sterigmatocystin.
Validation of the methodology has been developed in fortified blank urine samples (i.e., urine samples fortified at different concentrations of CIT and STG) to ensure the accuracy and reliability of the results obtained. ME was evaluated according to Equation 1 being the acceptance criteria between 80% and 120% [35].
For the validation, a series of analytical batches were prepared, including a blank sample, a reagent blank, and blank samples spiked at three concentration levels corresponding to: low (2.5 pg/mL), medium (50.0 pg/mL), and high (500.0 pg/mL) for CIT and low (1.3 pg/mL), medium (25.0 pg/mL), and high (125.0 pg/mL) for STG. Over a six-day period, validation was conducted through nine distinct analytical sequences to assess key performance criteria such as accuracy, selectivity, linearity, intra-day relative standard deviation (RSDr), and inter-day relative standard deviation (RSDWR) precision, as well as determination of limit of detection (LOD) and limit of quantification (LOQ) to ensure compliance with the requirements set forth in Commission Implementing Regulation (EU) 2023/2782 [33]. Linearity was evaluated using an internal standard calibration curve prepared in ACN, covering concentration ranges of 0.025–20 ng/mL and 0.010–5 ng/mL for CIT and STG, respectively. Goodness-of-fit was assessed by calculating the deviation between nominal and measured concentrations, which was required to be below 20% with determination correlation coefficients (R2) higher than 0.99. The LOD was calculated as 3.3 times the standard deviation of a blank sample (i.e., urine free of or containing negligible amounts of the analytes) fortified at 2.5 pg/mL divided by the slope of the calibration curve, while the LOQ was calculated as three times the LOD.
Dietary exposure assessment was estimated through the analysis of urine samples and subsequent exposure estimation. For the purpose of estimation, the probable daily intake (PDI) was calculated using Equation 2. This assessment served not only to estimate exposure levels of CIT within the Spanish population but also to demonstrate the practical applicability of the developed analytical method in real-world scenarios.
Where CT is defined as the individual urinary concentration of CIT, normalized to creatinine (ng/mg Crea); VT is the average urine volume excreted over 24 hours, estimated at 1.6 L; bw represents the average body weight of the Spanish population aged 25 to 64 years, established at 70 kg [36]; and finally, EF is the urinary excretion fraction of CIT, set at 20% [37].
Two exposure scenarios were considered: a realistic scenario based on the average concentration, and a pessimistic scenario, using the 95th percentile concentration for dietary exposure calculations. The 95th percentile was selected for the pessimistic scenario as it is the internationally recommended metric by EFSA to represent high consumers, providing a conservative estimate while avoiding extreme outliers. Additionally, two distinct exposure scenarios were evaluated to address left-censored data: the upper bound (UB) and the lower bound (LB). In the UB scenario, all samples presenting CIT levels below the LOQ were assigned a value equal to the specific LOQ calculated. Conversely, in the LB scenario, any sample with a concentration below the LOQ was assigned a value of zero. Given that the true CIT concentration in these non-quantified samples realistically falls somewhere between zero and the LOQ, the UB approach inherently represents an overestimated, worst-case exposure scenario, whereas the LB approach provides an underestimated assessment of the actual dietary exposure.
Once the PDI was calculated, the risk due to CIT exposure is evaluated by the calculation of the hazard index (HI) using Equation 3.
Where the PTDI was set at 0.2 ug/kg (b.w.) per day for CIT consumption, according to the reference value established by EFSA [4]. The HI indicates the relationship between the daily intake of a contaminant and the likelihood of experiencing adverse effects as a result of its exposure. If the calculated HI is equal to or greater than 1, daily exposure to this contaminant may lead to adverse effects on human health.
The reviewed studies employed both positive and/or negative ionization modes [24, 38–40]. Preliminary studies by direct infusion of a 1 µg/mL standard solution indicated that both ESI modes provided detectable signals for CIT, showing higher values of signal-to-noise (S/N) in case of negative ionization mode [41]. Thus, CIT and its isotopically labelled internal standard were identified and quantified using ESI– with the following MRM transitions: 281.0 > 249.3, 281.0 > 205.0 m/z for CIT and 294.1 > 262.2 m/z for its internal standard. In the case of STG, higher sensitivity in case of positive ionization was observed. Then, scanning the first quadrupole (Q1) precursor ions of STG and its isotopically labelled internal standard were identified, corresponding to the [M + H]+ ion. Subsequently, the third quadrupole (Q2) was scanned to select two product ions. Thus, STG and its isotopically labelled internal standard were identified and quantified using the following MRM transitions: 325.0 > 281.0, 325.0 > 310.1 m/z for STG and 342.9 > 327.3 m/z for its internal standard. Ion source parameters, such as tube lens or CEs, or chromatographic conditions, such as the retention time, are specified in Table 1.
To identify the most effective methodology for the analysis of the target mycotoxins, three sample preprocessing methods commonly used were systematically evaluated and compared, namely QuEChERS, dilute and shoot, and SPE. To determine the most suitable sample preprocessing method, the following controls were prepared for each procedure: three reagent blanks, three urine blanks, three fortified reagent blanks, and three fortified urine samples. The fortified samples were spiked with CIT and STG at a concentration of 2 ng/mL. The acceptance criteria for the accuracy were established in a range from 70–120%, according to the criteria set in the Commission Implementing Regulation (EU) 2023/2782 [33].
First, direct analysis method was tested, a technique recognized for its simplicity and speed and widely used for multi-mycotoxin analysis methods [42, 43]. Although acceptable recoveries were found as depicted in Figure 1 (ranging from 74–91% and 89–102% for CIT and STG, respectively), a visual inspection of the chromatograms indicated that the S/N ratios were extremely low to be able to identify the analytes at the low concentration usually found in urine. This preprocessing step, although extremely simple, does not mitigate the MEs, leading to elevated LODs that make the method not suitable for the analysis of real samples. Thus, in order to enhance the sensitivity of the methodology, further purification and preconcentration step was required.
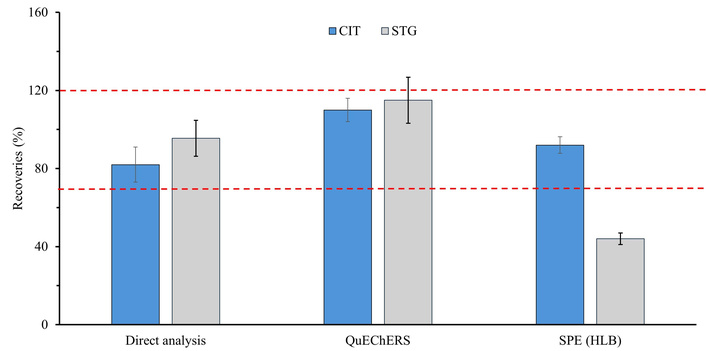
Comparison of recovery percentages for citrinin (CIT) and sterigmatocystin (STG) using three extraction methods: direct analysis, QuEChERS (Quick, Easy, Cheap, Effective, Rugged, and Safe), and SPE (solid-phase extraction) (Oasis HLB). Red doted points indicated minimum and maximum recovery acceptance criteria according to the European Commission 2023/915.
Then, in order to extract, preconcentrate, and purify the target compounds, an SPE technique was tested. HLB cartridges were employed due to their frequent use in the literature for the extraction of mycotoxins from urine samples [39]. The results obtained showed recoveries ranging 89–95% for CIT and ranging from 41–46% in case of STG. While the recoveries for CIT complied with the accuracy criteria established by the EU [33], the recovery values for STG were considerably lower. Thus, we evaluated the use of a QuEChERS-based methodology for mycotoxin extraction, which has been previously applied for multi-mycotoxin analysis in biological fluids [44]. The results showed recoveries ranging from 104 to 115% for CIT and from 102 to 125% in case of STG.
Recovery results for the extraction techniques are summarized in Figure 1. Direct analysis and QuEChERS-based method demonstrated recovery values according to the acceptance criteria. However, the spiked samples analysed by direct analysis showed S/N values of 70, whereas those treated by modified QuEChERS-based preparation reached 140 at the same concentration. Consequently, lower LODs and LOQs could be achieved using the modified QuEChERS preparation compared to the direct analysis methodology. This aim is especially important in case of biomonitoring studies due to the low concentration of the target analytes, allowing for a better assessment of the risk.
ME is generally produced by alterations in ionization efficiency caused by the simultaneous presence of co-eluting substances during analysis. These changes in ionization can affect the correct determination of the target analytes. In this regard, addressing the ME is crucial during the development and validation of LC-MS/MS methodologies. For the assessment, urine samples were spiked to achieve three concentration levels: CIT at 2.5 pg/mL and STG at 1.3 pg/mL; CIT at 50.0 pg/mL and STG at 25.0 pg/mL; and CIT at 500.0 pg/mL and STG at 125.0 pg/mL. The methodology outlined in the ‘Sample collection and preparation’ section was employed to treat the spiked samples. The ME was calculated as described in Equation 1, with an acceptance criterion set between 80% and 120% [35]. As shown in Table 2, CIT showed an enhancement of the signal in urine, assessing a ME of 111%, while in case of STG, a signal suppression was observed, obtaining a ME of 90%. Regarding the results obtained, the ME for both mycotoxins falls within the acceptance range set by the EU, indicating that no significant ME. Consequently, the quantification of CIT and STG was performed using internal standard calibration.
ME was obtained for CIT and STG using the QuEChERS-based method developed.
| Compound | Matrix | Slope | R2 | ME (%) |
|---|---|---|---|---|
| CIT | Internal standard | 0.66 | 0.99 | 111 |
| Urine | 0.73 | 0.99 | ||
| STG | Internal standard | 7.29 | 0.99 | 90 |
| Urine | 6.58 | 0.99 |
CIT: citrinin; ME: matrix effect, calculated as shown in Equation 1; QuEChERS: Quick, Easy, Cheap, Effective, Rugged, and Safe; R2: correlation coefficients; STG: sterigmatocystin.
The developed method for the determination of CIT and STG was validated by evaluating different performance characteristics, as previously mentioned in the methodology. First, the working range was established by assessing linearity using three calibration curves covering the full concentration interval (0.05 to 20 ng/mL for CIT and 0.025 to 5 ng/mL for STG). All calibration curves showed R2 > 0.99, with randomly distributed residuals not exceeding 20% at any point, confirming adequate linearity within the analysed concentration ranges.
Table 3 shows some of the validation parameters for the target analytes. Trueness and precision were assessed through the analysis of spiked blank samples at three concentration levels within the calibration range. Specifically, concentrations of 2.5, 50.0, and 500.0 pg/mL were used for CIT, and 1.3, 25.0, and 125.0 pg/mL for STG. Recoveries ranged from 103.4 to 108.0% for CIT and from 96.8 to 108.2% for STG. Furthermore, precision was evaluated for both RSDr and RSDWR conditions. As shown in Table 3, the RSDr and RSDWR values were between 0.8% and 8.7%, being well below the regulatory limits (20% and 25%, respectively) at all concentration levels, indicating that the method meets the required precision criteria. Additionally, selectivity and specificity were also assessed through the analysis of several blank samples and blank reagents. This study revealed no interfering signals higher than 30% of the LOQ signal at the retention times of CIT or STG, confirming the method’s effectiveness for selective and specific detection of both analytes [35]. Finally, LOD was determined as three times the standard deviation of the response obtained from ten independent sample blanks and LOQ was set as 3 times the LOD, yielding instrumental LODs of 0.015 ng/mL for CIT and 0.005 ng/mL for STG, and LOQs of 0.05 ng/mL for CIT and 0.015 ng/mL for STG. Considering the 20-fold preconcentration, the experimental LODs were 0.75 pg/mL for CIT and 0.25 pg/mL for STG, and sample LOQs were 2.5 pg/mL for CIT and 0.75 pg/mL for STG. In summary, the results demonstrate that the proposed methodology is highly sensitive, precise, and accurate for the determination of CIT and STG in human urine, meeting the criteria established in Commission Implementing Regulation (EU) 2023/2782 [33].
Analytical parameters obtained during validation step for CIT and STG.
| Compound | Concentration (pg/mL) | Accuracy recoveries (%) | Precision | |
|---|---|---|---|---|
| RSDr (%) | RSDWR (%) | |||
| CIT | 2.5 | 108.0 ± 2.7 | 3.3 | 2.5 |
| 50.0 | 103.4 ± 4.3 | 3.8 | 4.1 | |
| 500.0 | 102.8 ± 1.5 | 1.1 | 1.4 | |
| STG | 1.3 | 96.8 ± 7.6 | 8.7 | 7.8 |
| 25.0 | 108.2 ± 6.9 | 6.5 | 6.4 | |
| 125.0 | 101.8 ± 0.8 | 1.0 | 0.8 | |
CIT: citrinin; RSDr: intra-day relative standard deviation; RSDWR: inter-day relative standard deviation; STG: sterigmatocystin.
Due to the absence of reference material of urine samples for CIT and STG, method trueness was also evaluated through the use of blind samples. This approach allowed for indirect verification of the performance of the developed method, assessing its capability to accurately detect and quantify mycotoxins in a complex biological matrix such as urine. Comparison between experimental and theorical values was assessed through the calculation of the coefficient of variation (CV) (%) and z-score. As can be observed in Table 4, the experimental concentrations were in close agreement with the theorical values, with CV (%) between 1% and 16%. Additionally, a z-score value below 2 reveals satisfactory performance. In this case, values ranging from 0.011 to 0.137 were obtained, thereby confirming the reliability of the analytical method for application in human biomonitoring studies.
Statistical analysis of the blind samples.
| Sample | Compound | Concentration (pg/mL) | Recovery (%) | CV (%) | z-score | |
|---|---|---|---|---|---|---|
| Added | Experimental | |||||
| 1 | CIT | 100 | 110 | 110 | 10 | 0.046 |
| STG | 25 | 29 | 116 | 16 | 0.011 | |
| 2 | CIT | 200 | 201 | 101 | 1 | 0.021 |
| STG | 50 | 55 | 111 | 11 | 0.137 | |
CIT: citrinin; CV: coefficient of variation; STG: sterigmatocystin.
Once the validation of the methodology had been developed, a total of 20 urine samples were analysed using the proposed methodology. In case of CIT, 13 of the 20 urine samples analysed (65%) had non-detectable (n.d.) levels of CIT, 1 (5%) exhibited detectable but non-quantifiable concentrations, and 6 (30%) showed quantifiable concentrations (see Figure 2A, 2B). In case of STG, 19 samples (95%) presented n.d. levels, while 1 sample (5%) showed detectable concentrations (see Figure 2C).
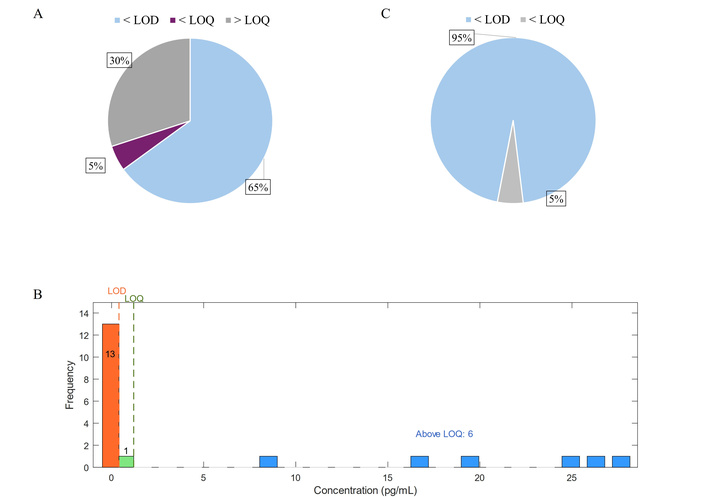
Detection frequency of citrinin (A) and sterigmatocystin (C) and concentration profiles (B) of citrinin in the analyzed cohort.
Among the 20 urine samples analysed, CIT concentrations ranged from n.d. levels to 28 pg/mL. Quantifiable samples showed uncorrected concentrations between 9 and 28 pg/mL with an average concentration of 21 pg/mL and a median value of 22 pg/mL (see Table 5). To account for differences in urine dilution, CIT levels were normalized to Crea concentration. After Crea correction, CIT concentrations ranged from n.d. to 30 pg/mg Crea, with an average of 22 pg/mg Crea and a median value of 24 pg/mg Crea. However, in case of STG concentrations, sample levels ranged from n.d. levels to values below the LOQ, also indicating a very low presence of this compound in the analysed samples. CIT and STG concentrations found in the urine samples analysed are detailed in Table S1.
Concentration of CIT and STG was determined in urine samples.
| Compound | Uncorrected (pg/mL) | Corrected (pg/mg Crea) | ||||
|---|---|---|---|---|---|---|
| Range | Mean ± SD* | Median* | Range | Mean ± SD* | Median* | |
| CIT | n.d.–28 | 21 ± 7 | 22 | n.d.–30 | 22 ± 8 | 24 |
| STG | n.d.–< LOQ | - | - | n.d.–< LOQ | - | - |
*: mean and median calculations have been done only using samples with levels above the LOQ. CIT: citrinin; Crea: creatinine; LOQ: limit of quantification; n.d.: non-detectable; SD: standard deviation; STG: sterigmatocystin.
Table 6 compares the results obtained in this study with those reported by previous studies conducted in other countries. Due to the scarcity of data available on the occurrence of CIT and STG in human urine, direct comparison of the obtained results with literature values is limited. This highlights the significance of this study and underscores the need for further research to advance the detection and biomonitoring of these mycotoxins in biological matrices.
CIT concentration obtained in the most relevant studies conducted in other countries and in the present study.
| Uncorrected (pg/mL) | n | Country | Reference | |||
|---|---|---|---|---|---|---|
| Average (pg/mL) | SD | LOD (pg/mL) | Occurrence (%) | |||
| 270 | 480 | 20 | 55 | 154 | Bangladesh 1 | [45] |
| 60 | 70 | 20 | 92 | 70 | Bangladesh 2 | [38] |
| 720 | 4,620 | 62 | 40 | 50 | Bangladesh 3 | [46] |
| 5,960 | 27,430 | 3 | 65 | 120 | Nigeria | [39] |
| 77 | 52 | 70 | 80 | 10 | Turkey | [22] |
| 440 | 210 | 140 | 72 | 50 | Tunisia | [40] |
| 30 | 20 | 20 | 82 | 50 | Germany | [38] |
| 36 | 29 | 20 | 30 | 100 | Germany | [19] |
| 31 | 103 | 2 | 72 | 155 | Belgium | [42] |
| 58 | 349 | 2 | 59 | 239 | Belgium | [42] |
| 26 | 29 | 1 | 59 | 32 | Belgium | [20] |
| 61 | 35 | 20 | 98 | 50 | Czech Republic | [47] |
| 21 | 7 | 0.75 | 30 | 20 | Spain | This study |
CIT: citrinin; LOD: limit of detection; n: number of samples; SD: standard deviation.
The results obtained in this study are consistent with previous biomonitoring research conducted across Europe. Several studies in European countries have reported occurrence rates ranging from 30% to 98% [19, 20, 38, 42, 47], which aligns with the 30% occurrence observed in the present study. Specifically, the urinary CIT levels detected in urine samples (21 ± 7 pg/mL) are highly comparable to those reported by Huybrechts et al. [20] in a group of 32 Belgian volunteers, where concentrations reached 26 ± 29 pg/mL. Similarly, two separate studies in the German population showed mean CIT levels of 30 ± 20 pg/mL and 36 ± 29 pg/mL [19, 38], further supporting the consistency of our findings within the European context. In contrast, studies conducted in non-European countries report significantly higher internal exposure to CIT. Average urinary concentrations in these regions range from 60 to 5,960 pg/mL [22, 38–40, 45, 46]. The highest levels were recorded in Nigeria by Šarkanj et al. [39], where an analysis of 120 samples revealed an average concentration of 5,960 ± 27,430 pg/mL. Significant exposure was also noted in countries like Bangladesh and Tunisia, with averages reaching up to 720 and 440 pg/mL, respectively [38, 40, 45, 46].
This geographical disparity highlights the impact of different food safety standards. The lower concentrations found in European populations likely reflect the efficacy of the EFSA regulations and the strict maximum limits established for CIT in food supplements. The robustness of the European food system, characterized by stringent agricultural practices and a comprehensive monitoring network, appears to play a crucial role in limiting dietary exposure to mycotoxins compared to other global regions where environmental conditions or less restrictive regulations may favor higher contamination levels.
The estimated PDI values, presented in Table 7, were calculated for the different scenarios using Equation 2 and the corrected concentrations of the samples analysed. We assumed that samples with CIT levels below the LOD contain either zero (LB) or 0.8 pg/mL (corrected LOD) (UB), and the samples with CIT levels below the LOQ contain either zero (LB) or 2.7 pg/mL (corrected LOQ) (UB) of the contaminant. Exposure due to each toxin and every scenario was calculated using the average and P95 corrected concentration found in urine. The statistical data and specific concentrations used for the PDI calculations are detailed in Table S2. Previous studies have estimated daily CIT intake from dietary exposure to range between 0.6 and 16.5 ng/kg (b.w.) per day [7]. These results are consistent with the PDI obtained in the present study, where values ranged from 0.767 to 3.215 ng/kg (b.w.) per day (see Table 7). Following the estimation of daily CIT intake and considering the PTDI of 0.2 μg/kg (b.w.) per day established by EFSA, the HI was calculated for all scenarios. Figure 3 shows the HI value calculated for the different scenarios, obtaining values ranging from 0.004 to 0.016. All HI values calculated were below 1, suggesting there is no risk to kidney function due to CIT exposure, even in a pessimistic scenario (see Figure 3).
Estimated daily intake was calculated from CIT concentration found in samples through 4 different statistical scenarios.
| Estimated daily intake [ng/kg (b.w.) per day] | ||||
|---|---|---|---|---|
| Compound | UB PS | LB PS | UB RS | LB RS |
| CIT | 3.215 | 3.215 | 0.846 | 0.767 |
CIT: citrinin; LB: lower bound; PS: pessimistic scenario; RS: realistic scenario; UB: upper bound.
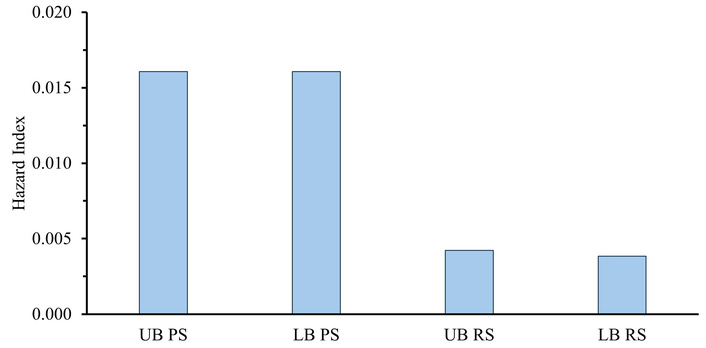
Hazard index (HI) calculated from citrinin (CIT) concentrations found in urine for different statistical exposure scenarios. LB: lower bound; PS: pessimistic scenario; RS: realistic scenario; UB: upper bound.
Regarding STG, no quantifiable levels were detected in any of the urine samples analysed. As a result, the estimated PDI and HI could not be calculated, and exposure to STG in this population can be considered as negligible.
It is important to note that the risk assessment in this study was conducted on a relatively small cohort (n = 20). Consequently, the conclusions drawn from these preliminary exposure findings should be interpreted with caution. Nevertheless, this initial assessment provides valuable insights into exposure risks, and the observed trends are in good agreement with previously published biomonitoring studies.
In this study, a robust and validated analytical methodology has been developed for the determination of CIT and STG in human urine, employing QuEChERS extraction followed by UHPLC-MS/MS analysis with internal standard calibration. MS/MS parameters were systematically optimized. The method has been validated according to established analytical criteria, fulfilling all the criteria established in the Commission Implementing Regulation (EU) 2023/2782, demonstrating to be reliable, sensitive and selective for the quantification of CIT in urine samples, making it suitable for monitoring low levels of this mycotoxin in human populations.
The method was applied to monitor CIT and STG levels in 20 urine samples. STG was detected in only one sample, possibly due to the limitations of the method in detecting conjugated STG metabolites. CIT was detected in six of the 20 samples analysed, showing an occurrence of 30%, with concentrations ranging from 9 to 28 pg/mL. However, a significant limitation of the method is that it does not include the analysis of CIT metabolites. Since mycotoxins undergo metabolic transformations after ingestion, measuring only the parent compound may lead to an underestimation of total exposure. In the case of STG, it is mainly present in conjugated forms. As no hydrolysis step was performed in the methodology, the amount of free STG in the samples was very low, preventing its quantification and exposure evaluation.
Although the risk assessment obtained using the values found revealed that exposure levels were well below the PTDI established by EFSA, indicating that there is no significant nephrotoxic risk for the studied population. The results also reflect the effectiveness of current food safety initiatives aimed at minimizing exposure to harmful contaminants and protecting public health. However, it is important to note that the risk assessment in this study was conducted on a relatively small cohort (n = 20). Consequently, the conclusions drawn from these preliminary exposure findings should be interpreted with caution. Nevertheless, this initial assessment provides valuable insights into exposure risks, and the observed trends are in good agreement with previously published biomonitoring studies. The limitations observed in the present study and in previous ones demonstrate the necessity of developing more biomonitoring methodologies, especially in case of STG, where the data available regarding metabolism and exposure is still very scarce.
a.u.: arbitrary units
ACN: acetonitrile
CEs: collision energies
CIT: citrinin
Crea: creatinine
CV: coefficient of variation
DH-CIT: dihydrocitrinone
EFSA: European Food Safety Authority
ESI: electrospray ionization
HCOOH: formic acid
HI: hazard index
IAC: immunoaffinity column
LB: lower bound
LC-MS/MS: liquid chromatography coupled with tandem mass spectrometry
LOD: limit of detection
LOQ: limit of quantification
MeOH: methanol
MEs: matrix effects
MRM: multiple reaction monitoring
MS/MS: tandem mass spectrometry
n.d.: non-detectable
PDI: probable daily intake
PTDI: provisional tolerable daily intake
QuEChERS: Quick, Easy, Cheap, Effective, Rugged, and Safe
R2: correlation coefficients
RSDr: intra-day relative standard deviation
RSDWR: inter-day relative standard deviation
S/N: signal-to-noise
SD: standard deviation
SPE: solid-phase extraction
STG: sterigmatocystin
UB: upper bound
UHPLC-MS/MS: ultra-high-performance liquid chromatography coupled with tandem mass spectrometry
The supplementary tables for this article are available at: https://www.explorationpub.com/uploads/Article/file/1010176_sup_1.pdf.
PPP: Formal analysis, Investigation, Methodology, Resources, Visualization, Validation, Writing—original draft, Writing—review & editing. AMM: Formal analysis, Validation, Visualization, Writing—original draft. DPG: Conceptualization, Investigation, Visualization, Methodology, Supervision, Writing—review & editing. All authors read and approved the submitted version.
The authors declare that they have no known competing financial interests or personal relationships that could have appeared to influence the work reported in this paper.
The study was conducted in accordance with the Internal Regulations of the Ethics Committee (2024-OTRO-3210712) for Research of the University of Valencia (CEC-UV) and the Declaration of Helsinki.
Written informed consent was obtained from all participants.
Not applicable.
The raw data supporting the conclusions of this manuscript will be made available by the authors, without undue reservation, to any qualified researcher.
This work has been supported by the Conselleria d’Educació, Universitats i Ocupació from Generalitat Valenciana project CIAICO2022/217. Project PID2023-148947OB-I00 and PID2024-162569OB-I00 were financed by MICIU/AEI/10.13039/501100011033 and by FEDER, UE. Additionally, the authors acknowledge the support of the predoctoral contract grant PRE2024-002638. The funders had no role in study design, data collection and analysis, decision to publish, or preparation of the manuscript.
© The Author(s) 2026.
Open Exploration maintains a neutral stance on jurisdictional claims in published institutional affiliations and maps. All opinions expressed in this article are the personal views of the author(s) and do not represent the stance of the editorial team or the publisher.
Copyright: © The Author(s) 2026. This is an Open Access article licensed under a Creative Commons Attribution 4.0 International License (https://creativecommons.org/licenses/by/4.0/), which permits unrestricted use, sharing, adaptation, distribution and reproduction in any medium or format, for any purpose, even commercially, as long as you give appropriate credit to the original author(s) and the source, provide a link to the Creative Commons license, and indicate if changes were made.



View: 1363
Download: 30
Times Cited: 0
Olga Pardo, Francesc A. Esteve-Turrillas
Clara Ochoa-Esteso ... María Jesús Lerma-García
Daniel Gallart-Mateu
Gabriel Mustatea ... Elena L. Ungureanu
Serkan SUGEÇTİ
Andrea Monsalve-Vidal, Daniel Gallart-Mateu
Ayodeji Johnson Ajibare ... Abraham Olufemi Asuku


