Original Article

Affiliation:
Department of Food Science and Technology, University of Kashmir, Srinagar 190006, India
Email: Hilalpunoo143@gmail.com
ORCID: https://orcid.org/0000-0001-5150-096X
Affiliation:
Department of Food Science and Technology, University of Kashmir, Srinagar 190006, India
Email: Ratherjahangir1515@gmail.com
ORCID: https://orcid.org/0000-0003-0701-5478
Affiliation:
Department of Food Science and Technology, University of Kashmir, Srinagar 190006, India
Explor Foods Foodomics. 2023;1:206–220 DOI: https://doi.org/10.37349/eff.2023.00016
Received: June 15, 2023 Accepted: August 14, 2023 Published: October 29, 2023
Academic Editor: Fernanda Mozzi, CERELA-CONICET, Argentina
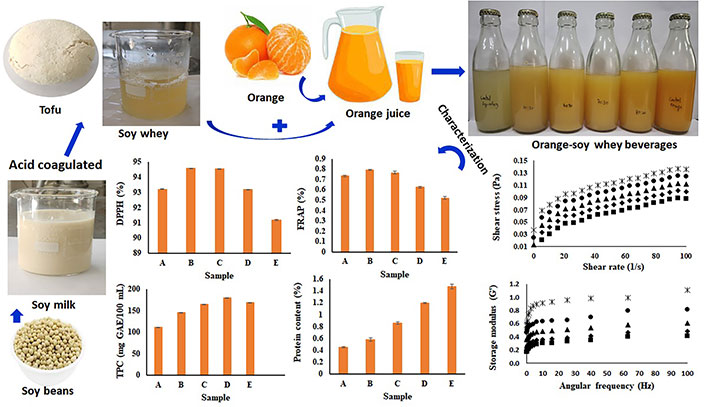
Aim: Soy whey is a byproduct of tofu production and is being discarded after tofu preparation. However, soy whey is a rich source of phytochemicals, minerals, and protein. The present study was conducted to utilize soy whey for the development of nutraceutical-rich orange juice beverages.
Methods: The soy whey and orange juice were produced and beverage samples were developed from them. The samples were evaluated for physicochemical, rheological, antioxidant, and sensory properties to evaluate the optimum percentage of soy whey that can be utilized for beverage development.
Results: The protein content increased from 0.45% to 1.65% with an increase in soy whey from 0% to 50%. The pH of the beverage samples was in the range of 4.27–4.77 with the total soluble solids (TSSs) of 5.75–6.0 for various beverage samples. The lightness (L*), redness (+a*), and yellowness (+b*) of beverage samples range between 31.57–49.04, 1.21–0.54, and 25.37–39.63 respectively. The vitamin C content of the beverage samples was 56.30 mg/L, 52.75 mg/L, 36.97 mg/L, 26.35 mg/L, and 22.87 mg/L for A, B, C, D, and E beverages respectively. The 1, 1-diphenyl-2-picrylhydrazyl (DPPH), ferric reducing antioxidant power (FRAP), reducing power ranges of beverage samples range between 91.2–96.23%, 0.521–0.994%, and 0.204–0.859% respectively, and total phenolic content (TPC) ranges between 112 mg gallic acid equivalents (GAE)/100 mL and 181 mg GAE/100 mL of beverage samples. The beverage samples presented a shear thinning property with a flow index (n) ranging between 0.2371–0.8214. The consistency coefficient of the beverage samples ranges between 0.0405 Pa∙Sn and 0.0041 Pa∙Sn. The control, 20%, and 30% soy whey-containing beverage samples showed higher sensory properties.
Conclusions: The beverage samples with 0%, 20%, and 30% showed improved DPPH and FRAP percent activity and higher overall acceptability compared to 40% and 50% soy whey-containing beverage samples.
With the current augmentation of nutritional, healthy, and green dietary ideas, plant protein and phytochemical-rich drinks with multi-therapeutic benefits are increasingly gaining attention, and the development of these drinks is need of hour. The beverage is the drink used to provide energy to the body and provide a refreshing effect [1]. The consumer’s demand for refreshing drinks with incorporated natural phytochemical ingredients is also increasing day by day. The fruit-based beverages with other essential components are a proficient way to produce nutraceutical-rich products like beverages [2, 3]. Orange juice is a rich source of vitamins, minerals, organic acids, and other essential bioactive components like carotenoids, flavonoids, and other phenolics [4]. The essential components will not only provide nutraceutical-rich drinks but these components also enhance the shelf life of the developed beverage owing to their antioxidant and antibacterial activities [5, 6].
The soybean (Glycine max) contains 40% protein, 20% lipids, 35% carbohydrates, and 5% mineral contents, besides soybeans are rich sources of essential fatty acids, vitamins, flavonoids, isoflavones, phenolic acids, and saponins [7]. The soybean-derived food products have numerous biological activities like anti-cancer, anti-hypertensive, anti-diabetic, anti-obesity, and antioxidant properties, among various other health benefits [8]. The soy protein has also been shown to protect the anthocyanin components during passage through the upper digestive tract for consequent colonic delivery [9, 10]. The soy whey as a by-product of tofu production in the soy processing industries is being discarded, however, is a rich source of proteins, carbohydrates, minerals, vitamins, and phytochemicals as reported by Chua and Liu [11] and Chourasia et al. [12]. Hence soy whey has been exploited nowadays for incorporation in numerous food industrial sectors for enhancing the dietary quality of the food products. Soy whey is a rich source of bioactive components like daidzein, genistein, epigenistin, and glycetin [12]. Consumers are further interested in drinks with proteins of plants owing to their potential biological advantages [13]. Owing to the presence of these essential components, soybean-derived food products have high health-related activities [8]. Additionally, soy isoflavones, which are present in substantial amounts in soybean whey and milk, can play a prominent role in radical scavenging activity, reducing cancer risks, and relieving osteoporosis and menopausal symptoms in women. The isoflavone aglycones have been reported to be absorbed directly from the intestinal epithelium without the residence time to hydrolyze the glycoside moiety. These are known to show marked biological activities than isoflavone glycosides [14].
The present study was conducted to valorize soy whey by incorporation in fruit juices, to develop fortified beverages which are gaining the consumer’s attention nowadays owing to their biological activities.
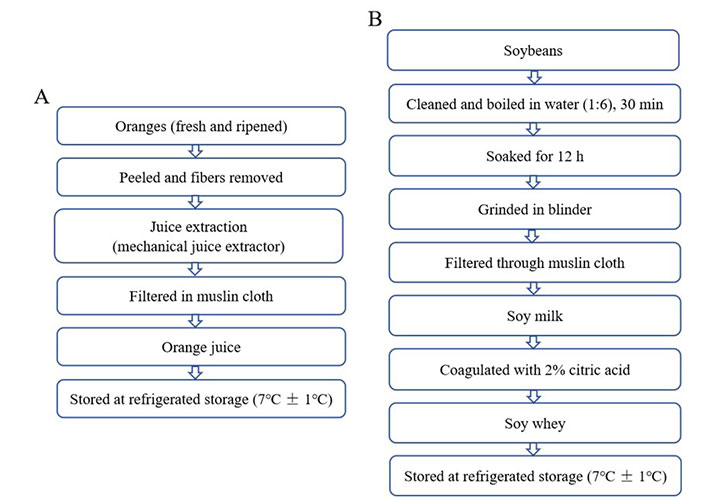
The orange fruit (Citrus sinensis) and the soybeans (Glycine max) were purchased from the local market of Hazratbal Srinagar. The fruits were washed and cleaned before further processing, soybeans were cleaned and the foreign ingredients were removed manually before the development of whey.
The soy whey was developed similarly to the method of Kumar and Dhingra [15]. The development of orange juice and soy whey is shown in Figure 1. Briefly, the cleaned soybeans were boiled in boiling water in a 1:6 ratio for 30–35 min to mask off the beany flavor of soybeans. The soybeans were then kept for soaking in the same water for 12 h and then grinded in the blender. The blend was filtered through muslin cloth and the soy milk was filtered thrice. The soymilk was treated with a 2% citric acid solution, the coagulant (tofu) was separated and whey was collected. The collected soy whey was filtered again, cooled, and stored (7°C ± 1°C) for further analysis.
The oranges were washed with water, peeled, and the juice was extracted using a juice extractor similar to the method of Tanwar et al. [1]. The juice was strained through the muslin cloth. The juice was then kept at refrigerated storage conditions (7°C ± 1°C) until used.
Different formulations of soy whey-orange juice beverages were prepared by heating whey at 45°C with the addition of sugar and orange juice, as shown in the flow chart similar to the method of Yadav et al. [16]. After proper mixing, it was filtered through clean muslin cloth to obtain a whey-orange beverage, filled into a glass bottle of 250 mL capacity and it was crown corked. After crown corking, it was heated at 85°–90°C for 15 min and immediately cooled and subjected to sensory evaluation to find out the best formulation which was stored in refrigeration and ambient temperature for further study.
Four different combinations of soy whey and orange juice were taken for the development of beverages. The sugar content of all the beverage samples was kept constant (5%) for all the samples. The beverages were coded as A, B, C, D, and E and representing A= 0 mL soy whey, 100 mL orange juice, B = 20 mL soy whey, 80 mL orange juice, C = 30 mL soy whey, 70 mL orange juice, D = 40 mL soy whey, 60 mL orange juice and E = 50 mL soy whey, 50 mL orange juice.
The protein content of beverage samples was estimated by the Kjeldahl method similar to that of Dai et al. [14].
The pH of the samples was measured by using a digital pH meter (LABMAN LMPH-12, India), similar to the method of Rather et al. [17]. The total soluble solids (TSSs) in all samples were determined using a handheld refractometer (ATAGO-0258999, Japan).
The color of the sample was determined using Hunter color Lab (Flex EZ Model No. 45/0). The lightness (L*), redness-greenness (a*), and yellowness-blueness (b*) were determined in triplicates similar to the method of Rather et al. [18].
The vitamin C of the beverage samples was measured using a simple redox titration method using iodine solution as reported by Lee [19]. In this 0.02 mol/L of potassium iodide was made and 2.6 g iodine was added making it to the desired value using distilled water and starch solution was also made using 0.25 g of starch and adding it to 50 mL boiling water and using it when it is cooled. The vitamin C content of the beverage samples were calculated as Eqn. 1 and Eqn. 2:
Eqn. 1:
V = volume of iodine solution;
N = normality of iodine solution;
C = conversion factor for converting mL to grams (for vitamin C, it is 0.086 g/mL)
Eqn. 2:
Rheological properties are important analytical parameters for the analysis of beverage samples, as the rheology of a beverage has a direct impact on the consumer acceptability of the beverage. The rheological properties determined were flow behavior and frequency sweep.
The flow behavior of beverage samples was determined at 25°C within the angular frequency of 0.1–100 rad/s similar to the method of Rather et al. [17] and Showkat et al. [20].
Dynamic rheology is an essential aspect of most liquid and semi-liquid food products to quantify the behavior of foods [13]. The viscoelastic nature of beverage samples was obtained by dynamic oscillatory measurements similar to the method of Rather et al. [17, 18] and with minor alterations. All film-forming solutions were analyzed by Anton Par Rheometer (Physica MCR 101). For every sample, a 2 mL solution was used for the analysis. The small-amplitude sweep test from 0.1% to 20% strain percent with 0.1 Hz frequency was used to determine linear viscoelastic region. From the amplitude test, a strain amplitude of 1% was selected to accomplish dynamic oscillatory tests for all samples. The dynamic frequency test for all beverage samples was then determined within (0.1–100 rad/s) at 25°C. The parameters to be determined were storage modulus/elastic modulus (G’) and loss modulus/viscous modulus (G”).
The antioxidant activities of the beverage samples were done by determining the 1, 1-diphenyl-2-picrylhydrazyl (DPPH), ferric reducing antioxidant power (FRAP), and reducing power as follows.
Each beverage sample (3 mL) was mixed with 1 mL of 0.1 mmol/L DPPH ethanolic solution. The mixture was then shaken enthusiastically and left to stand for 30 min in the dark, and the absorbance was taken at 517 nm using an ultraviolet-visible (UV-vis) spectrophotometer (Hitachi, U-2900). The percent DPPH activity was calculated as Eqn. 3:
Eqn. 3:
The FRAP analysis was determined by using the procedure of Bhat et al. [21] with slight alterations. A FRAP solution containing acetate buffer (pH 3.6), 20 mmol/L ferric chloride solution, and 10 mmol/L TPTZ in 40 mmol/L HCl solution in a 10:1:1 proportion was prepared. Then 900 µL warm (37°C) FRAP solution was added to the 100 µL beverage sample in centrifuge tubes. The tubes were then vortexed and incubated for 40 min at 37°C and the reduction was then monitored by estimating the absorbance at 595 nm using UV-vis Spectrophotometer.
Total phenolics were measured colorimetrically by the Folin-Ciocalteu method similar to that of Ashari et al. [22] with minor alterations. Briefly, 300 μL of beverage samples were mixed with 1.5 mL of Folin-Ciocalteu reagent (formerly diluted 10 fold) and allowed to stand at 25°C for 5 min. Then 3 mL sodium bicarbonate solution (60 g/L) was added to the mixture and samples were incubated for 90 min at 25°C. Then absorbance was measured using a UV-vis spectrophotometer at 725 nm. The total phenolic content (TPC) was estimated using the calibration curves obtained from estimating the absorbance of the gallic acid standard at 5 concentrations (25 µg/mL, 50 µg/mL, 75 µg/mL, 100 µg/mL, 125 µg/mL). The results were considered as gallic acid equivalents (GAE)/100 mL of beverage samples.
The reducing power of the beverage samples was determined similarly to the method of Dai et al. [14]. Briefly, a 1 mL beverage sample was mixed with an equal volume of 0.2 mol/L phosphate buffer (pH 6.6) and 1% potassium ferricyanide. The sample was incubated for 20 min at 50°C and subsequently, 2.5 mL of tricarboxylic acid (TCA; 10%) was added and the samples were centrifuged for 10 min at 5,000 rpm. Then 4 mL of supernatant was mixed with 0.5 mL of 0.1% ferric chloride solution and left for 10 min. The absorbance was taken at 700 nm using a UV-vis spectrophotometer.
The sensory evaluation of the beverage samples was conducted by senior faculty members and research scholars of the Department of Food Science and Technology, University of Kashmir. The 50 mL of each beverage sample was given to each of the 15 members for the sensory evaluation. Sensory attributes such as color, taste, acidity, aroma, and overall acceptability were evaluated during the sensory evaluation of soy whey-based orange beverages. The nine-point hedonic scales include various scales of grading i.e. 9 = liked extremely, 8 = liked very much, 7 = liked moderately, 6 = liked slightly, 5 = neither liked nor disliked, 4 = disliked slightly, 3 = disliked moderately, 2 = disliked very much, 1 = disliked extremely.
All the tests were performed in triplicates and the values are stated as the mean of replicates. The analysis of variance [one-way analysis of variance (ANOVA)] was done by using SPSS statistics software (v.16, SPSS Inc., Chicago, IL, USA). The significance of the data points was identified by post hoc Duncan’s test at a significance level of 5% (P < 0.05).
Fruit juices are poor sources of protein and hence can be enriched with plant-based proteins to enhance their nutritional values [16]. The protein content of the beverage samples is shown in Figure 2. The control sample (100% orange juice) contains 0.45% protein content, with an increase in the concentration of soy whey from 20% to 50% the protein content increases from 0.58% to 1.65%. Kumar and Dhingra [15] reported a 3.0% protein content of soy while Chua and Liu [11] reported protein content of 1.33% of the soy whey produced during the tofu preparation. Hence with the addition of soy whey content, the protein content of the beverage increases. Yadav et al. [16] reported protein content of 75–80 ppm and 74–76 ppm for mango and pineapple beverages respectively.
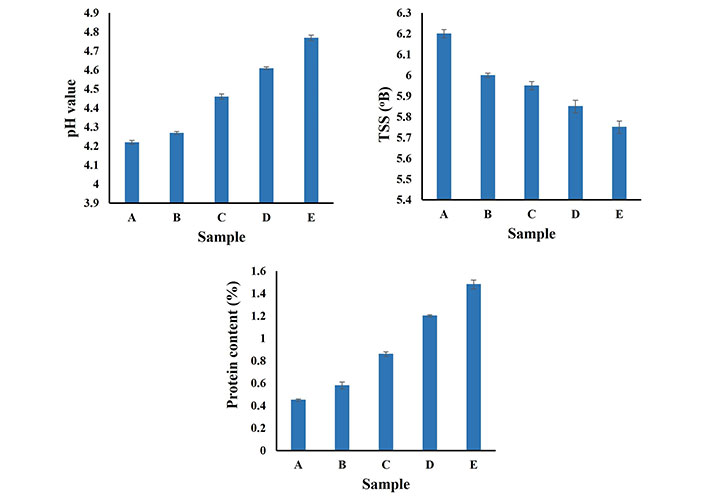
pH, TSS, and protein content of the beverage samples. A: 0 mL soy whey, 100 mL orange juice; B: 20 mL soy whey, 80 mL orange juice; C: 30 mL soy whey, 70 mL orange juice; D: 40 mL soy whey, 60 mL orange juice; E: 50 mL soy whey, 50 mL orange juice. Lowercase letters indicate differences between values
The pH value of orange-based beverages incorporated with soy whey is shown in Figure 2. From Figure 2, it is clear that by increasing the concentration of soy whey in orange beverages the pH increases. Ribeiro et al. [23] reported a pH of 5.45 for papa-whey beverage samples with 30% papa pulp contents and a pH of 5.44 with 35% pulp content. Additionally, Ribeiro et al [23] reported pH values of 5.45 and 5.18 for mango-soy-based beverages with mango pulp of 30% and 35% respectively. Yadav et al. [16] reported pH values ranging from 4.0 to 4.8 for soy whey and soy milk-incorporated mango and pineapple juice beverages. Similarly, Rohit et al. [24] reported pH values in the range of 4.37–4.97 for kiwi fruit-whey beverages. Sakhale et al. [25] have reported pH values of 6.05 and 5.56 for soy milk mango juice beverages with mango juice content of 20% and 40% respectively.
The TSS of the soy whey-incorporated orange beverages is shown in Figure 2. The TSS of orange-based beverages incorporated with soy whey decreases with an increase in the concentration of soy whey. Yadav et al. [16] reported TSS values ranging from 11 °B to 16 °B for soy whey and soy milk-incorporated mango and pineapple juice beverages. The TSS of kiwi fruit-whey beverage ranges from 8.88 °B to 16.53 °B, as reported by Rohit et al. [24]. The TSS of papa-soy-based beverages was 9.17 °B and 10.0 °B for soy-based beverages with 30% and 35% mango pulp respectively [23].
The color parameters (L*, a*, and b*) values of the beverage samples are shown in Table 1. With the increase in the concentration of soy whey from 0% to 50%, the L* value of the beverage samples increases from 31.57 to 49.09. This increase in the L* value of the beverages is owing to the higher lightness of the whey compared to the orange juice and due to the dilution effect, so by increasing the whey concentration, the L* value increases significantly (P < 0.05). Vieira et al. [26] reported higher L* values of goat whey orange juice ranging between 79 and 80. García‐Pérez et al. [27] reported that the L* value of the yogurt increases with the addition of the fiber which may be owing to the higher absorption of water by the fiber which increases the L* value of the beverage samples. Hence the higher the water content in the beverages, the higher the lightness of the beverage samples.
Instrumental color analysis of beverage samples
| Treatment | Color parameter | ||
|---|---|---|---|
| L* | a* | b* | |
| A | 31.57 ± 0.02a | 1.21 ± 0.05e | 39.63 ± 0.21e |
| B | 35.46 ± 0.10b | 1.02 ± 0.02d | 37.12 ± 0.19d |
| C | 37.67 ± 0.04c | 0.70 ± 0.05c | 31.22 ± 0.31c |
| D | 42.30 ± 0.10d | 0.65 ± 0.02b | 28.25 ± 0.05b |
| E | 49.04 ± 0.01e | 0.54 ± 0.03a | 25.37 ± 0.11a |
The data is presented as mean ± standard deviation (n = 3). For every parameter, the data with small letters as superscripts are significantly different (P < 0.05). A: 0 mL soy whey, 100 mL orange juice; B: 20 mL soy whey, 80 mL orange juice; C: 30 mL soy whey, 70 mL orange juice; D: 40 mL soy whey, 60 mL orange juice; E: 50 mL soy whey, 50 mL orange juice
The a* value of the samples ranges between 1.21 and 0.65 and with an increase in soy whey percentage the a* value decreases significantly (P < 0.05). Vieira et al. [26] reported a* value in the range of 1 to –2.7 for goat whey orange juice beverages. The a* of the control beverage samples was highest compared to the beverages with incorporated soy-whey. This may be owing to higher carotenoid contents in orange juice.
The b* value indicates yellowness or blueness, and the positive value indicates yellowness. From Table 2, it is clear that with an increase in the concentration of soy-whey, the b* values decrease from 39.63 to 25.37. Similar reports were also reported by Vieira et al. [26], in their study the b* value of the goat whey orange juice beverage was reported to be in the range of 5.6–29. This may be owing to the higher yellow color of the orange juice compared to the soy whey. Fagnani et al. [28] reported that carotenoids are the chief components liable for the characteristic yellowish color in orange juice-containing beverages. Hence increasing the concentration of soy whey lowers the yellowness and increases the lightness values of the beverage samples. A similar decrease in the color values was also reported by Yadav et al. [16] for soy-based beverages with incorporated pineapple and mango juice.
Power law modeling parameters of shear stress and shear rate relationship of control and soy whey-treated beverages
| Sample id | Parameter | ||
|---|---|---|---|
| K (Pa∙Sn) | n | r2 | |
| A | 0.0534 ± 0.14e | 0.1948 ± 0.04a | 0.9815 ± 0.23c |
| B | 0.0405 ± 0.21d | 0.2371 ± 0.13b | 0.9914 ± 0.06d |
| C | 0.0266 ± 0.03c | 0.3126 ± 0.05c | 0.9987 ± 0.22e |
| D | 0.0068 ± 0.10b | 0.6269 ± 0.21d | 0.9492 ± 0.05a |
| E | 0.0041 ± 0.15a | 0.8214 ± 0.02e | 0.9654 ± 0.03b |
The data is presented as mean ± standard deviation (n = 3). For every parameter, the data with small letters as superscripts are significantly different (P < 0.05). A: 0 mL soy whey, 100 mL orange juice); B: 20 mL soy whey, 80 mL orange juice; C: 30 mL soy whey, 70 mL orange juice; D: 40 mL soy whey, 60 mL orange juice; E: 50 mL soy whey, 50 mL orange juice; K: consistency coefficient; n: flow index; r2: correlation coefficient
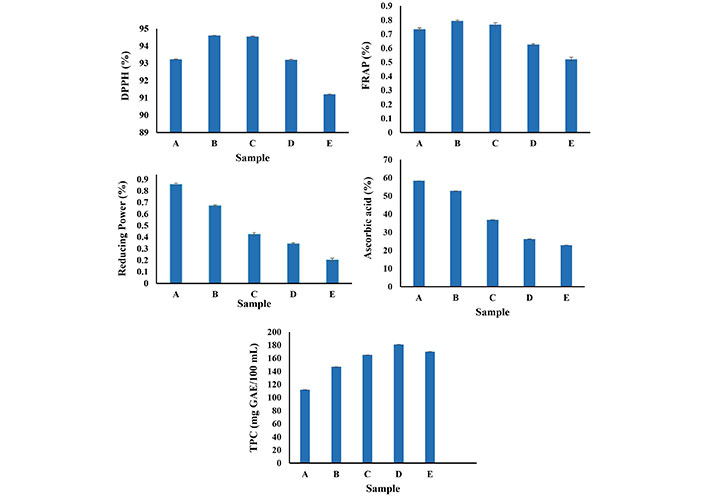
The ascorbic acid content of the soy whey incorporated orange beverages is shown in Figure 3. The ascorbic acid content of orange juice-soy whey-based beverage samples was 52.75 mg/L, 36.97 mg/L, 26.35 mg/L, and 22.87 mg/L respectively for beverages with 20%, 30%, 40%, and 50% soy whey. Escudero-López et al. [29] reported that orange juice is a rich source of bioactive components like ascorbic acid, carotenoids, and phenolics, which also contribute to their antioxidant capacity. The highest ascorbic acid content was in sample A and the lower ascorbic acid was in sample E. This decrease in the ascorbic acid content of the beverages may be due to the dilution effect of the soy whey. Similar results were also reported by Sakhale et al. [25], while working on mango juice soy milk-based beverages. The ascorbic acid content of the mango juice soy milk-based beverages were 7.33 mg/100g, 7.90 mg/100g, 9.47 mg/100g, and 9.77 mg/100g respectively for 20%, 30%, 40%, and 50% mango juice containing soy milk-based beverages. Additionally, Vieira et al. [26] reported ascorbic acid content of 0.3–2.7 mg/g samples of different treated samples of goat milk whey orange juice beverages.
Antioxidant activity of beverage samples. A: 0 mL soy whey, 100 mL orange juice; B: 20 mL soy whey, 80 mL orange juice; C: 30 mL soy whey, 70 mL orange juice; D: 40 mL soy whey, 60 mL orange juice; E: 50 mL soy whey, 50 mL orange juice
The antioxidant activity of a substance is its capacity to scavenge free radicals, soybeans are rich sources of daidzein, genistein, and glycetin which have strong antioxidant and other biological activities [30], orange juice is also rich in ascorbic acid, carotenoids, and other phenolics, hence also show strong antioxidant activity [31]. The antioxidant activity (DPPH, FRAP, and reducing power) of the beverage samples is shown in Figure 3. The DPPH (%) activity of the beverage samples increases with an increase in the soy whey percentage up to 30%, beyond 30% soy whey, the DPPH (%) activity decreases. Similar results were also reported by Tanwar et al. [1] in mango-based paneer whey beverages, in their study the DPPH activity of the paneer whey was 10.15% and with increasing paneer whey from 30% to 50%, the DPPH activity decreased from 43.48% to 33.66%. The DPPH activity of the beverage samples ranges from 91.2% to 96.23% and the FRAP activity ranges between Vieira et al. [26] reported DPPH activity of the orange beverage incorporated with goat milk whey in the range of 32.2–61.4 µg GAE/g sample processed with pasteurization and micro fluidization processes. Tanwar et al. [1] reported DPPH of whey-based mango juice beverages range between 10.15% and 39.55%.
The FRAP (%) activity ranged between 0.521% and 0.994% for A, B, C, D, and E samples. Similar to that of DPPH activity up to the addition of 30% soy whey the FRAP (%) activity increases and with the addition of the 40% and 50% soy whey, the FRAP (%) activity decreases. Orange juice is a rich source of ascorbic as stated in the above ascorbic acid analysis, Khan et al. [32] reported that ascorbic acid is a strong acid and has a higher capacity to scavenge the free radicals and thus gives higher values of FRAP (%). With increasing the concentration of soy whey in the beverage samples, the FRAP (%) activity decreases.
The reducing power ranged from 0.204 to 0.859 for the A, B, C, D, and E samples. With the increase in the soy whey concentration, the reducing power of beverage samples decreases, and beverage samples with higher orange juice content show higher reducing powder activity. Escudero-López et al. [29] stated that orange juice contains various essential components like ascorbic acid, carotenoids, and phenolics, which contribute to their higher antioxidant potential.
The TPC of the beverage samples is shown in Figure 3. The TPC of the control sample was 112 mg GAE/100 mL. With the increase in the soy whey content from 10% to 40%, the TPC increases from 165 mg GAE/100 mL to 181 mg GAE/100 mL, however, with further increase of soy whey, the TPC decreases which may be owing to the dilution effect as also reported in reducing power and vitamin C estimation results. Ashari et al. [22] reported 64.59 μg/mL of TPC in orange juice while Xiao et al. [33] reported a TPC of 59.79 mg GAE/g soy whey sample. Additionally, Tanwar et al. [1] reported a 43.48 mg GAE/100 mL mango juice beverage sample with 50:50 mango juice and paneer whey. The increase of the TPC with an increase of soy whey from 10% to 40% in the beverage samples enhances the nutraceutical potential of the beverages.
The shear stress (Pa) and shear rate (s−1) beverage samples were fitted into the power law equation to model the rheological behavior of the beverage samples as shown in Figure 4. The equation parameters, consistency coefficient (K), and flow index (n) were solved using shear stress and shear rate data to model the correlation between the shear stress and shear rate of beverages. The model fitness was defensible based on the r2 value, as r2 close to the unity showed the best fit of a model to calculate the shear stress and shear rate correlation of the developed beverages. The power law modeling of the shear stress and shear rate parameters of the beverages are shown in Table 2. The flow index (n) of unity (n = 1), n < 1.0, and n > 1.0 indicates Newtonian character, pseudoplastic and dilatant behavior respectively [34]. The flow index (n) of the beverage samples ranged from 0.1948 to 0.8214, and the yield stress required to initiate flow ranged from 0.013 Pa to 0.037 Pa, hence the beverage samples showed pseudoplastic behavior with Herschel Bulkley character. Similar behavior of goat milk whey orange juice beverages was also reported by Vieira et al. [26]. Jokar and Azizi [35] reported yield stress increment of 1.43–7.12 pa with an increase of persimmon juice content from 10% to 20%. Additionally, Silva et al.[34] also reported Herschel Bulkley character of plant-based beverages with a flow index ranging from 0.710 to 0.825. Similar behavior was also reported by Lopes et al. [36] for ultra-high temperature (UHT) nut beverages. The consistency coefficient (K) of the beverage samples ranged between 0.0041 Pa∙Sn and 0.0534 Pa∙Sn, with an increase in the whey concentration in the beverage samples, the consistency coefficient (K) decreased significantly (P < 0.05). Lopes et al. [36] reported a K value of 0.038 Pa∙Sn, 0.358 Pa∙Sn, and 0.047 Pa∙Sn for coconut beverage and hazelnut beverage, and almond beverage respectively. Additionally, the apparent viscosity of the beverage samples decreases with an increase in the shear rate. Meanwhile, viscosity is correlated to intermolecular attractions, the rise in the rotating speed will change the intermolecular energies in the beverage samples, resulting in alterations in the molecular binding of the beverages, and further change in their viscosity [37].
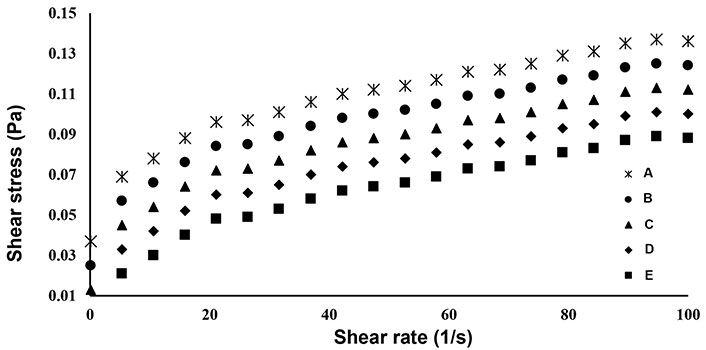
Flow behavior of beverage samples. A: 0 mL soy whey, 100 mL orange juice; B: 20 mL soy whey, 80 mL orange juice; C: 30 mL soy whey, 70 mL orange juice; D: 40 mL soy whey, 60 mL orange juice; E: 50 mL soy whey, 50 mL orange juice
From Figure 5, it is clear that the G” of the beverage samples was higher than that of the G’ values. This is owing to the higher fluid character of beverages than solid character, as also indicated in the TSS analysis of the beverage samples.
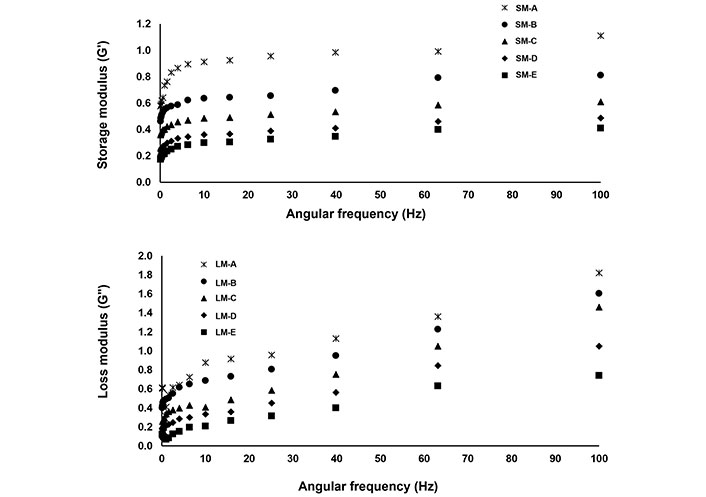
Storage modulus (SM) and loss modulus (LM) of beverages. A: 0 mL soy whey, 100 mL orange juice; B: 20 mL soy whey, 80 mL orange juice; C: 30 mL soy whey, 70 mL orange juice; D: 40 mL soy whey, 60 mL orange juice; E: 50 mL soy whey, 50 mL orange juice
In the present investigation, when the static strain was 3%, the G’ and G” of all beverage samples revealed a comparatively strong frequency dependency, attended by a delta reduction with frequency increment, demonstrating that the dynamic rheological property of the beverage was considerably influenced by the distortion rate at frequencies from 0.1 rad/s to 100 rad/s. The G’ and G” of samples increased with the intensification in frequency, which presented weak gel dynamic rheological properties, Cui et al. [37] reported that the increment of frequency would abolish the chemical bonds between molecules, which may be correlated to the alterations of G” and G’. The change of in G’ and G” in beverage samples may be due to variation in chemical composition and changes in the particle morphology of beverage samples during the homogenization process [38]. Similar behavior in chestnut lily beverage samples was also reported by Cui et al. [37] while treating the beverage samples at diverse rotational speeds during the homogenization process.
The flavor, taste, color, and overall acceptability of soy whey orange juice beverages are shown in Table 3. The flavor, taste, color, and overall acceptability of the beverage samples with 0%, 20%, and 30% soy whey showed higher sensory scores compared to the beverages with 40% and 50% soy whey. Similar results were also reported by Yadav et al. [16] while studying the effect of soy whey-based mango juice and pineapple beverage samples. The lower overall sensory score of 40% and 50% soy whey beverage samples may be owing to the Chavan et al. [39] reported a decrease in the sensory score of milk whey-based mango juice beverages during a storage study of 30 days. The D (40% soy whey) and E (50% soy whey) beverage samples showed lower overall acceptability which may be owing to the dilution effect of these beverage samples, which affects the color, flavor, taste, and overall acceptability of the beverage samples. Similar decreases in the sensory properties of paneer whey mango beverages were also reported by Pandey and Ojha [40].
Sensory evaluation of soy whey orange juice beverages
| Sample | Flavor | Taste | Color | Overall acceptability |
|---|---|---|---|---|
| A | 8.5±0.08d | 8.6±0.07e | 8.7±0.02e | 8.5±0.04e |
| B | 8.5±0.05d | 8.5±0.04d | 8.6±0.04d | 8.3±0.05d |
| C | 8.4±0.05c | 8.1±0.05c | 8.2±0.04c | 8.2±0.03c |
| D | 7.5±0.02b | 7.6±0.05b | 7.4±0.03b | 6.8±0.04b |
| E | 7.1±0.05a | 7.4±0.04a | 6.9±0.04a | 6.4±0.02a |
The data is presented as mean ± standard deviation (n = 3). For every parameter, the data with small letters as superscripts are significantly different (P < 0.05). A: 0 mL soy whey, 100 mL orange juice; B: 20 mL soy whey, 80 mL orange juice; C: 30 mL soy whey, 70 mL orange juice; D: 40 mL soy whey, 60 mL orange juice; E: 50 mL soy whey, 50 mL orange juice
Owing to the consumer preferences of the beverages, the consumers are demanding beverages with enhanced nutraceutical properties. Meanwhile, soy-based beverages are gaining importance nowadays due to the nutritional composition of soy. Soy is a rich source of daidzein, genistein, and glycetin bioactives, these bioactives reduce the menopausal syndrome and bone mineralization in old age women. Thus, the present study was conducted to develop soy-based fruit beverages to meet the consumer’s demands and preferences. An increase in the concentration of soy whey increases protein, pH and decreases the TSS of beverages. The lightness of samples increases and yellowness decreases with an increase in soy whey content. The beverage with 20% and 30% soy whey showed enhanced DPPH and FRAP activity and TPC. However, the reducing power and ascorbic acid content decreases with increase in the soy whey from 10% to 50%. All the beverage samples showed shear thinning behavior and the G’ decreases with an increase in soy whey content. Additionally, the beverages with 0%, 20%, and 30% showed higher overall acceptability compared to beverages with 40% and 50% soy whey which showed the least overall acceptability.
DPPH: 1, 1-diphenyl-2-picrylhydrazyl
FRAP: ferric reducing antioxidant power
G’: storage modulus/elastic modulus
G”: loss modulus/viscous modulus
GAE: gallic acid equivalents
L*: lightness
TPC: total phenolic content
TSSs: total soluble solids
UV-vis: ultraviolet-visible
The authors are thankful to the Department of Food Science and Technology, University of Kashmir (190006) for providing the necessary facility to conduct the present research work.
HAP: Conceptualization, Supervision, Investigation, Methodology, Writing—original draft. JAR: Conceptualization, Data curation, Supervision, Methodology, Writing—review & editing. AM: Formal analysis, Writing—review & editing.
The authors declare that there are no conflicts of interest.
Not applicable.
Not applicable.
Not applicable.
All relevant data is contained within the manuscript.
This work is funded by Indian Council of Medical Research [F.N. 5/9/1451/2022-Nut.] The funders had no role in study design, data collection and analysis, decision to publish, or preparation of the manuscript.
© The Author(s) 2023.
Copyright: © The Author(s) 2023. This is an Open Access article licensed under a Creative Commons Attribution 4.0 International License (https://creativecommons.org/licenses/by/4.0/), which permits unrestricted use, sharing, adaptation, distribution and reproduction in any medium or format, for any purpose, even commercially, as long as you give appropriate credit to the original author(s) and the source, provide a link to the Creative Commons license, and indicate if changes were made.