Original Article

Affiliation:
1School of Materials and Chemistry, University of Shanghai for Science and Technology, Shanghai 200093, China
Affiliation:
1School of Materials and Chemistry, University of Shanghai for Science and Technology, Shanghai 200093, China
Affiliation:
2China United Concrete Jining Co., Ltd, Jining 272000, Shandong, China
Affiliation:
1School of Materials and Chemistry, University of Shanghai for Science and Technology, Shanghai 200093, China
Affiliation:
1School of Materials and Chemistry, University of Shanghai for Science and Technology, Shanghai 200093, China
Email: chengp@usst.edu.cn
ORCID: https://orcid.org/0000-0002-3291-5200
Explor Drug Sci. 2023;1:435–453 DOI: https://doi.org/10.37349/eds.2023.00029
Received: June 30, 2023 Accepted: August 29, 2023 Published: December 27, 2023
Academic Editor: Walter Filgueira de Azevedo Jr., Pontifical Catholic University of Rio Grande do Sul, Brazil
The article belongs to the special issue Machine Learning for Drug Science
Aim: The purpose of this paper is to use different structures and ligand-based drug design methods properly to provide theoretical guidance for the design of novel non-covalent proteasome inhibitors, and conduct theoretical analysis of the binding interaction mode between receptors and ligands. At the same time, the pharmacokinetic (PK) prediction, drug-likeness, and synthesis prediction were made for the screened novel drugs. Therefore, potentially attractive non-covalent proteasome inhibitors with low toxicity could be found as anticancer drugs.
Methods: In this work, computer-aided drug design methods, including quantitative structure-activity relationship (QSAR), molecular docking, absorption, distribution, metabolism, excretion, and toxicology (ADMET) prediction, and drug-likeness prediction methods were performed.
Results: In this study, the structure-activity relationship (SAR) of a series of non-covalent proteasome inhibitors were studied and the optimal comparative molecular field analysis (CoMFA; Q2 = 0.574, r2 = 0.999, r2pred = 0.755) and comparative molecular similarity indices analysis (CoMSIA)-SEHA (Q2 = 0.584, r2 = 0.989, r2pred = 0.921) models were obtained. According to the results of the QSAR model, some vital clues were found that would effectively enhance the biological activity of the compound. Based on these clues, 24 novel non-covalent proteasome inhibitors (D01–D24) were finally designed and screened. While the binding models between proteasome [protein data bank (PDB) code: 3MG6] and three representative compounds (15, 20, and D24) were also analyzed by using the molecular docking method. The results suggested that hydrogen bond and hydrophobic interaction played a key role in binding interaction between the receptor and ligand. In addition, the results of ADMET prediction indicated that the new designed compounds had reasonable PK parameters and drug-like properties.
Conclusions: These statistical results can provide theoretical guidance for structural optimization, design, and synthesis of more effective non-covalent proteasome inhibitors in the future.
The ubiquitin-proteasome system (UPS) is a major pathway for the selective degradation of proteins in eukaryotic cells [1]. UPS involves many biological processes such as cell cycle progression, transcription repair, cell proliferation, differentiation, and apoptosis. Thus, UPS plays an important role in transcription, protein degradation, and protein stability of eukaryotic cells. It is an intracellular non-lysosomal protein degradation pathway, which is composed of ubiquitin-activating enzyme (E1), ubiquitin-conjugating enzyme (E2), ubiquitin ligase (E3), and the proteasome. Most of the substrates of this pathway can be recognized and degraded by 26S proteasome only after they are labeled by ubiquitin enzyme E1–E3, i.e., ubiquitination [2, 3]. The common 26S proteasome specifically degrades target proteins into polypeptides containing 7–9 amino acid residues in the form of ATP consumption [4]. The 26S proteasome mainly contains a 20S core particle (20S proteasome) and a 19S regulatory particle. The 20S proteasome consists of two α chains and two β chains respectively. Each α chain and β chain consists of seven subunits (α1–α7) and seven subunits (β1–β7), respectively. Among them, β1, β2, and β5 subunits are active sites for protein degradation, which are responsible for the caspase-like (C-L), trypsin-like (T-L), and chymotrypsin-like (ChT-L) activities of the proteasome, respectively. Each of these three β-subunits has a catalytic site that cleaves the peptide bond using the nucleophilic γ-hydroxyl group of N-terminal threonine. According to the different composition sequences of β1, β2, and β5 subunits, 20S proteasomes can be divided into immune 20S proteasomes (β1i, β2i, and β5i) and constitutive 20S proteasomes (β1c, β2c, and β5c), and different 20S proteasome inhibitors act on different subunit types and therefore have different pharmacological effects [5, 6]. UPS controls most biological functions within cellular mechanisms and handles 80% to 90% of intracellular protein degradation, therefore proteasomes have become attractive targets for the treatment of inflammatory, autoimmune, and neoplastic diseases [7].
It has been reported that the level and activity of proteasomes are higher than 90% in malignant tumors compared to normal cells, providing a survival advantage for tumor cells to continue proliferating [8]. Therefore, tumor cells will show greater sensitivity to proteasome inhibitors [9]. In 2003, bortezomib (the first-generation drug) became the first proteasome inhibitor approved by the Food and Drug Administration (FDA) for the treatment of multiple myeloma and mantle cell lymphoma, enabling the proteasome to be clinically validated as an oncology therapeutic target [10]. These were carfilzomib (the second-generation drug) [11] and ixazomib [12], which were also approved by FDA. These major 20S proteasome inhibitors reported in the literature are covalent inhibitors, which have highly reactive and unstable chemical groups [13]. They generally react covalently and irreversibly with the proteolytic sites of the proteasome, resulting in permanent blockage of the proteasome [14]. In addition, the reactive head groups lead to nonspecific binding to the active center of the proteasome and the conversion of many enzyme off-target activities into serious side effects. These may be the main cause of side effects, acquired resistance, and unsatisfactory pharmacokinetic (PK) properties of covalent proteasome inhibitors [15–17]. Hence scientists have turned their attention to the study of non-covalent proteasome inhibitors with lower toxicity in recent years. Although there is less research on non-covalent proteasome inhibitors than covalent inhibitors, it provides a promising alternative mechanism for inhibiting proteases [18]. Their potential advantages are high selectivity, moderate response, and reduced instability, which may reduce some side effects [19]. Considering these reasons, it is essential to continue the design and research of novel non-covalent proteasome inhibitors.
The purpose of this paper is to use advanced computer-aided drug design technology to study the structure-activity relationship (SAR) of a series of non-covalent proteasome inhibitors based on the research results of Yu et al. [20], so as to find their common backbones and do structural modifications. By enumerating a large number of novel compounds on the core skeleton, various physicochemical properties of new molecules are predicted and analyzed, and then novel drug molecules with anticancer activity are screened out. In this study, the quantitative SAR (QSAR) model was constructed by SYBYL-X software to study SAR between the structural characteristics of non-covalent proteasome inhibitors and their biological activities. These models provided theoretical guidance for the design of new compounds; and then the molecular docking simulation was applied to analyze the binding mode and stability between the active pocket of proteasome and inhibitors. Moreover, the absorption, distribution, metabolism, excretion, and toxicology (ADMET) and drug-like properties of new non-covalent proteasome inhibitors with higher selectivity were also evaluated. As an effective, rapid, and economical tool, computer-aided drug design has been widely used in the development of new drugs. It not only improves the hit rate of drug candidates but provides new strategies for novel drug design [21]. For example, Xu et al. [22] discovered a new set of non-covalent proteasome inhibitors through a fragment-based approach to drug design (i.e., docking calculations). Li et al. [23] obtained 2,167 compounds by virtually screening the SPECS database through using non-covalent docking and a 20S proteasome-based pharmacophore model, and finally two hit compounds were selected after molecular dynamics simulations.
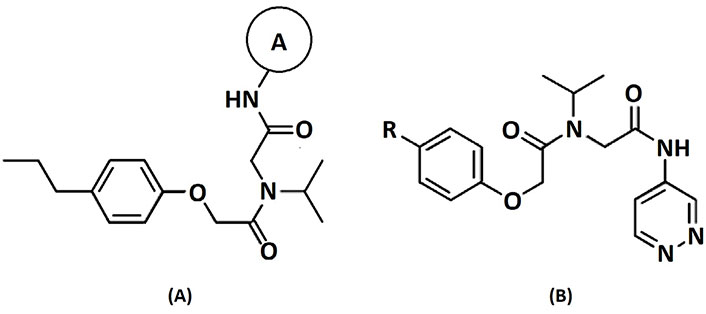
A data set, containing twenty-eight phenol ether derivatives as non-covalent proteasome inhibitors, was collected from the same literature to build the QSAR models [20]. These compounds were randomly divided into two groups. The training set of 22 compounds was used to generate quantitative models. The other was a test set of 6 molecules, which was designed to verify the reliability of the created model. The half maximal inhibitory concentration (IC50) of these compounds was known, which was converted to the pIC50 value [pIC50 = –log10(IC50)] as the dependent variable for QSAR modeling. The pIC50 values of 28 phenol ether derivatives covered a wide range from 5.229 to 7.310, which supplied extensive and homogenous data for QSAR analysis. The backbones of non-covalent proteasome inhibitors are shown in Figure 1, which are separated into two series. The backbone of the first series is shown in Figure 1A, and the compounds are from 1 to 16. The backbone of compounds 17–28 in Table 1 is illustrated in Figure 1B. The chemical structures of non-covalent proteasome inhibitors and their biological activity values are shown in Table 1.
The structures and activities of non-covalent proteasome inhibitors
| No. | Group | IC50 (nmol/L) | pIC50 | CoMFA | CoMSIA | ||
|---|---|---|---|---|---|---|---|
| Pred. | Res. | Pred. | Res. | ||||
| A-group | |||||||
| 1 |  | 1,682 | 5.774 | 5.793 | –0.019 | 5.840 | –0.066 |
| 2 |  | 836 | 6.078 | 6.093 | –0.015 | 6.088 | –0.010 |
| 3 |  | 280 | 6.553 | 6.494 | 0.059 | 6.463 | 0.090 |
| 4 |  | 395 | 6.403 | 6.285 | 0.118 | 6.285 | 0.118 |
| 5 |  | 89 | 7.051 | 7.071 | –0.020 | 7.071 | –0.020 |
| 6 |  | 2,000 | 5.699 | 5.705 | –0.006 | 5.661 | 0.038 |
| 7 |  | 952 | 6.021 | 6.044 | –0.023 | 5.956 | 0.065 |
| 8 |  | 4,726 | 5.326 | 5.317 | 0.009 | 5.370 | –0.044 |
| 9 |  | 1,197 | 5.922 | 6.137 | –0.215 | 6.095 | –0.173 |
| 10 |  | 922 | 6.035 | 6.744 | –0.709 | 6.345 | –0.310 |
| 11 |  | 230 | 6.638 | 6.624 | 0.014 | 6.625 | 0.013 |
| 12 |  | 361 | 6.442 | 6.440 | 0.002 | 6.490 | –0.048 |
| 13 |  | 3,863 | 5.413 | 5.423 | –0.010 | 5.447 | –0.034 |
| 14 |  | 2,011 | 5.697 | 5.562 | 0.135 | 5.528 | 0.169 |
| 15 |  | 5,907 | 5.229 | 5.221 | 0.008 | 5.187 | 0.042 |
| 16 |  | 1,111 | 5.954 | 5.955 | –0.001 | 5.977 | –0.023 |
| R-group | |||||||
| 17 |  | 481 | 6.318 | 6.334 | –0.016 | 6.270 | 0.048 |
| 18 |  | 243 | 6.614 | 6.593 | 0.021 | 6.537 | 0.077 |
| 19 |  | 89 | 7.051 | 6.837 | 0.214 | 6.887 | 0.164 |
| 20 |  | 49 | 7.310 | 7.303 | 0.007 | 7.164 | 0.146 |
| 21 |  | 118 | 6.928 | 6.938 | –0.010 | 6.978 | –0.050 |
| 22 |  | 64 | 7.194 | 7.212 | –0.018 | 7.304 | –0.110 |
| 23 |  | 579 | 6.237 | 6.226 | 0.011 | 6.306 | –0.069 |
| 24 |  | 259 | 6.587 | 6.592 | –0.005 | 6.593 | –0.006 |
| 25 |  | 952 | 6.021 | 6.015 | 0.006 | 6.096 | –0.075 |
| 26 |  | 405 | 6.393 | 6.099 | 0.294 | 6.281 | 0.112 |
| 27 |  | 1,561 | 5.807 | 5.821 | –0.014 | 5.765 | 0.042 |
| 28 |  | 968 | 6.014 | 5.995 | 0.019 | 6.020 | –0.006 |
*: test set compounds; **: the most active compound. CoMFA: comparative molecular field analysis; CoMSIA: comparative molecular similarity indices analysis; Pred.: predicted value; Res.: residual value
The three-dimensional (3D) structure of 28 phenol ether derivatives was constructed in the Sketch module of the SYBYL-X 2.0 software package (Tripos, St. Louis, USA) [24]. Each molecule was minimized to obtain the lowest energy conformation. Energy minimization of all compounds was performed using the Tripos force field with Powell method. Gasteiger Hückel method was used to calculate the atomic charge. In order to get stable conformations, the maximum number of iterations was set to 10,000 and the energy convergence gradient was set to 0.005 kcal/(mol Å) [25–27]. The other parameters adopt the system default.
Molecular alignment operation is not only the basic step to establish a reliable 3D-QSAR model, but the quality of molecular alignment directly affects the prediction ability of the constructed model [28, 29]. To get the best QSAR model, we selected the most active compound 20 (IC50 = 49 nmol/L) as the template molecule for molecular alignment [30, 31]. The chemical structure of the template molecule is shown in Figure 2A and the red part represents the common skeleton. The result of alignment based on the common substructure is shown in Figure 2B.
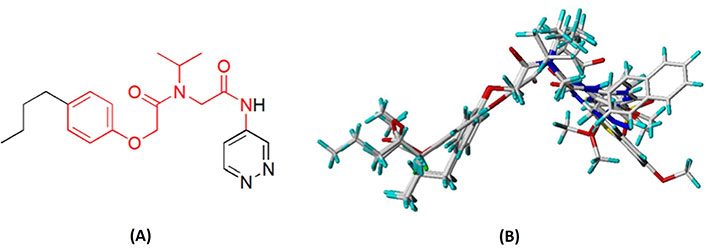
The common substructure and the result of alignment. (A) Compound 20 was used as a template for the alignment. The common substructure was marked in red color; (B) the alignment diagram of the training set
CoMFA and CoMSIA are two general applied tools of 3D-QSAR [26]. These methods are based on descriptors of 3D structures to analyze the different contributions of steric (S), electrostatic (E), hydrophobic (H), H-bond donor (HD), and H-bond acceptor (HA) fields [32, 33]. These descriptors are directly related to the atomic properties of compounds and the spatial geometry of molecules. Potentials are reflected in their position and expansion in space and their intensity. The CoMFA and CoMSIA models are performed using the QSAR option of SYBYL-X 2.0 software with the default parameters.
The non-covalent proteasome inhibitors were placed in the spatial grid to establish the CoMFA model. A 3D cubic box with 2.0 Å grid spacing in the X, Y, and Z directions was generated by the default values. The spatial lattice was linked with 3D structure, bioactive data, and molecular potential energy, thus providing valuable information for molecular modifications. S and E fields were calculated at each grid point with Tripos force field using a carbon atom probe with sp3 hybridization by means of a van der Waals radius of 1.52 Å and a charge of +1.0. In addition, the default S and E energy cutoffs were both set to 30 kcal/mol to avoid the infinity of energy values inside a compound [34, 35].
CoMSIA and CoMFA applied for the same molecular alignment method, however, the results of CoMSIA were more robust than the CoMFA. CoMSIA model was not limited to S and E fields but covered H, HD, and HA fields, which compensated for some shortcomings of CoMFA model. CoMSIA model was calculated using a sp1 hybridized carbon atom with the radius of 1.0 Å and net +1.0 charge as a probe atom. The column filter and attenuation factor were set to 2.0 kJ/mol and 0.3, respectively, to reduce noise and speed up analysis [36]. The other parameters took the system default.
The partial least-squares (PLS) method was a multi-regression analysis method based on the ideas of linear transformation [37]. The inhibitor activity was used as the dependent variable and descriptors of potential fields as independent variables for the 3D-QSAR model. In the cross-validation process, the optimum number of components (ONCs) and cross-validation correlation coefficient (Q2) were calculated by leave-one-out (LOO) method. Then the non-cross-validation correlation coefficient (r2), standard error of estimate (SEE), and F-test values (F) were further obtained in the non-cross-validation analysis. The reliable 3D-QSAR models should have low values of SEE and high values of Q2, r2, and F. These important statistical parameters reflected whether the constructed model was reliable and robust or not [38, 39].
The external validation was also a crucial step because it could guarantee the predictive accuracy of 3D-QSAR. A favorable model relied on the high predicted external validation correlation coefficient r2pred value (r2pred > 0.6) [40]. According to Roy et al. [41] and Mitra et al. [42], the other four statistical parameters also need to meet certain rules to ensure the robustness of the model. These rules were the following criteria:
R2 was the square correlation coefficient between the experimental and predicted bioactivity. The formula was as follows:
K was the regression of experimental and Pred. and the regression line slope through the origin. The formula was as follows:
Molecular docking is a general method of simulating ligand-protein interactions, through which some vital information about ligand at particular binding site can be provided. For example, we can know the overall geometric conformation of ligands and the microscopic interactions within the pockets [43]. In this study, the Autodock software was used for the docking process [44, 45]. Since the ligand in the crystal structure of 3MG6 [protein data bank (PDB) ID] are selective for the β5 (ChT-L) site of the 20S core particle of the proteasome, our designed molecules have the same mechanism of selective inhibition of the β5 site of the proteasome [46, 47]. Therefore, to elucidate the binding modes of a new series of non-covalent proteasome inhibitors with exquisite potency and selectivity for the 20S β5-subunit, molecular docking calculations were performed. The X-ray crystal structure of the proteasome (PDB ID: 3MG6) was downloaded from the PDB (https://www.rcsb.org/). There were two core operations in the docking process. The first one involved pretreatment of proteins, including the removal of water molecules and original ligand, modification of missing loop regions, the addition of missing atoms and polarized hydrogen, and charges calculations. Then the compounds were docked into the active pockets of protein, which was defined by a 45 × 45 × 45 box centroid of the crystal ligand with a default grid space size of 0.375 Å [48]. All other parameters remained the default values. Finally, ten different molecular conformations were generated for each compound. The docking results were analyzed using PyMol software.
PKs and toxicology are important components of drug preclinical research. PK reflects the patterns of absorption, distribution, metabolism, and excretion of drugs, which are necessary processes for drug metabolism in the human body. According to statistics, most candidate drugs failed in drug development due to poor PK properties or excessive toxicity [49, 50]. Therefore, the ADMET comprehensive evaluation of candidate compounds is conducive to improving the success rate of new drug research and development [51]. In this study, ADMET and drug-like properties of newly designed phenol ether derivatives were obtained from pkCSM online server (http://biosig.unimelb.edu.au/pkcsm/prediction) [52] and SwissADME web tool (http://www.swissadme.ch) [53]. The predicted ADMET data will provide some theoretical support for further experimental verification.
In order to acquire the best statistical model, we combined different fields to build a wide variety of models, calculated their statistical data, and finally elected the best QSAR model. The results of the CoMFA model and some CoMSIA models utilizing different combination types of fields are shown in Table S1. The Q2 and r2 values of a good 3D-QSAR model should be greater than 0.5 and 0.9, respectively. For the PLS analysis results of CoMFA-SE (using both S and E fields to build models) model, Q2, ONC, r2, SEE, and F was 0.574, 10, 0.999, 0.026 and 1,084.404, respectively, suggesting that it had good internal validation capabilities. The predicted external validation correlation coefficient r2pred value was 0.755. The contribution for S and E fields were 47.1% and 52.9%, respectively. All this statistical data indicated that this model was reliable and robust. Therefore, CoMFA-SE was selected as the final CoMFA model.
The CoMSIA-HAD model had the highest Q2 value (Q2 = 0.647) in all CoMSIA series, but it was not chosen as the final CoMSIA model. Because we found that the contribution rate of E field always had a high weight in CoMSIA series. For example, the contribution of E was up to 32.3% in the CoMSIA-SEHAD model with all fields. Therefore, we could not ignore the importance of E in the CoMSIA model. However, the contribution of the HD showed a downward trend with the increase in the number of fields. For instance, it contributed the least (8.1%) in the CoMSIA-SEHAD model. So, the role of HD was not considered at all. Meanwhile, the CoMSIA-SEHA model had the highest Q2 value in these five models (CoMSIA-SEHD, CoMSIA-SEHA, CoMSIA-SEDA, CoMSIA-SHDA, CoMSIA-EHAD), hence CoMSIA-SEHA was selected as the CoMSIA model. The CoMSIA-SEHA model had a large Q2 value of 0.584 and r2 value of 0.989, lower SEE value of 0.077, and F value of 172.183, showing that this model was reliable. The r2pred value was 0.921, suggesting that this model had a strong external predictive capability. These statistical results demonstrated that the CoMSIA-SEHA model was robust. The contributions of S, E, H, and HA were 12.6%, 35.2%, 27.6%, and 24.5%, respectively. It showed that E played a vital role in this model. To sum up, CoMSIA-SEHA was selected as the best CoMSIA model. The statistical parameters of 3D-QSAR model after PLS analysis are shown in Table 2.
Statistical results of optimal CoMFA and CoMSIA models
| Parameters | Threshold value | CoMFA-SE | CoMSIA-SEHA |
|---|---|---|---|
| Q2 (cross-validate) | > 0.5 | 0.574 | 0.584 |
| r2 | > 0.6 | 0.999 | 0.989 |
| SEE | - | 0.026 | 0.077 |
| F | - | 1,084.404 | 172.183 |
| ONC | - | 10 | 7 |
| r2pred | > 0.6 | 0.755 | 0.921 |
| R2 | > 0.6 | 0.684 | 0.897 |
| K | 0.85 ≤ K ≤ 1.15 | 0.996 | 1.005 |
| Close to value of r2 | 0.998 | 0.996 | |
| (R2 - | < 0.1 | –0.459 | –0.110 |
| > 0.5 | 0.559 | 0.614 | |
| Field contribution (%) | - | - | - |
| S | - | 47.1 | 12.6 |
| E | - | 52.9 | 35.2 |
| H | - | - | 27.6 |
| HA | - | - | 24.5 |
-: not applicable
To test the predictive ability of the QSAR model, the test set of six compounds was selected for external verification to evaluate it. The r2pred of the CoMFA-SE (hereafter referred to CoMFA) and CoMSIA-SEHA (hereafter referred to as CoMSIA) models was greater than 0.6, indicating that the established QSAR model had a decent external predictive ability. The relevant statistical results are shown in Table 2, and the other four statistical parameters calculated from the formulas of Roy et al. [41] and Mitra et al. [42] are also shown in Table 2. The CoMFA and CoMSIA models had R2 at 0.684 and 0.897, K at 0.996 and 1.005, (R2 −
The predicted bioactivity values of QSAR models for the training set and test set are shown in Table 1. The scatter plots of experimental and predicted pIC50 values are shown in Figure 3. It could be seen from the picture that red triangle blocks and blue dots were close to the straight line (Y = X), which meant the actual values of whole molecules were almost consistent with the Pred. All these data clearly indicated the excellent stability and the highly predictive characteristics of 3D-QSAR models.
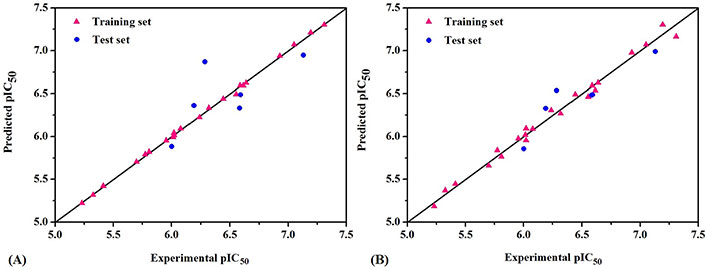
The scatter plots of experimental versus predicted pIC50 for CoMFA (A) and CoMSIA (B) models
By analyzing the contour maps of CoMFA and CoMSIA models, we can vividly study the physical and chemical properties of the compound to find the key information affecting the bioactivity, which will guide us to design novel molecules. In this study, we mainly discussed the 3D-QSAR in four potential fields. The favorable and unfavorable contributions of all fields default to 80% and 20%, respectively. To better explain the contour maps, the inhibitor of the highest activity (compound 20) was labeled as shown in Figure 2A.
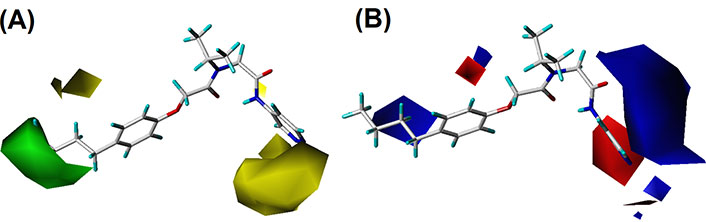
In the S contour maps, the green blocks indicated that the introduction of bulky groups in the region would improve the bioactivity, while the yellow regions mean the opposite. S fields for CoMFA and CoMSIA were shown in Figures 4 and 5, respectively. As shown in Figure 4A, a large-sized yellow block was displayed near the R3 area, while a medium-sized green contour existed in the R1 region. In addition, in Figure 5A, compound 20 was surrounded by a large yellow contour and relatively small green block in the R3 and R1 regions, respectively, which was basically consistent with the CoMFA model analysis. It was worth mentioning that a large-sized yellow contour appeared at the R3 opposite position in the CoMSIA model, but not in the CoMFA model. Overall, we found three key clues to enhance the activity of non-covalent proteasome inhibitors in the S fields: the bulky substituents at the R1 of compound 20, and the small group at the R3 and R3 opposite position, respectively.
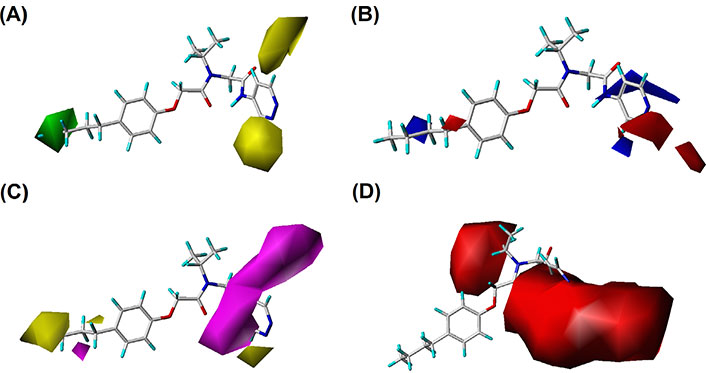
The CoMSIA contour maps of template compound 20. (A) The S field; (B) the E field; (C) the H field; (D) the HA field
In E field contour maps shown in Figures 4B and 5B for CoMFA and CoMSIA, respectively, the red and blue blocks indicated that negative and positive groups in these regions could strengthen the inhibition of the compound. A medium-sized blue and a large blue contour appeared at the R1 and R2 in Figure 4B, which suggested that the original group replaced by the positive substitutions would increase the bioactivity. In the R3 region, there was a medium-sized red contour indicating that the negative group here was beneficial to the inhibition of the compound. As for the CoMSIA, the situation was similar to the CoMFA model, so the details were not discussed.
For the CoMSIA model, the H field contour map was shown in Figure 5C. The yellow block indicates that the H group introduced in the area can enhance the activity of compounds, while the magenta block indicates that the hydrophilic groups introduced in the area are helpful for increasing bioactivity. It could be seen from Figure 5C that a yellow contour was embedded in the R1 area, indicating that the H group here was advantageous. There was a huge magenta block in the R3 area, showing that the hydrophilic group here was favorable.
In the HA field of the CoMSIA model shown in Figure 5D, magenta blocks indicate that the introduction of HA groups is valuable to increase the activity of the compound, while red blocks are the opposite. There was a medium-sized red color block in the R2 area, and a large red contour embedded in the R3 area, indicating that the HD groups in the R2 and R3 regions were advantageous for improving the bioactivity of the compound.
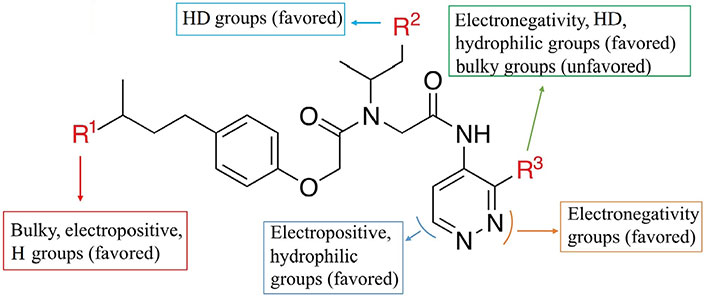
By analyzing the 3D-QSAR of a series of non-covalent proteasome inhibitors, some key clues about structural modifications to improve bioactivity were obtained: 1) The R1 area was mainly surrounded by the green contour in the S fields of the CoMFA and CoMSIA models, the blue block in the E field, and the yellow block in the H field of the CoMSIA model. These results showed that the addition of bulky, positive, or H groups in the R1 region was beneficial. 2) The R2 region was mainly surrounded by a red contour in the HA field of the CoMSIA model, indicating that the introduction of the HD here was helpful. 3) The R3 area had the appearance of color block in four fields, namely, the yellow block in the S field, the red contour in the E field, the magenta block in the H field, and the red contour in the HA field, which represented the addition of small group, negative charge, hydrophilic, or HD group in this area was favorable. The main SAR information of non-covalent proteasome inhibitors is illustrated in Figure 6.
Based on the above clues, a series of novel non-covalent proteasome inhibitors were designed and evaluated using the highest bioactivity compound 20 as the template (Figure 6). Finally, twenty-four new inhibitors (compound D01–D24) were screened out with higher Pred. than the template. The chemical structures of these novel inhibitors and their pIC50 values predicted by the constructed QSAR models are shown in Table 3.
The structures and activities of newly designed non-covalent proteasome inhibitors
| ID | Substituent | Predicted pIC50 | Synthetic accessibility | Drug-likeness Lipinski | |||
|---|---|---|---|---|---|---|---|
| R1 | R2 | R3 | CoMFA | CoMSIA | |||
| C20 | H | H | H | 7.303 | 7.164 | 3.02 | Yes |
| D1 | Me | H | H | 7.311 | 7.306 | 3.14 | Yes |
| D2 | H | CHO | H | 7.369 | 7.233 | 3.56 | Yes |
| D3 | H | COOH | H | 7.322 | 7.233 | 3.63 | Yes |
| D4 | H | NH2 | H | 7.317 | 7.207 | 3.56 | Yes |
| D5 | H | H | F | 7.394 | 7.190 | 3.20 | Yes |
| D6 | H | H | CHO | 7.436 | 7.613 | 3.18 | Yes |
| D7 | H | H | COOH | 7.435 | 7.652 | 3.29 | Yes |
| D8 | 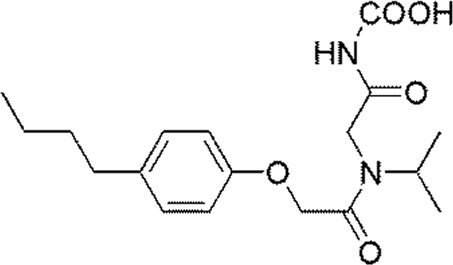 | 7.323 | 7.287 | 2.61 | Yes | ||
| D9 | Me | H | F | 7.416 | 7.331 | 3.32 | Yes |
| D10 | Me | H | CHO | 7.498 | 7.756 | 3.30 | Yes |
| D11 | Me | H | COOH | 7.432 | 7.792 | 3.41 | Yes |
| D12 | H | COOH | F | 7.425 | 7.258 | 3.79 | Yes |
| D13 | H | COOH | CHO | 7.466 | 7.680 | 3.79 | Yes |
| D14 | H | COOH | COOH | 7.458 | 7.718 | 3.89 | Yes |
| D15 | H | NH2 | F | 7.388 | 7.232 | 3.73 | Yes |
| D16 | H | NH2 | CHO | 7.437 | 7.649 | 3.72 | Yes |
| D17 | H | NH2 | COOH | 7.431 | 7.688 | 3.82 | Yes |
| D18 | Me | CHO | COOH | 7.349 | 7.792 | 3.94 | Yes |
| D19 | Me | COOH | F | 7.346 | 7.364 | 3.91 | Yes |
| D20 | Me | COOH | CHO | 7.450 | 7.788 | 3.90 | Yes |
| D21 | Me | COOH | COOH | 7.362 | 7.823 | 4.01 | Yes |
| D22 | Me | NH2 | F | 7.442 | 7.373 | 3.85 | Yes |
| D23 | Me | NH2 | CHO | 7.522 | 7.794 | 3.83 | Yes |
| D24 | Me | NH2 | COOH | 7.468 | 7.828 | 3.94 | Yes |
In order to better explain the relevant docking results, three representative compounds for detailed descriptions were selected. The results of docking are clearly illustrated in Figure 7. How the least biologically active compound 15, the most biologically active compound 20, and the newly designed compound with the highest predictive activity D24 bound with the receptor protein 3MG6 are shown in Figure 7A, B, and C, respectively. At the same time, their molecular docking scores were −6.3 kcal/mol (compound 15), −8.3 kcal/mol (compound 20), and −8.9 kcal/mol (compound D24), respectively. The lower the molecular docking score, the stronger the binding ability of the ligand to the receptor [54]. And it can be seen that the size of the binding force is consistent with the size of the biological activity value. The binding mode of compound 15 which is the least active molecule in the dataset is clearly shown in Figure 7A. This inhibitor afforded some interactions with the proteasome. It could be seen that the oxygen atom of compound 15 near the R2 region presented a hydrogen bond with alanine 22 (−O…HN, 3.0 Å ). Furthermore, the oxygen atom was also bound with the amino acid residue of asparagine 24 by the formation of a hydrogen bond (−O…HN, 3.1 Å ). In addition, there was a π-π stacking between tryptophane 25 and the benzene ring of compound 15. Several H interactions in the binding site were also found. However, when the docking result of compound 20 (the most active inhibitor) was analyzed, there were stronger interactions in the binding pocket which could explain why the activity of compound 20 was higher than compound 15. As could be seen from Figure 7B, the oxygen atom near the R2 region of compound 20 (in the same position as compound 15) formed a hydrogen bond with tryptophane 25 (−O…HN, 3.4 Å ). The second one was that the NH group of compound 20 near the R3 region interacted with alanine 27 (−O…HN, 3.8 Å ). The third one was the oxygen atom bound with glycine 128 and there were other hydrogen bond interactions with key residues like serine 112, serine 118, and aspartic acid 114, respectively. Compared with compound 15, compound 20 had more hydrogen bond interactions with receptor which would be vital for the binding stability of inhibitor in the active site. Meanwhile, there was the same π-π stacking interaction as compound 15. In addition, the H interaction between compound 20 and key residues such as tryptophane 25, histidine 98, and aspartic acid 114 further enhanced the bioactivity. These multi-conjugate effects revealed that compound 20 (IC50 = 49 nmol/L) had stronger stability in the active pocket of the receptor and higher activity than compound 15 (IC50 = 5,907 nmol/L), which is consistent with the experimental result.
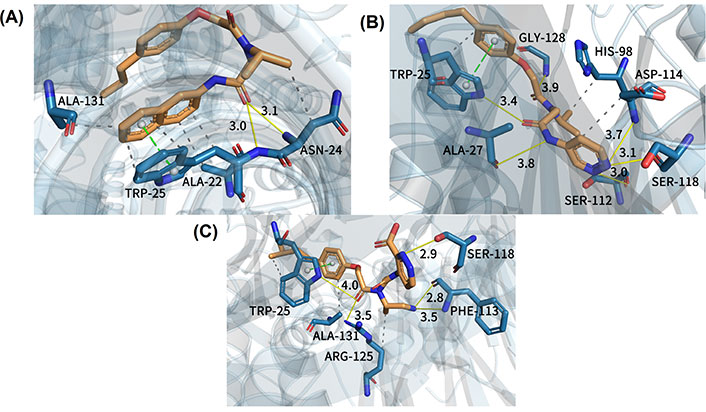
Docking results of three representative compounds in the binding site of the proteasome. (A) Least active compound 15; (B) most active compound 20; (C) new designed compound D24. Yellow solid line: hydrogen bond; green dotted line: π-π stacking; gray dotted line: H interaction
In order to better demonstrate that the new designed non-covalent proteasome inhibitors had higher biological activity than the template molecule (compound 20), the molecular docking method was applied for studying their binding mode with the receptor. New designed compound D24 with the predicted most biological active values was taken as an example. In Figure 7C, we noticed that compound D24 had the same hydrogen bond interaction as compound 20 where they interacted with the same residue (tryptophane 25), but the distinction between them was the hydrogen bond distance. For compound D24, the oxygen atom was far away from the surrounding residue, which was bad for ligand-protein interactions. It was noteworthy that there was a stronger 2.8 Å-hydrogen bond interaction between the NH group of compound D24 (at R2 position) and phenylalanine 113 (−O…HN, 2.8 Å ), which made the ligand-protein interaction binding more stable. Additionally, the pyridazine ring of compound D24 formed another stable hydrogen bond with serine 118 (−O…HN, 2.9 Å ). Except that, compound D24 was bound with arginine 125 and phenylalanine 113, respectively, to generate other hydrogen bond interactions. Generally speaking, compound D24 had a closer hydrogen bonding distance than the template molecule, so it could more tightly bind with the receptor to have better inhibitor activity. In addition, we found that all three representative compounds formed π-π stacking with an indole ring of tryptophane 25, which implied it may be a key residue in the active pocket. Of course, the H interactions also existed in the compound D24 to enhance the binding with the protein. In summary, all of these results clearly indicated that compound D24 had high stability at the binding site, followed by a high inhibitory activity.
ADMET is a complex process and each link may have a great impact on the effectiveness and safety of drugs, so it is an important index to evaluate the drug properties of compounds in the process of new drug development and clinical use. Therefore, the online predictive evaluation of the newly designed compound (D01–D24) was performed. The results of statistical parameters for ADMET prediction of the newly designed non-covalent proteasome inhibitors are shown in Table 4. The results of drug-likeness and synthesis accessibility are shown in Table 3.
ADMET properties of novel designed compounds
| ID | Absorption | Distribution | Metabolism CYP (substrate) | Metabolism CYP (inhibitor) | Excretion | Toxicology | |||||||
|---|---|---|---|---|---|---|---|---|---|---|---|---|---|
| Intestinal absorption (human; % absorbed) | VDss (human; log L/kg) | 2D6 | 3A4 | 1A2 | 2C19 | 2C9 | 2D6 | 3A4 | Total clearance (log mL/min per kg) | AMES | Hepatotoxicity | Skin sensitization | |
| C20 | 93.041 | –0.45 | No | Yes | No | Yes | Yes | No | Yes | 1.354 | No | Yes | No |
| D1 | 92.849 | –0.426 | No | Yes | No | Yes | Yes | No | Yes | 1.227 | No | Yes | No |
| D2 | 75.759 | –0.506 | No | Yes | No | No | No | No | Yes | 1.421 | No | Yes | No |
| D3 | 53.994 | –1.385 | No | No | No | No | No | No | No | 1.222 | No | Yes | No |
| D4 | 68.354 | 0.248 | No | No | No | No | No | No | No | 0.998 | No | Yes | No |
| D5 | 92.105 | –0.551 | No | Yes | No | Yes | Yes | No | Yes | 1.206 | No | Yes | No |
| D6 | 70.044 | –0.534 | No | Yes | No | Yes | Yes | No | Yes | 1.351 | No | Yes | No |
| D7 | 45.352 | –1.07 | No | No | No | No | No | No | No | 1.109 | No | Yes | No |
| D8 | 50.399 | –1.261 | No | No | No | No | No | No | No | 1.313 | No | Yes | No |
| D9 | 50.399 | –1.261 | No | No | No | No | No | No | No | 1.313 | No | Yes | No |
| D10 | 70.203 | –0.518 | No | Yes | No | Yes | Yes | No | Yes | 1.223 | No | Yes | No |
| D11 | 45.51 | –1.066 | No | No | No | No | No | No | No | 0.981 | No | Yes | No |
| D12 | 50.741 | –1.417 | No | No | No | No | No | No | No | 1.074 | No | Yes | No |
| D13 | 45.056 | –1.442 | No | No | No | No | No | No | No | 1.218 | No | Yes | No |
| D14 | 20.297 | –1.516 | No | No | No | No | No | No | No | 0.976 | No | Yes | No |
| D15 | 65.101 | 0.133 | No | No | No | No | No | No | No | 0.864 | No | Yes | No |
| D16 | 59.416 | 0.088 | No | No | No | No | No | No | No | 0.977 | No | Yes | No |
| D17 | 34.657 | –0.65 | No | No | No | No | No | No | No | 0.811 | No | Yes | No |
| D18 | 42.22 | –1.202 | No | No | No | No | No | No | No | 1.048 | No | Yes | No |
| D19 | 50.9 | –1.39 | No | No | No | No | No | No | No | 0.946 | No | Yes | No |
| D20 | 45.215 | –1.41 | No | No | No | No | No | No | No | 1.09 | No | Yes | No |
| D21 | 20.455 | –1.477 | No | No | No | No | No | No | No | 0.848 | No | Yes | No |
| D22 | 65.26 | 0.138 | No | No | No | No | No | No | No | 0.723 | No | Yes | No |
| D23 | 59.575 | 0.098 | No | No | No | No | No | No | No | 0.837 | No | Yes | No |
| D24 | 34.815 | –0.648 | No | No | No | No | No | No | No | 0.671 | No | Yes | No |
CYP: cytochrome P450; VDss: volume of distribution steady-state
The intestinal absorptions of the newly designed compounds (D01–D24) are all greater than 30%, except compounds D14 and D21, which indicates that they will be highly absorbed by the human intestine. In particular, the highest intestinal absorption of compound D1 is 92.849%, suggesting that the novel non-covalent proteasome inhibitors have better absorption capacity as an oral drug. Enzymatic metabolism of the newly designed compound is assessed by whether it is a substrate or inhibitor of CYP. Considering that there are different enzymes in the family of CYP enzymes in human cells, CYP2D6 and CYP3A4 are two remarkable isoforms of P450 responsible for drug metabolism. As can be seen from Table 4, all the designed compounds are neither substrates nor inhibitors of CYP2D6. Compounds D1, D2, D5, D6, and D10 are substrates of CYP3A4, suggesting that they can be metabolized by CYP3A4. The other compounds are not CYP3A4 inhibitors, meaning that they may not affect normal metabolism. In terms of drug clearance, the Pred. indicates that all newly designed compounds could be cleared by combined hepato-renal clearance. Candidate drugs are supposed to be non-toxic to humans, and the AMES test is a bacteria short-term test that determines whether a chemical has mutagenic potential. Fortunately, none of the designed compounds are toxic to AMES and induce skin sensitization. The designed compounds are hepatotoxic, which may impair the normal function of the liver. According to the results of ADMET prediction, we may theoretically assume that the newly designed molecules have good PK properties.
Drug-likeness qualitatively assesses the likelihood of a compound becoming an oral drug from the perspective of bioavailability. As shown in Table 3, all novel compounds fulfill the Lipinski rule, which means they meet the criteria for being oral drugs. In addition, it is worth noting that the newly designed compounds D01–D24 have a synthetic accessibility range of 2.61–4.01, suggesting that they are not difficult to synthesize. These results could provide researchers with valuable information on drug synthesis and screening.
A growing body of research suggests that proteasome inhibitors could be valuable drugs for the treatment of neoplastic diseases [55]. Most of the 20S proteasome inhibitors reported in the literature are peptide-based compounds with C-terminal electrophilic warheads that form covalent additions to the active site Thr1Oγ. However, this mode of covalent action, together with the high reactivity of the compound, can lead to off-target interactions [56]. To overcome these shortcomings, researchers have looked for a number of inhibitors with different mechanisms of action, including non-covalent proteasome inhibitors. Non-covalent inhibitors may exhibit unique advantages over covalent inhibitors. For example, non-covalent inhibitors are usually reversible and reduce toxicity due to their non-cumulative proteasome inhibition [57, 58]. Off-target effects can be limited by non-covalent inhibition of regulatory enzyme activity, thereby reducing drug side effects [59]. Thus, there is a recent tendency to identify non-covalent inhibitors, mainly including peptides, pseudopeptides, and some organic compounds [60]. Compared with covalent inhibitors, our rationally designed novel phenol ether derivatives as non-covalent proteasome inhibitors have the effect of selectively inhibiting the β5 site of the proteasome and they may provide an alternative mechanism for proteasome inhibition.
In this work, computer-aided drug design methods, including the QSAR model, molecular docking, ADMET prediction, and drug-likeness prediction, were used to systematically study the theoretical SARs of 28 phenol ether derivatives to design novel non-covalent proteasome inhibitors for tumor treatment. The optimal QSAR models were established (CoMFA-SE: Q2 = 0.574, r2 = 0.999, r2pred = 0.755; CoMSIA-SEHA: Q2 = 0.584, r2 = 0.989, r2pred = 0.921). In addition, the results showed that the created models were robust and could be used to predict the bioactivity of the newly designed compounds. By comprehensively analyzing the contour maps of CoMFA and CoMSIA models, some key information about the structural modifications that can significantly enhance the molecular activity were found: 1) introducing bulky, positive, or H groups in the R1 region; 2) introducing HD group in R2 area; 3) introducing small group, electronegative, hydrophilic, or HD groups in the R3 region. Based on the SAR information, we designed, predicted, evaluated, and finally screened 24 novel non-covalent proteasome inhibitors (D01–D24). The docking results between compound 15 (the least active molecule), 20 (the most active molecule), D24, and proteasome (PDB ID: 3MG6) showed that compound D24 had high stability in the binding site of the protein. In addition, the prediction results of ADMET and drug-likeness properties indicated that the novel-designed compounds had rational PKs and drug-likeness properties. In general, all newly designed non-covalent proteasome inhibitors had good bioactivity, binding stability, ADMET, and drug-likeness characteristics.
In our study, SAR on the phenol ether derivatives as non-covalent proteasome inhibitors has been extensively explored. The computational studies show a non-covalent binding mode. It also provides a new chemical template for non-covalent proteasome inhibitors, providing good insights for future research on structural modification and synthesis of more efficient and selective proteasome inhibitors to improve potency and subunit selectivity. Of course, the accuracy of these predictions also needs to be verified by experiments in the future. This study could lead to the discovery of anti-tumor drugs with higher inhibitory effects.
3D: three-dimensional
ADMET: absorption, distribution, metabolism, excretion, and toxicology
CoMFA: comparative molecular field analysis
CoMSIA: comparative molecular similarity indices analysis
CYP: cytochrome P450
E: electrostatic
H: hydrophobic
HA: H-bond acceptor
HD: H-bond donor
IC50: half maximal inhibitory concentration
ONCs: optimum number of components
PDB: protein data bank
PK: pharmacokinetic
PLS: partial least-squares
QSAR: quantitative structure-activity relationship
S: steric
SAR: structure-activity relationship
SEE: standard error of estimate
UPS: ubiquitin-proteasome system
The supplementary material for this article is available at: https://www.explorationpub.com/uploads/Article/file/100829_sup_1.pdf.
MY: Conceptualization, Investigation, Validation, Writing—original draft, Writing—review & editing. HJ: Conceptualization, Data curation, Validation. FS: Conceptualization, Investigation. QC: Conceptualization, Investigation, Formal analysis. PC: Conceptualization, Project administration, Writing—review & editing, Supervision. All authors read and approved the submitted version.
The authors declare that they have no conflicts of interest.
Not applicable.
Not applicable.
Not applicable.
All relevant data is contained within the manuscript.
Not applicable.
© The Author(s) 2023.
Copyright: © The Author(s) 2023. This is an Open Access article licensed under a Creative Commons Attribution 4.0 International License (https://creativecommons.org/licenses/by/4.0/), which permits unrestricted use, sharing, adaptation, distribution and reproduction in any medium or format, for any purpose, even commercially, as long as you give appropriate credit to the original author(s) and the source, provide a link to the Creative Commons license, and indicate if changes were made.

View: 3717
Download: 25
Times Cited: 0
Walter F. de Azevedo Jr.
Kevin Crampon ... Luiz Angelo Steffenel
Minyi Su, Enric Herrero