 Original Article

Affiliation:
Department of Physiology, Hypertension and Renal Center of Excellence, Tulane University School of Medicine, New Orleans, LA 70112, USA
Email: majid@tulane.edu
Affiliation:
Department of Physiology, Hypertension and Renal Center of Excellence, Tulane University School of Medicine, New Orleans, LA 70112, USA
Affiliation:
Department of Physiology, Hypertension and Renal Center of Excellence, Tulane University School of Medicine, New Orleans, LA 70112, USA
Affiliation:
Department of Physiology, Hypertension and Renal Center of Excellence, Tulane University School of Medicine, New Orleans, LA 70112, USA
Explor Med. 2022;3:205–218 DOI: https://doi.org/10.37349/emed.2022.00086
Received: December 13, 2021 Accepted: March 04, 2022 Published: April 26, 2022
Academic Editor: Lindsay A. Farrer, Boston University School of Medicine, USA
The article belongs to the special issue Angiotensins—A Century of Progress
Aim: Chronic high salt (HS) intake causes minimal changes in blood pressure (BP) but it induces augmented hypertensive response to angiotensin II (AngII) administration in rodents. The mechanism of this augmentation is not clearly understood. As tumor necrosis factor-alpha (TNF-α) induces natriuresis by activating TNF-α receptor type 1 (TNFR1) but not type 2 (TNFR2), we hypothesize that TNFR1 activity is reduced when HS is given in combination of AngII that leads to enhanced sodium retention and thus, causing augmented hypertension. The aim of this study is to examine the responses to chronic HS intake and AngII administration on the renal tissue protein expressions of TNFR1 and TNFR2 in mice.
Methods: Different groups of mice (n = 6–7 in each group) chronically treated with or without AngII (25 ng/min; implanted minipump) for 4 weeks which were fed either normal salt (NS; 0.4% NaCl) or high salt (HS; 4% NaCl) diets. Systemic BP was measured by tail-cuff plethysmography. At the end of treatment period, kidneys were harvested after sacrificing the mice with euthanasia. Immuno-histochemical analysis of TNFR1 and TNFR2 proteins in renal tissues was performed by measuring the staining area and the intensity of receptors’ immunoreactivities using NIS-Elements software. The results were expressed in percent area of positive staining and the relative intensity.
Results: HS intake alone did not alter mean BP (HS; 77 ± 1 vs. NS; 76 ± 3 vs. mmHg; tail-cuff plethysmography) but AngII induced increases in BP were augmented in HS group (104 ± 2 vs. 95 ± 2 mmHg; P < 0.05). The area of TNFR1 staining was higher in HS than NS group (6.0 ± 0.9% vs. 3.2 ± 0.7%; P < 0.05) but it was lower in AngII + HS than in AngII + NS group (5.0 ± 0.7% vs. 6.3 ± 0.7%; P = 0.068). TNFR2 immunoreactivity was minimal in NS and HS groups but it was high in AngII + NS and even higher in AngII + HS group.
Conclusions: These data suggest that the HS induced increased TNFR1 activity that facilitates enhanced sodium excretion is compromised in elevated AngII condition leading to salt retention and augmented hypertension.
Although high salt (HS) intake alone induces no or minimal changes in blood pressure (BP) [1–3], it augments the hypertensive and renal injury (RI) responses to elevated angiotensin II (AngII) levels [2, 4–6]. The exact mechanism for such augmented responses is not yet clearly understood [7]. Tumor necrosis factor-alpha (TNF-α), a pro-inflammatory cytokine that is generated by factors such as AngII and HS intake, has been implicated in hypertensive responses induced by these factors [8–17]. TNF-α exerts its biological responses via interaction with two cell surface receptors, TNF-α receptors type 1 (TNFR1) and type 2 (TNFR2) which are differentially expressed and regulated in the kidney [18, 19]. The activation of TNFR1 and TNFR2 triggers distinct signaling pathways upon TNF-α binding, which in turn results in a protective role as necrotic factor through apoptotic function on one hand, but also elicits cellular regenerative and proliferative responses that may promote tissue injury on the other hand [13]. While TNFR2 activation enhances inflammatory tissue injuries [20], TNFR1 activation induces natriuresis [3, 14, 21, 22] suggesting a counter-regulatory mechanism of this receptor in hypertension opposing salt retention [7, 13]. The mechanistic role for TNF-α and its receptors in hypertension induced by AngII and HS intake is not yet clearly defined [7].
AngII induced hypertension is attenuated in mice lacking the gene for TNF-α [23] or one of its main sources, T-lymphocytes [10] and also in rats treating with a TNF-α blocking agent [9, 16]. While such attenuation of AngII induced response could be linked to attenuation of nuclear factor-kappa B (NF-κB) activation by this cytokine [4, 23], TNF-α suppresses angiotensinogen (AGT) production in vitro in proximal tubule cells [24]. HS intake normally suppresses renin-angiotensin system [25] but paradoxically enhances renal generation of AGT in elevated AngII condition [4, 5, 26, 27]. Such AGT generation induced by both AngII and HS intake is shown to be exaggerated in TNFR1 knockout (KO) mice indicating a protective role of TNFR1 in the hypertensive response induced by AngII and HS intake [5]. In support of this notion, it has been shown that hypertensive response to chronic AngII is increased further in rats treated with TNF-α antiserum [28, 29] or in KO mice lacking TNFR1 [5, 30]. On the other hand, renal glomerulosclerotic and interstitial fibrotic responses induced by chronic AngII infusion with HS intake are attenuated in TNFR2 KO mice, indicating a contributory role for TNFR2 in AngII and salt induced renal injury [20]. These findings may indicate that a differential signal transduction via activation of these two receptors is mechanistically involved in the hypertension and associated renal injury induced by AngII and HS intake.
In the present study, it is examined the hypothesis that chronic elevation of AngII level induces a differential activation of TNF-α receptors such as a decrease in TNFR1 activation causing attenuated natriuretic response and an increase in TNFR2 activity causing enhanced proliferative kidney injury, leading to the development of salt induced exaggerated hypertension and associated renal injury. The activation of these receptors was assessed by evaluating the changes in the protein expressions of TNFR1 and TNFR2 in renal tissues collected from chronically treated animals with or without AngII and maintained on normal salt (NS) or a HS intake.
The experiments were performed using protocol approved by the Tulane University Animal Care and Use Committee. Male mice (C57BL6 strain), purchased from Jackson Laboratories (Bar Harbor, ME), were used in these experiments. These mice were housed in a temperature- and light-controlled room and allowed free access to standard diet (Ralston-Purina, St. Louis, MO) and water. The mice (aged 7–8 weeks; ∼25 g body weight) were kept in the facility for ∼10 days before the start of each experimental protocol.
These mice were randomly assigned to one of the following four groups:
NS group; with NS (NS; 0.3% NaCl) diets (n = 6)
HS group; with HS (HS; 4% NaCl) diets (n = 6)
AngII + NS group; AngII treatment with NS diets (n = 7)
AngII + HS group; AngII treatment with HS diets (n = 7)
The overall experimental protocol for these groups of mice has been illustrated in Figure 1.
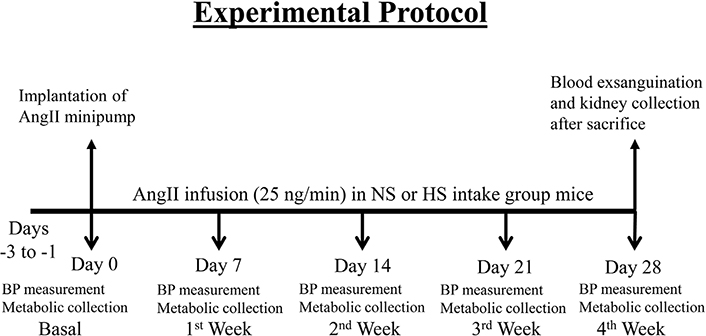
Experimental protocol for chronic studies with AngII infusion using minipump in mice given NS (NS; 0.3% NaCl) and HS (HS; 4% NaCl) containing diet
Systemic BP was measured using a tail-cuff plethysmograph (Visitech Systems, Napa Place, NC). This plethysmograph allows recordings of systolic and diastolic BPs, which allows calculation of mean BP (MBP) using its Analysis Software. Mice were trained for tail-cuff BP measurements 1 week before starting the experiments. After 2–3 days of acclimatization to the tail-cuff device, the basal systemic blood pressure (SBP) was measured in all the mice. Prior to the actual measurements in a particular day for weekly BP recordings, the mice were acclimatized with 3–5 cycles with putting the tail-cuff device on mouse tail. BP measurements were performed at the same time of the day (11 a.m. to 1 p.m.) to standardize for the influence of the circadian cycle on BP. The average BP was obtained by calculating the average readings of 10 measurements for a single trial. Average BP taken for 3 consecutive days (–3 to –1 day) prior to implantation of minipump for AngII infusion was considered as basal (0 day) control MBP. Then the BP measurements were repeated at the end of each week (day 7, day 14, day 21, and day 28) of the experimental period.
AngII was infused at a rate of 25 ng/min for a 4-week period in groups 3 and 4 using osmotic minipumps (Alzet, model 1002D; Durect, Cupertino, CA). During AngII infusion, the mice were given a HS diet (4% NaCl; Harlan Teklad, Madison, WI) and allowed to drink freely from the water bottles attached to the cages. For implantation of the osmotic minipump, the mice were anesthetized for a brief period using 2% isoflurane. The minipump containing AngII dissolved in 0.9% saline was implanted subcutaneously under the scapula through an incision in the mid-scapular region under sterile condition. The antibiotic, tetracycline (500 mg/L) was given in the drinking water one day before the surgery and continued for the 4-week duration of the experimental period.
Twenty-four-hour (h) urine samples were collected from conscious mice using metabolic cages on the day (–1 day) before the implantation of AngII minipump to establish basal (0 day) excretory parameters and then at the end of each week of the experiment. Animals were housed individually in metabolic cages, and urine was collected for 24 h into sterile tubes. Maximum precaution was taken to avoid contamination of urine with chow food debris by covering the urine collection tubes with cling film. Urine volumes were determined from each urine collection, and samples were centrifuged (3,000 rpm/5 min; 4°C) and preserved for analysis. Food and water intake along with the body weight of each mouse were measured during the experimental period. Urine concentrations of sodium and potassium were assessed by flame photometry. At the end of the 4-week experimental period, all the animals were euthanized under anesthesia with Inactin (Sigma-Aldrich, Germany, 150 μg/g of body weight) and the systemic blood was drained out (exsanguination) by carotid artery cannulation. After exsanguination, the kidneys were collected and kept in formalin for evaluation of TNF receptors protein expression and evaluation of the renal tissue injury.
Decapsulated kidneys were embedded in paraffin blocks, sectioned (5 μm), and mounted onto slides with Vectabond (Vector Laboratories, Burlingame, CA). Serial kidney sections were immunostained by the immunoperoxidase technique [5, 19, 31]. After dewaxing in xylene, the kidney sections were rehydrated in series with 100%, 95%, and 70% alcohol and treated with methanol and 0.3% H2O2 for 30 min to block peroxidase activity. Then kidney sections were washed and sequentially incubated with 1) normal blocking rabbit serum for 30 min, 2) primary antibodies [rabbit polyclonal anti-TNF receptor 1 antibody (catalog no. ab19139, Abcam, Cambridge, MA) or rabbit monoclonal anti-TNF receptor 2 antibody (catalog no. 3605-1, Epitomics, Burlingame, CA)] diluted in normal blocking serum (Vector Laboratories) at 1:1,000 and 1:200 for TNFR1 and TNFR2, respectively, overnight at 4°C, 3) secondary antibody [biotin-conjugated rabbit anti-mouse IgG (Vector Laboratories)] for 30 min, and 4) avidin DH (biotinylated horseradish peroxidase H complex) using the ABC Elite Vectastain kit (Vector Laboratories) for 30 min. Peroxidase activity was visualized with 0.1% 3,3’-diaminobenzidine tetrahydrochloride (DAB substrate kit for peroxidase, catalog no. SK-4100, Vector Laboratories). The slides were counterstained with hematoxylin (VWR International, West Chester, PA) and mounted using aqueous mounting medium (Triangle Biomedical Sciences, Durham, NC), and coverslips were applied. Specific immunoreactivity was quantified in 20 different microscopic fields per tissue section per animal with use of a Nikon Eclipse 50i microscope, a ×40 objective, and an integrated digital camera system for image processing. The intensity of TNFR1 and TNFR2 immunoreactivity in all kidney sections was analyzed using NIS-Elements Software AR (version 3.0 for Windows; Nikon), which allowed a computerized determination of the area of positive staining (μm) and the intensity of immunoreactivity (sum of density of positive tubules in an analyzed area). The results are expressed in arbitrary units of the relative intensity and normalized to the mean values of specific immunostaining observed in the control mice.
Formalin-fixed paraffin-embedded kidney sections were used for analyzing the degree of glomerulosclerosis using Periodic acid-Schiff (PAS) staining (Sigma Diagnostic; Fisher Scientific, catalog no. SD395B, Pittsburg, PA), and for assessment of interstitial fibrosis using Artisan Gomori’s Blue Trichrome staining (Agilent Technologies, Inc.; AR167; Santa Clara, CA), as indicated by the manufacturer. The extent of the interstitial fibrotic-positive area was evaluated quantitatively using computerized image analysis, as previously described [5, 20, 31, 32].
The extent of glomerulosclerosis was evaluated quantitatively in images captured of each glomerulus visualized with a ×40 magnification oil objective and PAS staining of renal sections. Mesangial expansion was quantified in 20 glomeruli per kidney section and then divide the PAS-positive stained area by the total area of the glomerulus. Values were expressed as means ± standard error (SE) of the 20 measurements in percentage values, as previously described [5]. Slides were photographed using a Nikon Eclipse 50i microscope equipped with a Nikon DS Camera Head (DS Fi1) and DS camera control unit (DSU2). The percentage area covered by sclerosis in the glomeruli in each field was analyzed using the NIS-Elements software (version 3.0) image analyzer in a blinded manner to avoid bias.
The extent of interstitial collagen-positive area (fibrosis) was quantitatively evaluated by an automatic image analysis of renal section occupied by interstitial tissue blue staining positively for collagen deposition as described previously [5, 20]. Briefly, formalin-fixed paraffin-embedded renal sections were sequentially processed in Bouin’s solution, Hematoxylin A and B, Gomori’s blue trichome staining and 0.5% acetic acid, as described by the manufacturers. Slides were photographed as described above and visualized with a ×40 magnification of renal sections. The percentage area covered by blue staining represents collagen deposition in each field and was analyzed using the Nikon 50i microscope and the NIS-Elements (AR version 3.0) software image analyzer in a blinded manner to avoid bias. Values of the percentage data obtained for each of the 20 captured analyzed images were averaged to obtain the percentage area of fibrosis for the entire slide.
Results were expressed as mean ± SE. All excretory values were normalized as units per gram of kidney weight. Statistical analysis was performed using Sigma stat software (Systat Software, Chicago, IL). Statistical analysis of the values within groups was conducted using the repeated measure analysis of variance (ANOVA). Comparison of the values (differences in basal and treatment period values) in different groups with that in control group was compared using one way ANOVA analysis. Differences are considered statistically significant at P < 0.05.
The basal MBPs were the same in these four groups of mice as demonstrated in Figure 2. HS intake alone for 4 weeks did not alter MBP (76 ± 2.7 to 76 ± 1.2 mmHg) which was not significantly different from that observed in NS group which was (75 ± 2.7 to 70 ± 2.2 mmHg). Chronic administration of AngII in mice with NS intake for 4 weeks increased MBP progressively over the course of the first 3 weeks (75 ± 1.3 to 95 ± 1.8 mmHg; P < 0.001). However, administration of AngII for 4 weeks in HS intake group induced increases in MBP (76 ± 1.3 to 103 ± 2.1 mmHg; P < 0.001) which were faster and significantly greater (103 ± 2.1 vs. 95 ± 1.8 mmHg; P < 0.02) than observed in AngII + NS group.
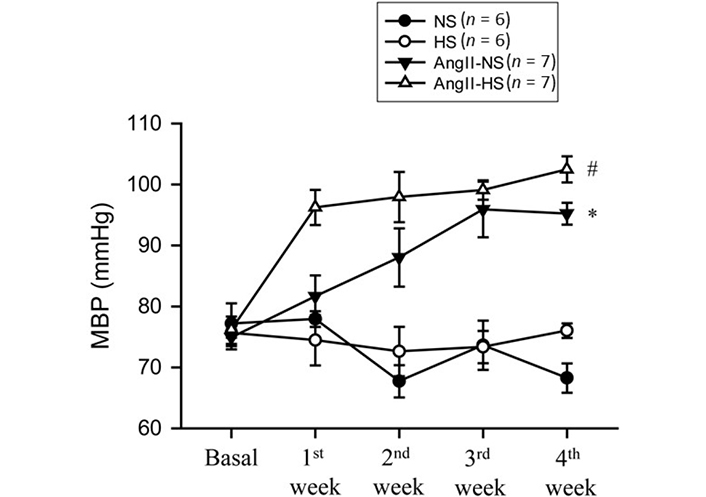
MBP responses to chronic AngII (25 ng/min) infusion in mice given NS (NS; 0.3% NaCl) and HS (HS; 4% NaCl) containing diets; *: P < 0.05 vs. NS; #: P < 0.05 vs. AngII-NS
The responses in renal excretory parameters are illustrated in Figures 3, 4 and 5. All groups had the same levels of V (Figure 3), urinary sodium excretion rate (UNaV) (Figure 4) and urinary potassium excretion rate (UKV) (Figure 5) at the start of the experimental protocol. During the 4 weeks of treatment, V or UNaV was not altered in NS group. However, there were moderate increases in V in HS group, accompanied by robust increases in UNaV in HS group. In contrast, UNaV was not altered in AngII-NS group during the experimental period, but there were increases in V in this group. However, both V and UNaV levels increased markedly in AngII-HS group, although UNaV level is significantly lower than in HS alone group. In contrast, UKV showed modest variability among the groups, but the changes were not significantly different from each other group during the experimental period. Water intake was higher in HS groups compared to NS groups (nontreated, 4.6 ± 0.5 vs. 1.4 ± 0.3 mL/24 h; P < 0.01 and AngII treated, 11.1 ± 2.1 vs. 6.8 ± 1.3 mL/24 h; P < 0.01) at the 4th week of experimental period. Food intake was comparatively higher in HS groups than in NS groups, but these intakes were not statistically different among nontreated and AngII treated groups (NS, 1.3 ± 0.2 vs. 1.6 ± 0.2 g/24 h and HS, 4.6 ± 0.6 vs. 3.1 ± 0.6 vs. g/24 h). Although the body weights in AngII treated groups were comparatively less than in nontreated group at the end of 4th week of experimental period, there was no difference among NS and HS groups in nontreated (23.8 ± 0.9 vs. 25.7 ± 0.8 g) and in AngII treated mice (20.7 ± 0.6 vs. 20.5 ± 0.4 g).
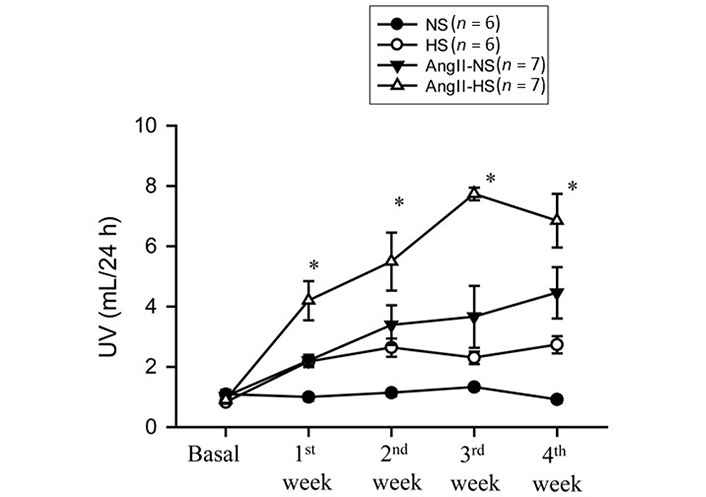
Urine flow (UV) responses to chronic AngII (25 ng/min) infusion in mice given NS (NS; 0.3% NaCl) and HS (HS; 4% NaCl) containing diets; *: P < 0.05 vs. AngII + N
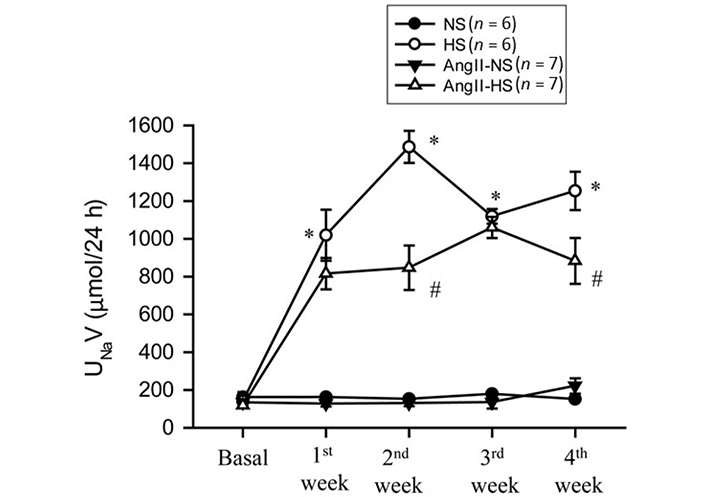
UNaV responses to chronic AngII (25 ng/min) infusion in mice given NS (NS; 0.3% NaCl) and HS (HS; 4% NaCl) containing diets. *: P < 0.05 vs. NS; #: P < 0.05 vs. HS
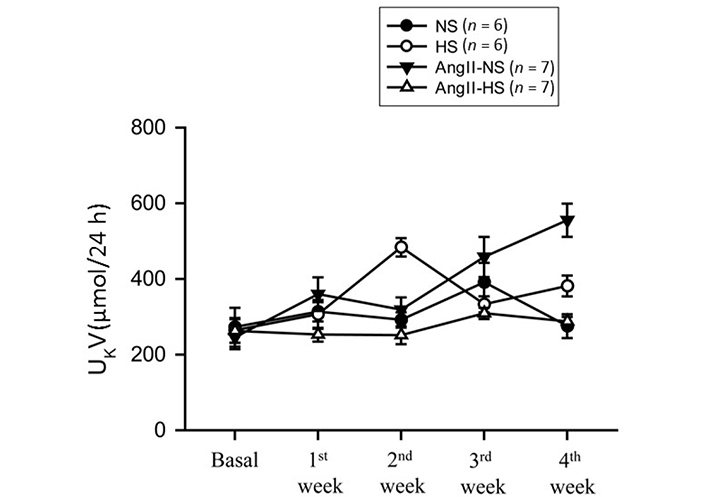
UKV responses to chronic AngII (25 ng/min) infusion in mice given NS (NS; 0.3% NaCl) and HS (HS; 4% NaCl) containing diets
The responses in the immunostainings for TNFR1 protein expressions at the end of the experimental period in these four groups of mice are illustrated in Figure 6. The representative images are shown in Figure 6A and Figure 6B illustrates the mean values of percent area of positive staining for TNFR1 protein expression. The area of TNFR1 staining was higher in HS than NS group (5.9 ± 1.2% vs. 3.2 ± 0.6% area of positive staining in the kidney slices; P < 0.05). This staining area was also higher in AngII + NS treated mice (6.3 ± 0.7% area of positive staining; P < 0.01) compared to only NS treated group. Although HS intake and AngII treatment both separately showed higher area of TNFR1 staining in renal tissues, combined AngII infusion and HS intake did not show further increases but showed slightly lower TNFR1 staining (5.2 ± 0.6%; P = 0.068) compared to AngII + NS intake group. Similar qualitative differences were also observed in relative intensity in protein expressions.
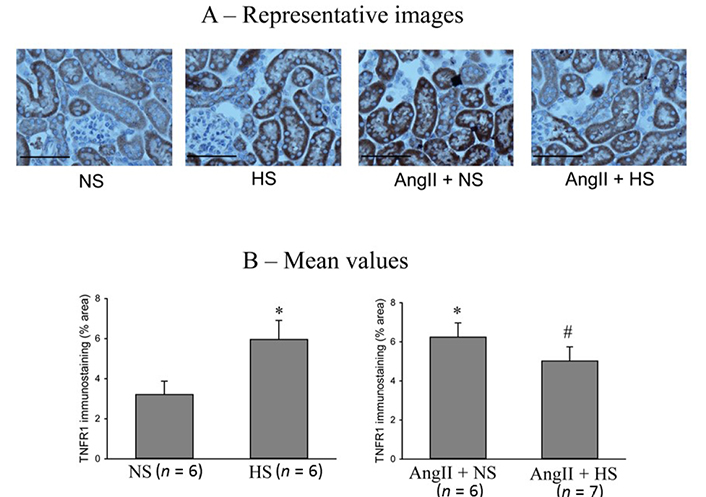
TNFR1 immunostainings in renal slices. (A) the representative images and (B) the mean values of percent area of positive staining for TNFR1 protein expression. The scale bar indicates 100 μm. *: P < 0.05 vs. NS; #: P = 0.068 vs. AngII + NS
The responses in the immunostainings for TNFR2 protein expressions at the end of the experimental period in these four groups of mice are illustrated in Figure 7. The representative images are shown in Figure 7A and Figure 7B illustrates the mean values of percent area of positive staining for TNFR2 protein expression. TNFR2 immunoreactivity was minimal in NS (0.45 ± 0.2% area of positive staining) and HS (0.5 ± 0.15% area of positive staining) groups. However, it was higher in AngII + NS group (2.2 ± 0.1% staining area; P < 0.05 vs. NS group) and even higher in AngII + HS group (2.7 ± 0.2% staining area; P < 0.05 vs. AngII + NS group). Similar qualitative differences were observed in relative intensity in protein expressions.
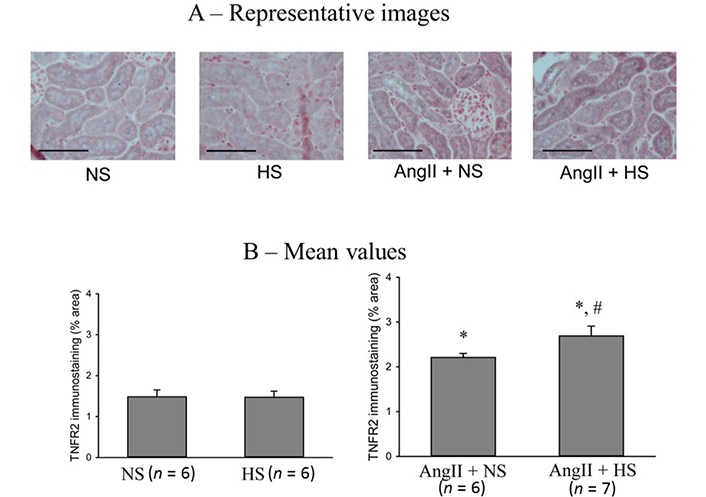
TNFR2 immunostainings in renal slices. (A) the representative images and (B) the mean values of percent area of positive staining for TNFR2 protein expression. The scale bar indicates 100 μm; *: P < 0.05 vs. NS; #: P < 0.05 vs. AngII + NS
The responses in the glomerulosclerotic changes in the kidney (PAS staining of renal slices) at the end of the experimental period in these four groups of mice are illustrated in Figure 8. The extent of glomerular sclerosis was evaluated by automatic image analysis of glomeruli in PAS-stained sections. The representative images are illustrated in Figure 8A and Figure 8B shows the mean values of percent area of PAS staining. The percent area of glomerulosclerosis in the renal tissues was not statistically different in HS intake group (0.6 ± 0.05%) compared to that in NS intake group (0.5 ± 0.1%). However, the percent area of glomerulosclerosis was significantly higher in AngII + NS intake group (6.7 ± 0.2%; P < 0.01) compared to NS alone group. This glomerulosclerosis lesion in AngII + HS intake group (10.3 ± 0.5%) which was significantly higher (P < 0.05) than that in AngII + NS intake group. These results demonstrate that chronic HS intake did not cause any glomerulosclerotic lesions when given alone but caused exaggerated glomerulosclerotic lesions when given in combination with AngII level [18, 33].
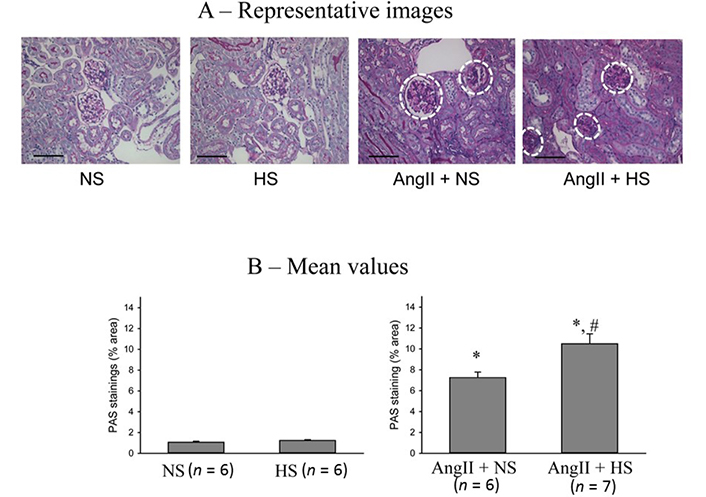
Glomerulosclerotic changes in the kidneys (PAS staining of renal slices). (A) the representative images of glomerulosclerotic changes (white dashed circle) and (B) the mean values of percent area of PAS staining. The scale bar indicates 100 μm; *: P < 0.01 vs. NS; #: P < 0.05 vs. AngII + NS
The responses in the renal interstitial fibrotic changes (Gomori’s trichrome staining of renal slices) at the end of the experimental period in these four groups of mice are illustrated in Figure 9. The extent of tissue fibrotic changes was evaluated by the collagen deposition in the interstitial tissue, which is revealed by the blue staining in kidney sections prepared using Gomori’s trichrome staining and analyzed by using a computer-aided semi-automatic quantification system. The representative images of tubular interstitial fibrotic changes (white arrow heads) are shown in Figure 9A and Figure 9B illustrates the mean values of percent area of trichrome staining. The percent area of fibrosis (collagen deposition) was minimal in both NS (0.3 ± 0.1%) and HS (0.4 ± 0.1%) intake group alone. However, the percent area of fibrotic lesions was significantly higher in AngII + NS intake group (3.8 ± 0.4%; P < 0.01) compared to that in NS alone group. The fibrotic lesions were even greater as in AngII + HS intake group (9.4 ± 1.5%; P < 0.05) than in AngII + NS intake group. These results demonstrate that chronic HS intake alone does not cause fibrotic lesions but causes exaggerated lesions when given concomitantly with AngII [5, 20].
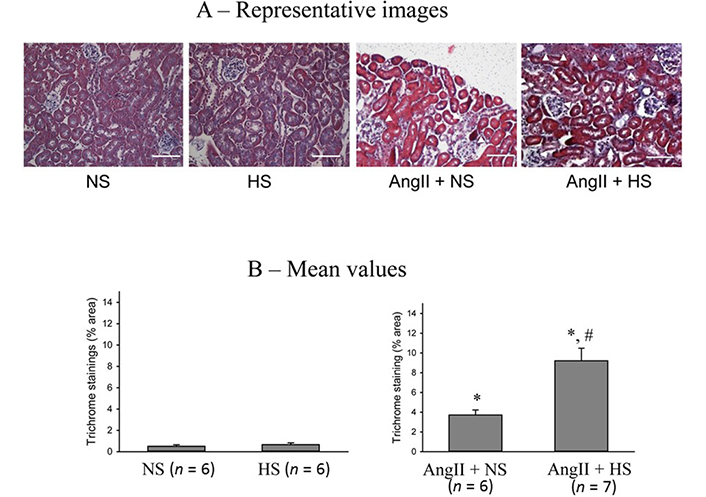
Renal interstitial fibrotic changes in the kidneys. (A) the representative images of renal slices using Gomori’s trichrome staining as denoted by white arrow heads and (B) the mean values of percent area of trichrome staining. The scale bar indicates 100 μm; *: P < 0.01 vs. NS; #: P < 0.05 vs. AngII + NS
As reported in many earlier studies [1, 2, 3, 32], chronic HS intake alone for 4 weeks in mice does not alter systemic BP. However, when HS intake was given together with the AngII infusion, it caused an exaggeration of the AngII induced hypertensive responses (Figure 2). Although the cause of such exaggerated AngII induced responses during HS intake may be multifactorial including dysregulation of intrarenal renin-angiotensin system and altered oxidative stress mechanism [7], an involvement of differential activities of TNF receptors in the kidney has also been suggested to play a role [7, 13, 31]. In support of our hypothesis, such HS induced exaggeration of the hypertensive response to AngII was associated with a decrease in TNFR1 protein expression and an increase in TNFR2 protein expression in the renal cortex compared to AngII + NS treated mice. Such decrease in TNFR1 protein expression in AngII + HS group compared to that in AngII + NS group, reduces sodium excretory responses [19, 21, 22, 33], leading to more salt retention which causes HS induced exaggerated hypertensive response to AngII. The present study demonstrated that chronic HS intake alone increases TNFR1 protein expression without any notable changes in TNFR2 expression. Such findings indicate that TNFR1 activity is enhanced during HS intake, which increases the urinary sodium excretion and maintains sodium homeostasis. Thus, BP remains unaltered in the HS intake group of mice. Although chronic AngII treatment increases TNFR1 protein expression, sodium excretion was not altered in AngII + NS group of mice compared to NS group as the natriuretic response to TNFR1 activation was counteracted by direct anti-natriuretic effects of AngII [7, 26, 33]. It was also demonstrated [5, 30] that chronic AngII infusion in KO mice lacking TNFR1 attenuates systolic BP indicating a protective role of TNFR1 in the Ang II induced hypertension. TNFR2 expression level is minimal in NS treated mice and remains unaltered in chronic HS intake group. However, chronic AngII treatment increases renal tissue level expression of TNFR2 protein, which increases further when HS is given with AngII treatment. As TNFR2 activation enhances inflammatory renal injury [20], the inflammatory renal injury parameters were increased in AngII + NS group and increased further in AngII + HS group. A previous study [5] demonstrated that the inflammatory renal injury induced by chronic Ang II and HS intake was markedly attenuated in KO mice lacking TNFR2, indicating a contributory role by TNFR2 in renal injury [5, 20]. Interestingly, HS intake alone did not alter TNFR2 protein expression, or cause renal injury as demonstrated in the present investigation.
Although HS intake alone enhances TNFR1 protein expression in the renal tissue, it reduces such expression when given with AngII administration. The mechanistic explanation of such contradictory findings is not yet clearly understood although both HS intake and AngII administration are known to induce oxidative stress condition [2, 4]. However, oxidative stress can both activate and inhibit the NF-κB pathway by targeting the upstream kinases [IkappaB kinase (IKK) and protein kinase B (Akt)], facilitating or inhibiting the degradation of IKK or modulates the nuclear translocation and DNA binding of the transcription factor by modifying the NF-κB heterodimers [34]. Depending on the degree of activation, the increase in NF-κB activity leads to apoptotic lesions to limit the expression of pro-oxidant as well as antioxidant genes [34]. Although a differential regulation of TNF receptors by oxidative stress levels has not been demonstrated yet, it is to be emphasized that oxidative stress level would be different in the conditions of HS intake with or without AngII administration [1, 3, 35]. HS intake alone induces superoxide (O2-) production in the kidney, coincidently it also induces nitric oxide (NO) production in the renal tissue [3, 32] and thus, the development of an oxidative stress condition would be considerably limited in HS intake alone group. In such condition, NF-κB formation would be low and thus, it would have facilitated upregulation of nuclear protein expression of TNFR1. AngII also induces both NO and O2- production [1] and thus, the similar upregulation of TNFR1 could be related to limited oxidative stress mechanism in AngII + NS group. However, when HS was given with AngII administration, the degree of oxidative stress condition was enhanced leading to activation of NF-κB which would lead to apoptotic lesions resulting in a reduction in the cellular expression of TNFR1, as observed in the present investigation. Further comprehensive studies using both in vivo and in vitro preparations with renal tissues and cultured tubular cells would be needed to confirm the mechanism of such reduction of TNFR1 protein expressions during HS intake in elevated AngII condition.
In the present investigation, the weekly changes in renal excretory parameters during treatment periods of chronic administration of AngII with or without HS intake also revealed some interesting findings. Firstly, these chronic changes in urine flow and sodium excretion seem unrelated to the usual pressure diuresis/natriuresis effects in these experimental mice. It is interesting to note that the sodium excretion was lower in AngII + HS group than HS group though BP was higher in the former than that in the latter group. These chronic studies also demonstrated that sodium excretion was not different between NS and AngII + NS groups though the BP was higher in AngII + NS group than NS group. Secondly, it was also noted that the changes in urine flow and sodium excretion did not occur in parallel in these different treatment groups. While sodium excretion was higher in HS intake group compared to AngII + HS treated group, the opposite pattern was noted in urine flow rate in these groups of mice. While urine flow was higher in AngII + NS group compared to NS alone group, the sodium excretion remained unchanged in both treatment groups. The reason for such disassociated responses to AngII and HS intake on urine flow and sodium excretion could be related to the differences in the secretion pattern in anti-diuretic hormone (ADH) in these different groups of mice. It was reported that the pro-inflammatory cytokines such as TNF can activate the hypothalamus to induce non-osmotic release of ADH, commonly known as arginine vasopressin (AVP) [36] and this response to TNF is mediated by TNFR1 activation in hypothalamus [28]. Although this present study has not examined the TNFR protein expressions pattern in hypothalamic tissues of these treated mice in the present investigation, it is conceivable that the changes in TNFR proteins would be similar in other tissues including hypothalamus. Thus, when TNFR1 protein expression/activity was increased during chronic HS intake alone, it increased sodium excretion but preventing paralleled water excretion by the kidney due to an increase in non-osmotic ADH release. However, the opposite occurred in AngII + HS group in which TNFR1 expression/activity was suppressed, so sodium excretion was lowered but water excretion was higher due to possible decrease in ADH secretion [28, 36]. Thus, it seems that chronic changes in urine flow and sodium excretion are more influenced by chronic adjustment in hormonal as well as neural factors, rather than the usually perceived pressure diuresis/natriuresis phenomenon which may be more represented in acute minute by minute short time dynamic changes in BP rather than considering as a long-term chronic phenomenon. Further experiments with appropriate protocol to measure plasma ADH and sodium levels would be needed to confirm this notion. While urine flow and sodium excretions were altered in different groups depending on the treatment received, potassium excretion showed a wide variability without noting any statistically significant changes in these experimental groups of mice (Figure 5). ANG II administration will have variable effects on potassium excretion depending on its effect on aldosterone secretion as well as on the concomitant changes in glomerular filtration rate (GFR), proximal tubular and collecting duct reabsorption [37].
In conclusion, these data suggest that the increases in TNFR1 activity due to HS alone facilitate salt excretion resulting in no changes in SBP. Such HS induced increase in TNFR1 activity was compromised in elevated AngII condition causing more salt retention and thus induced an exaggerated hypertensive response.
ADH: anti-diuretic hormone
AGT: angiotensinogen
AngII: angiotensin II
BP: blood pressure
HS: high salt
KO: knockout
MBP: mean blood pressure
NF-κB: nuclear factor-kappaB
NS: normal salt
PAS: Periodic acid-Schiff
TNFR1: TNF-α receptor type 1
TNF-α: tumor necrosis factor-alpha
UKV: urinary potassium excretion rate
UNaV: urinary sodium excretion rate
DSAM conceptualized and designed the study and AC performed the experiments, collected and analyzed the data. DSAM reviewed the processed data with statistical analysis, designed the final figures. MCP supervised all histological staining techniques used as well as evaluated renal histological findings by immunostaining images for TNF receptor protein expression, PAS staining and Gomori’s trichrome staining. DSAM wrote the manuscript and LGN and MCP contributed to reading and editing the manuscript. All the authors reviewed the manuscript, approved the final manuscript as submitted, and agreed to be accountable for all aspects of the work.
The authors declare that they have no conflicts of interest.
The experiments were performed using protocol approved by the Tulane University Animal Care and Use Committee.
Not applicable.
Not applicable.
The raw data supporting the conclusions of this manuscript will be made available by the authors, without undue reservation, to any qualified researcher.
This work was supported by National Heart Lungs Blood Institute (NHLBI, #66432) grants to DSAM; National Institute of General Medical Sciences IDeA Program (COBRE, P30GM103337) grant to LGN; and the National Institute of Diabetes and Diseases of the Kidney (DK104375) and the Tulane School of Medicine Faculty Funds to MCP. The funders had no role in study design, data collection and analysis, decision to publish, or preparation of the manuscript.
© The Author(s) 2022.
Copyright: © The Author(s) 2022. This is an Open Access article licensed under a Creative Commons Attribution 4.0 International License (https://creativecommons.org/licenses/by/4.0/), which permits unrestricted use, sharing, adaptation, distribution and reproduction in any medium or format, for any purpose, even commercially, as long as you give appropriate credit to the original author(s) and the source, provide a link to the Creative Commons license, and indicate if changes were made.

Rafael Luzes ... Adalberto Vieyra
Natalia L. Rukavina Mikusic ... Mariela M. Gironacci
Gian Paolo Rossi ... Teresa Maria Seccia
Sukhwinder K. Bhullar ... Naranjan S. Dhalla
Kristin E. Reeve ... Babbette LaMarca
Eran S. Zacks ... Richard B. Devereux
Casper N. Bang ... Peter M. Okin
Casper N. Bang ... Peter M. Okin
Marcello Chinali ... Richard B. Devereux
