Original Article

Affiliation:
1Greenberg Division of Cardiology, Weill Cornell Medicine, New York, NY 10021, USA
2Department of Advanced Biomedical Sciences, University of Naples Federico II, 80131 Naples, Italy
3Division of Cardiology, Bambino Gesù Children’s Hospital–IRCSS, 001655 Rome, Italy
4Division of Cardiovascular Medicine, Department of Medicine, University of Massachusetts Medical School, Worcester, MA 02241, USA
Affiliation:
4Division of Cardiovascular Medicine, Department of Medicine, University of Massachusetts Medical School, Worcester, MA 02241, USA
Affiliation:
5Department of Clinical Science, University of Bergen, 5021 Bergen, Norway
ORCID: https://orcid.org/0000-0003-4109-2311
Affiliation:
1Greenberg Division of Cardiology, Weill Cornell Medicine, New York, NY 10021, USA
ORCID: https://orcid.org/0000-0001-5861-1478
Affiliation:
1Greenberg Division of Cardiology, Weill Cornell Medicine, New York, NY 10021, USA
Affiliation:
6Department of Cardiology, Ullevaal Hospital, University of Oslo, 0407 Oslo, Norway
Affiliation:
6Department of Cardiology, Ullevaal Hospital, University of Oslo, 0407 Oslo, Norway
7Division of Cardiovascular Medicine, University of Michigan, Ann Arbor, MI 48109, USA
ORCID: https://orcid.org/0000-0003-2389-0272
Affiliation:
7Division of Cardiovascular Medicine, University of Michigan, Ann Arbor, MI 48109, USA
Affiliation:
1Greenberg Division of Cardiology, Weill Cornell Medicine, New York, NY 10021, USA
2Department of Advanced Biomedical Sciences, University of Naples Federico II, 80131 Naples, Italy
ORCID: https://orcid.org/0000-0001-8567-9881
Affiliation:
1Greenberg Division of Cardiology, Weill Cornell Medicine, New York, NY 10021, USA
Email: rbdevere@med.cornell.edu
Explor Med. 2022;3:160–172 DOI: https://doi.org/10.37349/emed.2022.00082
Received: November 21, 2021 Accepted: January 31, 2022 Published: April 02, 2022
Academic Editor: Carlos M. Ferrario, Wake Forest School of Medicine, USA
The article belongs to the special issue Angiotensins—A Century of Progress
Aim: While it is commonly thought that left ventricular (LV) systolic function may insidiously deteriorate in hypertensive patients, few prospective data are available to support this notion.
Methods: We evaluated 680 hypertensive patients (66 ± 7 years; 45% women) with electrocardiographic (ECG)-LV hypertrophy (ECG-LVH) enrolled in the Losartan Intervention For Endpoint reduction in hypertension (LIFE) echo-sub-study free of prevalent cardiovascular disease and with baseline ejection fraction (EF) ≥ 55%. Echocardiographic examinations were performed annually for 5 years during anti-hypertensive treatment. Development of reduced systolic function was defined as incident EF < 50%.
Results: During a mean follow-up of 4.8 ± 1 years, 37 patients developed reduced EF without an inter-current myocardial infarction (5.4%). In analysis of covariance, patients who developed reduced EF were more often men, had greater baseline LV diameter and LV mass, lower mean EF (all P < 0.05), and similar diastolic function indices. At the last available examination before EF reduction, independently of covariates, patients with reduced EF showed a significant increase in left atrium (LA) size, LV diameter, end-systolic stress and mitral E/A ratio, as compared to those who did not develop reduced EF (all P < 0.05). In time-varying Cox regression analysis, also controlling for baseline EF, predictors of developing reduced EF were higher in-treatment LV diameter [hazard ratio (HR) = 5.19 per cm; 95% confidence interval (CI): 2.58–10.41] and higher in-treatment mitral E/A ratio (HR = 2.37 per unit; 95% CI: 1.58–3.56; both P < 0.0001).
Conclusions: In treated hypertensive patients with ECG-LVH at baseline, incident reduced EF is associated with the development of dilated LV chamber and signs of increased LV filling pressure (ClinicalTrials.gov identifier: NCT00338260).
The development of hypertensive left ventricular hypertrophy (LVH) is thought to be a compensatory process, which preserves ejection fraction (EF) in the presence of increased cardiac workload [1]. However, in animal models LVH has been found to be associated with systolic dysfunction and overt heart failure, even in the absence of myocardial infarction [2]. By contrast, in humans, whether and how hypertensive LVH results in systolic dysfunction is not well understood. A popular notion holds that left ventricular (LV) dysfunction may develop insidiously in the absence of myocardial infarction (the ‘burnt-out’ hypertensive heart). To date, few clinical studies have allowed serial examination of systolic and diastolic LV function in the course of treatment of hypertension or to examine previous cardiac geometry and function in patients destined to develop systolic dysfunction. The Losartan Intervention For Endpoint reduction in hypertension (LIFE) echocardiographic sub-study permitted such a serial study of LV structure and function among hypertensive adults. Accordingly, the current analysis aimed to investigate 1) the incidence of reduced EF in hypertensive patients who were free of clinical coronary artery disease and had a normal EF at the inception of the study and 2) to identify the echocardiographic predictors of reduced EF in a population of hypertensive patients with electrocardiographic (ECG)-LVH.
The LIFE echocardiography sub-study evaluated 960 patients with stage II–III hypertension. To qualify for LIFE, subjects had a screening ECG that demonstrated LVH, by either gender-adjusted Cornell voltage duration criteria or Sokolow–Lyon voltage criteria, as previously described [3, 4]. Patients with an aortic valve mean pressure gradient > 20 mmHg, symptomatic heart failure, or known LV EF < 40% were excluded from the study. The design of the LIFE study has been previously reported [3, 4]. Physical examination, laboratory testing, 12-lead ECG and standard echocardiogram, including color Doppler, were performed annually for five years during either losartan- or atenolol-based anti-hypertensive treatment [4].
For the purpose of the present study, prevalent cases of cardiovascular disease, including myocardial infarction, coronary artery disease, and congestive heart failure were excluded as well as reduced EF < 55% at baseline and aortic/mitral regurgitation (> 1+) or stenosis of any degree identified by Doppler echocardiography at baseline or during follow-up. The present analysis was therefore performed in 680 hypertensive patients (66 ± 7 years; 45% women) meeting eligibility criteria (Table 1). An independent endpoint committee adjudicated inter-current fatal and nonfatal myocardial infarction according to definitions provided in the LIFE study predefined endpoint manual [4]. The specific study endpoint for the present analysis was the development of reduced systolic function, defined as EF < 50% at the end of the study, representing a reduction from baseline of at least five EF points. In order to discriminate clearly from baseline EF values, we did not use a more recently applied sex specific EF reduction of < 52% in men and < 54% in women with uncomplicated hypertension.
Baseline clinical and laboratory characteristics of study population dichotomized by incident reduced EF
| Variable | Normal EF (n = 643) | Reduced EF (n = 37) | P |
|---|---|---|---|
| Age (years) | 65.8 ± 7.0 | 64.9 ± 6.4 | 0.440 |
| Sex (% women) | 45.9 | 27.8 | 0.038 |
| Ethnicity (% Caucasian) | 83.5 | 86.5 | 0.743 |
| Systolic BP (mmHg) | 174 ± 21 | 169 ± 23 | 0.236 |
| Diastolic BP (mmHg) | 95 ± 12 | 96 ± 10 | 0.585 |
| Heart rate (beats/min) | 67.4 ± 11.6 | 67.0 ± 13.8 | 0.870 |
| Body mass index (kg/m2) | 27.1 ± 4.1 | 28.0 ± 4.5 | 0.258 |
| Type 2 diabetes mellitus (%) | 9.3% | 10.8% | 0.776 |
| History of COPD (%) | 2.5% | 2.7% | 0.935 |
| History of atrial fibrillation (%) | 2.2% | 4.4% | 0.214 |
| Smoking (%) | 20.4 | 24.3 | 0.535 |
| Serum creatinine (μmol/L) | 88.8 ± 22.8 | 90.9 ± 14.2 | 0.413 |
| Fasting glucose (mmol/L) | 5.9 ± 2.3 | 6.5 ± 3.3 | 0.260 |
| Total cholesterol (mmol/L) | 6.0 ± 1.1 | 6.1 ± 1.1 | 0.596 |
| HDL-cholesterol (mmol/L) | 1.6 ± 0.5 | 1.6 ± 0.5 | 0.790 |
| Serum Na+ (mmol/L) | 140.2 ± 2.3 | 140.5 ± 2.2 | 0.362 |
| Serum K+ (mmol/L) | 4.2 ± 0.4 | 4.1 ± 0.4 | 0.690 |
| Treatment arm (% losartan) | 51 | 59 | 0.315 |
BP: blood pressure; COPD: chronic obstructive pulmonary disease; HDL: high-density lipoprotein
Echocardiography was performed following a standardized imaging protocol which included 2-dimensionally guided M-mode echocardiograms and selected 2-dimensional and Doppler recordings as previously reported [5]. All echocardiograms were transferred to the Echocardiographic Laboratory of Weill Cornell Medical College for central reading.
Measurements were performed off-line by junior readers, and quality assured by the same, highly-experienced reader, blinded to clinical data, using computerized review station with digitizing tablet and monitor screen overlay for calibration. Reliability of measurements of both LV geometry and LV functional parameters performed by the laboratory has been previously extensively reported [6].
LV mass was calculated using anatomically validated methods [7, 8] and normalized by height to the allometric power of 2.7. Partition values to define LVH were 49.2 g/m2.7 for men and 46.7 g/m2.7 for women [9]. Relative wall thickness was calculated as posterior wall thickness in diastole/LV internal radius [10]. LV EF was calculated using the Teichholz method [11].
Left atrial diameter was measured in the parasternal long-axis view at end-systole [12]. Circumferential end-systolic wall stress, a measure of myocardial afterload, was measured assuming a cylindrical LV geometry [13].
As previously described [14], diastolic transmitral blood flow velocity was measured at the mitral leaflet tips. The leading edge of the transmitral Doppler flow pattern was traced to derive the peak of early diastolic and atrial phase LV filling (“E” and “A”, respectively), and the deceleration time of early diastolic LV filling. Isovolumic relaxation time was measured as the time interval between aortic valve closure and mitral valve opening.
In the main double-blinded LIFE study BP was measured as the average of two recordings with a 1-min interval after patients had been quietly seated for 5 min in the morning hours at through at all regular study visits. Investigators had been directed to use a validated, calibrated manual BP manometer maintained in good condition and a cuff of proper size. The arm was positioned so that the location of the stethoscope head was kept at the level of the heart.
In the echocardiographic sub-study, BP was also measured standardized in the beginning of the annual examination as the average of two recordings with a 1-min interval after a 5 min of quiet rest in the supine position using a manual sphygmomanometer or a semiautomatic sphygmomanometer (Dinamap Model 1846 SX, Critikon, Johnson & Johnson Medical Inc., USA).
Data were expressed as mean ± standard deviation (SD) for continuous variables and as percentages for categorical variables. Patients were categorized into two groups according to the presence of incident EF reduction. Groups were compared by Student’s t-test for continuous variables, chi-square for categorical variables and analysis of covariance (ANCOVA) for echocardiographic variables, controlling for relevant confounders. Significant changes in echocardiographic variables over time were expressed as percentage changes from baseline and compared among groups by ANCOVA, adjusting for age, gender and changes over time in heart rate and systolic BP. Time-varying covariate Cox regression analyses were used to identify in-treatment echocardiographic predictors of EF reduction. The last available echocardiogram before reduced EF occurred was used in these models. To assure stability of the time-varying covariate Cox regressions, models were set to have the ratio of number of covariates to number of end points ≈ 1:10. Accordingly, a propensity score variable was obtained through a preliminary logistic regression for baseline EF from anthropometric and clinical data (including age, gender, body mass index, heart rate, systolic and diastolic BP) [15, 16]. A propensity score was included mainly to ensure reduced possibility for selection bias and thus perform optimal statistical analysis in light of the small no. of 37 patients who developed reduced systolic function. The resulting variable was added to the time-varying Cox regression model together with baseline EF, treatment arm, and in-treatment time-varying systolic BP to represent the influence of BP control. Subsequently, non-significant covariates from the previous model were replaced by in-treatment time-varying heart rate, and in-treatment echocardiographic parameters by a stepwise procedure [including in-treatment time-varying LV mass, in-treatment LV diastolic diameter, in-treatment left atrium (LA) diameter, in-treatment mitral E/A ratio and in-treatment mitral E wave deceleration time] to identify echocardiographic predictors of EF reduction.
During a mean follow-up of 4.8 ± 1 years, 41 patients (6%) developed reduced EF. In four of these 41 patients (10 %) an inter-current myocardial infarction was recorded; accordingly, these patients were excluded from further analysis. Analyses from adverse event database could neither detect any concomitant diseases that could explain reduction in EF.
As shown in Table 1, the remaining 37 patients who developed reduced EF without clinically detected myocardial infarction were mostly men (72 %). Compared to patients who did not develop reduced EF (n = 643), those with incident reduced EF had similar baseline age, body mass index, heart rate, and mean systolic and diastolic BP. No difference was found between groups in randomized treatment, prevalence of diabetes, atrial fibrillation, chronic obstructive pulmonary disease, or in laboratory data, including fasting glucose, serum creatinine, total or HDL-cholesterol, or serum electrolytes [all P = not significant (NS)].
ANCOVA for echocardiographic baseline characteristics, adjusting for differences in age, gender, systolic BP and heart rate is shown in Table 2. Patients with subsequent reduced EF had higher LV diameter, LV mass and prevalence of LVH, and lower EF at baseline (all P < 0.05), without significant differences in relative wall thickness, LV midwall shortening, end-systolic stress (ESS), LA diameter or indices of diastolic function compared to patients who did not develop reduced EF.
Baseline echocardiographic characteristics of study population dichotomized by incident reduced EF
| Variable | Normal EF (n = 643) | Reduced EF (n = 37) | P |
|---|---|---|---|
| LV diameter (cm) | 5.14 ± 0.48 | 5.42 ± 0.65 | 0.001 |
| LV diameter/height (cm/m) | 3.04 ± 0.27 | 3.18 ± 0.29 | 0.004 |
| Relative wall thickness | 0.42 ± 0.06 | 0.40 ± 0.06 | 0.100 |
| LV mass index (g/m2.7) | 54.1 ± 9.8 | 57.7 ± 11.6 | 0.037 |
| LVH (%) | 67 | 87 | 0.017 |
| EF (%) | 64.8 ± 5.2 | 62.2 ± 5.0 | - |
| Midwall shortening (%) | 16.1 ± 1.8 | 15.9 ± 1.5 | 0.417 |
| ESS (kdynes/cm2) | 166.5 ± 34.2 | 171.0 ± 41.5 | 0.285 |
| LA diameter (cm) | 3.88 ± 0.49 | 3.93 ± 0.68 | 0.650 |
| Mitral E/A ratio | 0.84 ± 0.32 | 0.89 ± 0.40 | 0.508 |
| E deceleration time (ms) | 219.0 ± 62.7 | 232.1 ± 72.3 | 0.199 |
| Isovolumic relaxation time (ms) | 113.4 ± 22.8 | 114.6 ± 22.1 | 0.761 |
ANCOVA with mean values adjusted for differences in age, gender, systolic BP and heart rate. E/A ratio: the ratio of peak early (E) to late (A) diastolic transmitral blood velocity; E deceleration time: the time interval from the peak of the E wave to its projected baseline indicating the duration for equalizing the pressure difference between the LA and the left ventricle. -: P-values not calculated for components of self-reported cardiovascular diseases at baseline
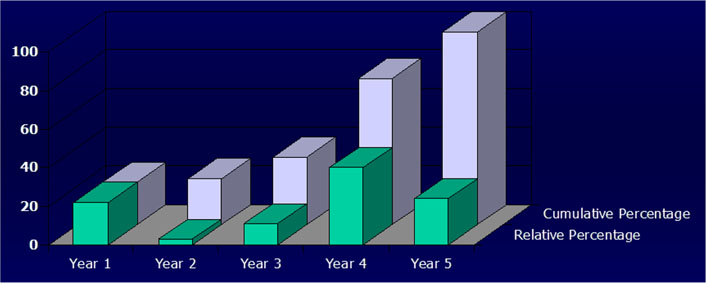
The timeframe for the development of reduced EF in the study sample is shown in Figure 1. As shown, approximately 70% of patients who developed reduced EF had a normal EF through the 3rd year of follow-up, while nine (24%) patients showed signs of systolic dysfunction within the first 2 years of the study. Patients who developed reduced EF had an average EF reduction of 18% (ranging from –6% to –34%).
Data from the last echocardiographic examination available before the EF reduction or at study end in patients with maintained EF are included in Table 3. Despite similar reduction in mean systolic and diastolic BP, patients with reduced EF showed significantly greater mean increase in LA size (+7.9% vs. –1.0%), LV diameter (+7.2% vs. +3.8%), ESS (+20.8% vs. +10.6%) and mitral E/A ratio (+48.4% vs. +15.5%, all P < 0.05) compared to patients who did not develop reduced EF. These changes were independent of gender, or changes in BP and heart rate. Parallel trends in LV mass and isovolumic relaxation time in the two groups did not attain statistical significance.
Follow-up BP and echocardiographic findings in study population dichotomized by incident reduced EF
| Variable | Normal EF (n = 643) | Reduced EF | P§ | ||
|---|---|---|---|---|---|
| Last visit | Δ% | Last visit | Δ% | ||
| Systolic BP (mmHg) | 147 ± 20 | –15.6 | 141 ± 21 | –16.5 | 0.718 |
| Diastolic BP (mmHg) | 80 ± 11 | –13.2 | 80 ± 12 | –12.2 | 0.572 |
| LV diameter (cm) | 5.31 ± 0.45 | +3.8 | 5.73 ± 0.59 | +7.2 | 0.022# |
| Relative wall thickness | 0.33 ± 0.05 | –20.3 | 0.30 ± 0.05 | –24.3 | 0.076# |
| LV mass index (g/m2.7) | 45.9 ± 8.8 | –15.8 | 51.3 ± 11.3 | –11.2 | 0.255# |
| EF (%) | 62.9 ± 5.1 | –3.0 | 57.9 ± 4.6 | –6.9 | 0.05# |
| Midwall shortening (%) | 17.3 ± 1.6 | +8.7 | 15.0 ± 2.3 | –5.6 | 0.001# |
| ESS (kdynes/cm2) | 179.5 ± 37.5 | +10.6 | 205.1 ± 48.0 | +20.8 | 0.001# |
| LA diameter (cm) | 3.80 ± 0.55 | –1.00 | 4.14 ± 0.74 | +7.86 | 0.001# |
| Mitral E/A ratio | 0.91 ± 0.32 | +15.5 | 1.24 ± 0.98 | +48.4 | 0.001# |
| E deceleration time (ms) | 250.2 ± 66.1 | +20.4 | 234.8 ± 81.9 | +1.0 | 0.011# |
| IVRT (ms) | 95.0 ± 21.0 | –13.2 | 96.4 ± 21.3 | –13.1 | 0.974# |
* On last examination before reduced EF documented; § ANCOVA for differences in % change from baseline; # Mean values adjusted for differences in gender, and BP and heart rate study changes; IVRT: isovolumic relaxation time
Time-varying Cox regression models for the development of reduced EF are included in Table 4. As is shown in Table 4A, a preliminary model included the propensity score for baseline EF derived from clinical characteristics, treatment arm, baseline EF and in-treatment systolic BP. The propensity score, randomized treatment and in-treatment systolic BP were not significantly associated with increased risk of reduced EF. Accordingly, these covariates were replaced in the following models by in-treatment heart rate and by in-treatment echocardiographic parameters. The final model is shown in Table 4B. Independently of baseline EF and of the significant impact of in-treatment heart rate, the strongest predictors for the development of reduced EF were higher in-treatment LV diameter [hazard ratio (HR) = 5.19 per cm; 95% confidence interval (CI): 2.58–10.41] and higher in-treatment mitral E/A ratio (HR = 2.37 per unit; 95% CI: 1.58–3.56; both P < 0.0001). In separate models, excluding in-treatment LV diameter, borderline significant impacts could also be detected for in-treatment LA diameter (HR = 1.67; 95% CI: 1.05–2.72; P = 0.032) without significant association with in-treatment LV mass or in-treatment mitral E wave deceleration time.
Time varying Cox-regression models for EF reduction
| A. Preliminary model | |||
|---|---|---|---|
| Variable | HR | 95% CI | P |
| Clinical propensity score | 1.02 | 0.99–1.09 | 0.251 |
| Treatment arm (losartan) | 0.74 | 0.37–1.52 | 0.414 |
| Baseline EF (%) | 0.88 | 0.20–0.95 | 0.001 |
| In-treatment systolic BP (mmHg) | 0.98 | 0.97–1.01 | 0.083 |
| B. Final model | |||
|---|---|---|---|
| Variable | HR | 95% CI | P |
| In-treatment heart rate (10 beats/min) | 1.3 | 1.1–1.5 | 0.004 |
| Baseline EF (%) | 0.95 | 0.88–1.02 | 0.152 |
| In-treatment LV diameter (cm) | 5.19 | 2.58–10.41 | 0.0001 |
| In-treatment mitral E/A ratio (per unit) | 2.37 | 1.58–3.56 | 0.0001 |
Our data suggest a possible pathophysiological progression leading from hypertension to overt LV systolic dysfunction, suggested by the changes in echocardiographic parameters occurring in the sample patient shown in Table 5. After one year of anti-hypertensive treatment a reduction in LV diameter and LV mass occurred. However, after three years, despite normal EF (57%) the LV significantly dilates, ESS increases, and signs of increased LV filling pressures can be identified (increased mitral E/A ratio and LA diameter), preceding the reduction in EF to 47% occurring at year 4. These data suggest a mechanism, shown schematically in Figure 2, whereby chronic pressure overload hypertrophy eventually gives rise to increased heart size and ESS, and begets LV dysfunction.
Echocardiographic changes in a study patient developing reduced EF at year 4 (age = 67 years, body mass index = 31kg/m2, baseline BP = 148/85 mmHg)
| Variable | Baseline | Year 1 | Year 2 | Year 3 | Year 4 |
|---|---|---|---|---|---|
| LVIDD (cm) | 6.2 | 5.7 | 5.8 | 6.5 | 6.9 |
| LVMi (g/m2) | 133 | 119 | 101 | 111 | 140 |
| EF (%) | 60 | 58 | 61 | 57 | 47 |
| Mitral E/A ratio | 1.06 | 1.05 | 1.25 | 1.69 | 1.89 |
| LA diameter (cm) | 5.0 | 4.9 | 5.0 | 5.6 | 5.9 |
| ESS (kdynes/cm2) | 185 | 178 | 188 | 276 | 337 |
LVIDD: LV diameter in diastole; LVMi: LV mass indexed for body surface area (* normalized by height to the allometric power of 2.0 in this sample patient)
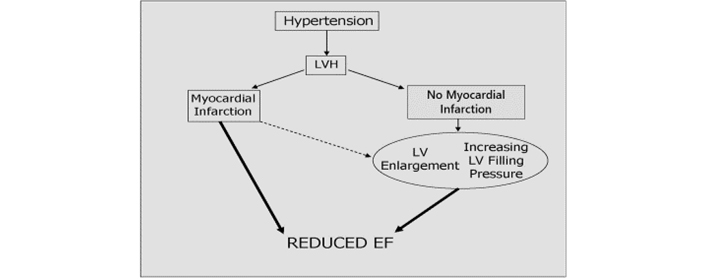
Proposed pathophysiological pathway leading from hypertension to LV systolic dysfunction
This study was performed to better understand the development of systolic dysfunction among patients with hypertension and ECG-LVH who have not experienced a myocardial infarction. We found that new systolic dysfunction 1) is rare in these patients, occurring in < 6% over 6 years, and 2) associated with larger LV chamber size and higher LV mass index at baseline, and 3) preceded by progressive chamber enlargement, and increases in myocardial afterload and filling pressure.
Compared to previous studies, the incidence of EF reduction in the current study was lower than expected [17–20], especially considering the high-risk phenotype of patients enrolled in LIFE [4]. However, all patients participated in a treatment outcome trial. Thus, the low incidence of reduced EF in LIFE could perhaps in part be explained by the aggressive BP reduction in this population, which might have mitigated the incidence of reduced EF.
While it is well known that hypertension has a high attributable risk for the development of heart failure and that hypertension is associated with both systolic and diastolic heart failure [21], very few data are available in humans, which track the development of LV dysfunction. To our knowledge, this is the first report, which describes the serial changes in cardiac geometry and function that precede reduction in EF, in the absence of acute myocardial infarction. Recent reports from both clinical settings [20] and population studies [17] have shown that up to 4% to 14% of hypertensive patients may have clinically silent left ventricular systolic dysfunction. Hypertensive patients with reduced EF, although asymptomatic, have a significantly higher risk of cardiovascular events and incident congestive heart failure [20]. Even an incidence of new LV systolic dysfunction of 1.2% per year in the millions of hypertensive adults without overt coronary heart disease would contribute a large number of individuals annually who are at high risk of overt heart failure.
The major correlates of reduced EF in previous reports have been male gender and increased LV mass. In the HyperGEN study [17], reduced EF also related to higher body mass index and black race, while in a clinical report by Verdecchia et al. [20] cigarette smoking and higher heart rate were additional correlates of reduced EF. These findings have been also supported by evidence from the Cardiovascular Heart Study that baseline LV mass was the strongest predictor of future EF reduction [18]. Analyses of baseline characteristics partially confirm these previous findings. In our group of hypertensive patients, development of reduced EF related to male gender, higher LV mass and LVH prevalence at baseline. In contrast, the development of reduced EF did not relate to body mass index, ethnicity, smoking, or baseline heart rate. A potential relation to atrial fibrillation may have been underpowered in as much as history of AF was 2.2% vs. 4.4%, (P = 0.214), respectively, and there was no difference in LA diameter 3.88 vs. 3.93 cm (Table 2).
The independent role of myocardial infarction is an issue that confounds the understanding of LV dysfunction in hypertensive heart disease. In fact, the notion that hypertensive patients with normal EF develop overt systolic dysfunction in the absence of an inter-current myocardial infarction has previously not been documented. Rame and colleagues [19] showed that approximately 18% of hypertensive patients with LVH developed reduced EF during a median 4-year follow-up. However, patients included in that report had high prevalence of diabetes mellitus as well as coronary heart disease, and high incidence of myocardial infarction. Accordingly, major determinants of future EF reduction were the presence of either prevalent cardiovascular disease (coronary artery disease or pulmonary edema) or an inter-current myocardial infarction. It is for this reason that, in the present report, patients with prevalent overt cardiac disease were excluded at the outset. Of note, when prevalent coronary disease was excluded only 10% of patients with incident EF reduction had an inter-current myocardial infarction. Thus, while the incidence of reduced EF is low, there are few studies with which to compare incidence, once inter-current myocardial infarction and prevalent coronary artery disease have been excluded [22, 23].
It has been asserted that symptomatic diastolic dysfunction generally precedes overt systolic dysfunction in hypertensive patients [24]. By contrast, reports have demonstrated that systolic dysfunction may also occur in asymptomatic hypertensive patients without history of coronary heart disease, and that this condition is associated with poor prognosis [20]. Interestingly, in LIFE patients without an inter-current myocardial infarction, significant changes in LV geometry and diastolic function appear to precede the reduction in EF. LV EF reduction was preceded by a significant increase in LV chamber size, and an associated marked increase in ESS. These findings confirm previous work in both animals [25], and humans [19], which have reported that greater LV internal dimension represents a risk factor for congestive heart failure in the absence of acute myocardial infarction, suggesting that the reduction in EF is, at least partially, afterload-related [26]. Stated another way, if one excludes patients with concurrent coronary heart disease, there is a small percentage of hypertensive patients destined to develop systolic dysfunction; these individuals might be identified by larger chamber size [22, 25], suggesting chronic overload, or inappropriately high LV mass [18, 23, 27]. Despite aggressive BP treatment these individuals experience unfavorable remodeling characterized by increased chamber volume, increased ESS, and eventually reduced EF.
There is also contrasting hemodynamic mechanisms between atenolol and losartan [28]. Stroke volume index and cardiac index are higher on atenolol treatment whereas the systolic performance in patients treated with losartan is higher due to better reduction in LV mass and better reduction in total peripheral resistance.
As demonstrated, a significant increase in LA size and worsening in LV filling preceded the development of reduced EF. In patients with incident EF reduction, a marked increase in E/A ratio was not associated with a significant change in deceleration time, suggesting a combination of increased filling pressures and reduced LV compliance.
Our data suggest a possible pathophysiological progression leading from hypertension to overt LV systolic dysfunction and a mechanism whereby chronic pressure overload hypertrophy eventually gives rise to increased heart size and ESS, and begets LV dysfunction [25, 26]. We speculate that at the time when the LV is demonstrating progressive enlargement, either the LV shifts rightward, perhaps to the more curvilinear portion of the pressure volume relationship, or, alternatively, to a different pressure-volume curve as illustrated in the sample patient mentioned in Table 5 in Results. It is possible that some combination of these two mechanisms exists; in either event, the observed increase in the E/A ratio is reflecting a higher ‘driving pressure’ across the mitral valve [29]. The present data do not permit determination of whether increased LV chamber size precedes abnormalities in diastolic filling; they may well occur concurrently. Further, ECG findings between the groups have not been compared. While not the purpose of the study, it would be of interest to see if either Cornell product, Sokolow–Lyon voltage or the strain pattern were different and whether they were related to differences in reduced EF incidence.
BP was measured standardized and was not a significant predictor for EF reduction. In previous analyses we have also used stress-corrected fractional shortening (i.e. LV EF adjusted for BP) and thus taken the chronically high afterload into account. As such, reduction in LV mass does result in improvement in LV systolic function [30] but higher stress-corrected midwall fractional shortening related to subsequent lower rate of hospitalization for heart failure [31].
The significant effect of in-treatment heart rate shown in the final statistical model, Panel B of Table 4 is interesting as in the entire LIFE study heart rate in the upper quintile, as an indicator of increased sympathetic activity, was a strong predictor of incident heart failure [32]. It is also interesting that midwall shortening decreased in essentially all the patients who developed reduced EF as indicated by the very strong P-value (< 0.001). This is a topic previously discussed in a LIFE report though not in a time-varying manner [33].
It may be worthwhile mentioning the possibility of dilated cardiomyopathy among these patients (n = 37), a topic that has also been discussed in a previous paper [34]. Anyway, transition from normal to low EF is rare in patients with hypertension, LVH and normal systolic function.
In conclusion, our data support that in treated patients with hypertension and ECG-LVH, incident EF reduction is rare and preceded by development of progressive LV enlargement, increased systolic stress, and signs of increased LV filling pressure. Higher in-treatment LV diameter and mitral E/A ratio are the strongest indicators of subsequent reduced EF, independently of baseline EF.
The LIFE study was a prospective and randomized clinical trial set up to compare cardiovascular outcomes on the angiotensin-receptor blocker losartan vs. the beta-1 selective receptor-blocker atenolol. Though the echocardiographic sub-study in LIFE was pre-specified with separate protocol from the outset, the present investigation of incident EF reduction unrelated to myocardial infarction was an ad hoc analysis. Besides, few parameters were used to characterize LV systolic function, namely EF and the midwall shortening because data were collected in a time-period when global LV strain and mitral ring velocities using tissue Doppler were not available study tools. Further, EF is not the optimal functional parameter especially in hypertensive patients with LVH.
ANCOVA: analysis of covariance
BP: blood pressure
CI: confidence interval
E/A ratio: the ratio of peak early (E) to late (A) diastolic transmitral blood velocity
ECG: electrocardiographic
ECG-LVH: electrocardiographic-left ventricular hypertrophy
EF: ejection fraction
ESS: end-systolic stress
HR: hazard ratio
LA: left atrium
LIFE: Losartan Intervention For Endpoint reduction in hypertension
LV: left ventricular
LVH: left ventricular hypertrophy
The authors thank the echo investigators who participated in the LIFE study.
MC, GPA, GdS and RBD contributed to the conception and design of this LIFE echocardiographic sub-study. MC, GPA and KW performed the statistical analyses. MC wrote the first draft of the manuscript. All authors contributed to manuscript revision, read and approved the submitted version.
Sverre E. Kjeldsen has received ad-hoc lecture honoraria within the past 3 years from Getz, Merck Healthcare KGaA, Sanofi-Aventis and Vector-Intas. The other authors declare that they have no conflicts of interest.
The LIFE study including the LIFE echocardiographic sub-study was approved by the relevant ethical committees in all countries with the participating 945 clinical centers. This manuscript complies with the Declaration of Helsinki.
Written informed consent to participate in the study was obtained from all participants.
Not applicable.
The data that support the findings of this study are available from the corresponding author (RBD) upon dire need.
Merck & Co., Inc. supported the LIFE study with an unrestricted grant from 1993. Merck had a non-voting member of the Steering Committee, which designed the study and wrote the protocol. Merck did monitoring, and data accumulated in a Merck database until study end in 2002. Merck provided the study steering committee with free access to blinded data until 2002 and then un-blinded data after the database was cleared for queries and frozen. The steering committee including a committee statistician validated independently the main outcomes. The steering committee has always been free to analyze and interpret the data, make decisions to publish and write the papers. Merck has not had any formal role after 2002 except for sporadically providing expert statistical assistance.
© The Author(s) 2022.
Copyright: © The Author(s) 2022. This is an Open Access article licensed under a Creative Commons Attribution 4.0 International License (https://creativecommons.org/licenses/by/4.0/), which permits unrestricted use, sharing, adaptation, distribution and reproduction in any medium or format, for any purpose, even commercially, as long as you give appropriate credit to the original author(s) and the source, provide a link to the Creative Commons license, and indicate if changes were made.

Rafael Luzes ... Adalberto Vieyra
Natalia L. Rukavina Mikusic ... Mariela M. Gironacci
Gian Paolo Rossi ... Teresa Maria Seccia
Sukhwinder K. Bhullar ... Naranjan S. Dhalla
Kristin E. Reeve ... Babbette LaMarca
Eran S. Zacks ... Richard B. Devereux
Casper N. Bang ... Peter M. Okin