 Original Article

Affiliation:
1Centre de Recherches en Cancérologie de Toulouse, INSERM UMR1037, Toulouse 31037, France
2Toulouse University, Toulouse 31037, France
3CNRS UMR 5071, Toulouse 31037, France
4Institut Universitaire du Cancer-Oncopole de Toulouse, Toulouse 31037, France
5Laboratoire d’Excellence ‘TOUCAN-2’, Toulouse 31037, France
Email: juan-pablo.cerapio-arroyo@inserm.fr
ORCID: https://orcid.org/0000-0002-3032-3180
Affiliation:
1Centre de Recherches en Cancérologie de Toulouse, INSERM UMR1037, Toulouse 31037, France
2Toulouse University, Toulouse 31037, France
3CNRS UMR 5071, Toulouse 31037, France
4Institut Universitaire du Cancer-Oncopole de Toulouse, Toulouse 31037, France
5Laboratoire d’Excellence ‘TOUCAN-2’, Toulouse 31037, France
ORCID: https://orcid.org/0000-0001-9234-1811
Affiliation:
1Centre de Recherches en Cancérologie de Toulouse, INSERM UMR1037, Toulouse 31037, France
2Toulouse University, Toulouse 31037, France
3CNRS UMR 5071, Toulouse 31037, France
4Institut Universitaire du Cancer-Oncopole de Toulouse, Toulouse 31037, France
5Laboratoire d’Excellence ‘TOUCAN-2’, Toulouse 31037, France
ORCID: https://orcid.org/0000-0003-0076-5444
Affiliation:
1Centre de Recherches en Cancérologie de Toulouse, INSERM UMR1037, Toulouse 31037, France
2Toulouse University, Toulouse 31037, France
3CNRS UMR 5071, Toulouse 31037, France
4Institut Universitaire du Cancer-Oncopole de Toulouse, Toulouse 31037, France
5Laboratoire d’Excellence ‘TOUCAN-2’, Toulouse 31037, France
6Institut Carnot Lymphome CALYM, Toulouse 31037, France
7Centre Hospitalier Universitaire, Toulouse 31037, France
ORCID: https://orcid.org/0000-0002-5375-7512
Affiliation:
2Toulouse University, Toulouse 31037, France
8Pharmadev, IRD UMR 152, Toulouse 31037, France
9International Joint Laboratory of Molecular Anthropological Oncology (LOAM), IRD-INEN, Lima, Peru
ORCID: https://orcid.org/0000-0002-0398-9745
Affiliation:
1Centre de Recherches en Cancérologie de Toulouse, INSERM UMR1037, Toulouse 31037, France
2Toulouse University, Toulouse 31037, France
3CNRS UMR 5071, Toulouse 31037, France
4Institut Universitaire du Cancer-Oncopole de Toulouse, Toulouse 31037, France
5Laboratoire d’Excellence ‘TOUCAN-2’, Toulouse 31037, France
6Institut Carnot Lymphome CALYM, Toulouse 31037, France
10Lead Contact
Email: Jean-jacques.fournie@inserm.fr
ORCID: https://orcid.org/0000-0001-6542-6908
Explor Immunol. 2022;2:185–199 DOI: https://doi.org/10.37349/ei.2022.00044
Received: December 22, 2021 Accepted: March 08, 2022 Published: April 15, 2022
Academic Editor: Dieter Kabelitz, Christian-Albrechts University of Kiel and University Hospital Schleswig-Holstein Campus Kiel, Germany
The article belongs to the special issue Interplay of γδ T cells and Tumor Cells
Aim: The aim of this article is to characterize in detail the γδ T lymphocytes from an adult patient with primary cutaneous T-cell lymphoma of γδ subtype (γδ CTCL).
Methods: Here this article reports trajectory mapping on high-resolution differentiation trajectories of γδ T lymphocytes digitally extracted from a scRNAseq dataset.
Results: In the patch-to-plaque progression of CTCL, the TCRVγnon9 subset of γδ T cells differentiated from naive T cells (Tn) and central memory T cells (Tcm) to abundant effector memory T cells (Tem) while other cutaneous γδ T and CD8 T cells remained unchanged.
Conclusions: This transcriptomic switch underlies the emergence of a CTCL-like progression of the TCRVγnon9 γδ T subtype and suggests new routes for treating these diseases.
The γδ T lymphocytes contribute to both innate and adaptive immunity, notably against viral infections and cancers. Human γδ T cells are CD3+CD4−CD8− lymphocytes whose cell surface T-cell receptor (TCR) is composed either of T-cell receptor variable chain γ9 (TCRVγ9) prominently paired with TCRVδ2, or TCRVγnon9 (TCRVγ2/3/4/5/8) paired with any of the TCRVδ1, 2, 3chains. The TCRVγ9Vδ2 cells represent the prominent subset of γδ T cells in circulating blood, while the TCRVγnon9 cells dominate in the skin, mucosae, and non-lymphoid tissues. Furthermore, the TCRVγ9Vδ2 γδ T lymphocytes are specific for phosphoantigen-induced butyrophilin complexes while TCRVγnon9 γδ T cells recognize more diversified antigens. The functional profile of all the γδ T lymphocytes depends on their differentiation stage, encompassing naive T cells (Tn), central memory T cells (Tcm), effector memory T cells (Tem), and terminally differentiated CD45Ra+ Tem (Temra) cells. When stimulated, the Tn cells can only proliferate and differentiate into Tcm, which are endowed with similar functions plus migratory but not cytokine activity, and then into Tem cells with potent cytokine and cytotoxic functions, and finally into the highly cytotoxic Temra cells.
Using single-cell RNA sequencing (scRNAseq), we previously showed that this linear differentiation presents similar dynamics in both TCRVγ9 and TCRVγnon9 subsets of human γδ T cells [1]. We further refined the transcriptomic transitions underlying this differentiation by delineating 14 successive milestones from the Tn to Temra cells as visualized in a pseudotime-based trajectory [2]. The differentiation stages of γδ T lymphocytes in patients with cancers or with coronavirus disease 2019 (COVID-19) were characterized accordingly and unveiled the association of circulating γδ T lymphocytes with the viral status of individuals [3]. These studies illustrated the power and resolution achieved by trajectory mapping for normal γδ T lymphocytes, but its potential for characterizing the differentiation of malignant γδ T cells was unknown.
The γδ T lymphocytes represent the cell-of-origin for some cutaneous T-cell lymphoma (CTCL), a subtype of skin-homing T cells malignancy named γδ CTCL [4–8]. In their early stages, CTCL may arise as cutaneous lesions termed mycosis fungoides (MF) where long-lasting skin patches homing abundant T cell infiltrates eventually switch by unknown mechanisms to thicker skin plaques and may evolve further to a disseminated T cell lymphoma. More specifically, MF represents a malignancy of skin resident T cells at the Tem differentiation stage, while leukemic CTCL is rather a malignancy of recirculating Tcm lymphocytes [9]. To explore the mechanisms of this early progression, here we digitally extracted the γδ T lymphocytes from a recently published scRNAseq dataset of γδ CTCL [10] with patch and plaque annotations (MF318 from GSE173205), and analyzed these cells by ‘trajectory mapping’. The findings we report from this new type of data exploration provide novel insight into the cellular mechanisms underlying the early stages of this T cell malignancy.
A series of scRNAseq datasets from ~150 healthy individuals and cancer patients’ samples were downloaded from Gene Expression Omnibus (GEO, https://www.ncbi.nlm.nih.gov/geo) integrated and preprocessed as one single reference dataset as depicted [2]. Briefly, the sequencing output bcl2 files were converted to FASTQ format by using cellranger-mkfastqTM algorithm (10× Genomics), and cellranger-count was applied to align to the GRCh38 reference transcriptome and build the (cell, UMI) expression matrix for each sample. Preprocessing, normalization of UMI, and QC were assessed using the R package Seurat 3.0 [11]. First, genes that correspond to human leukocyte antigens (HLA) and genes located in chromosomes X and Y were removed, and the quality of cells was then determined by the number of detected genes per cell and the proportion of mitochondrial genes. The datasets were normalized together and variable features from each dataset were identified by FinVariable-Data before identification of anchors correspondences across all the datasets, to yield an integrated dataset. Principal components analysis (PCA) was then performed on this integrated dataset before dimensionality reduction by uniform manifold approximation and projection (UMAP) [12]. All its single cells were then scored for various multigene signatures, to further perform the digital extraction of γδ T and of CD8 T lymphocytes by score and gate [2]. An unbiased differentiation trajectory of these γδ T lymphocytes was computed without prior information by a minimum spanning tree (MST) algorithm to determine each γδ T cell’s position, pseudotime, and milestone. The reference γδ T cells matrix (cell, gene, pseudotime, and other hallmarks) is published elsewhere [2]. This reference γδ T cell trajectory was visualized as a pseudotimed plot featuring every single cell by its pseudotime (x-axis) vs. its MST1 and MST2 dimensions projection (y-axis) [2]. For clarity, this reference trajectory is shown as a grey cells background onto which additional γδ T cells, here from the CTCL patient, were mapped. The same pipeline was applied for CD8 T cells whenever mentioned in the text.
In parallel, the γδ T and CD8 T cells were extracted likewise from the CTCL patient MF318 scRNAseq dataset, downloaded from the publicly available GEO GSE173205 [10]. This dataset was separately pre-processed by using the same Seurat 3.0 pipeline, and its single cells were scored for multigene signatures to further digitally extract its γδ T and CD8 T lymphocytes by score and gate as above. Before injection into the reference dataset (see below), the γδ T and CD8 T lymphocytes extracted from this CTCL dataset are referred to as ‘ab extra’ cells.
Since the differentiation trajectory of N cells is computed from their N transcriptomes, the resulting trajectory varies with N. As a consequence, adding any newer dataset of ab extra cells (e.g., ‘M cells’) to a previous ‘N cells’ dataset creates a newer (‘N + M cells’) dataset which trajectory differs from the former one. Here, we aimed at freezing the ‘N cells’ trajectory such as to keep it as a stable reference when adding ab extra cells and identify their hallmarks by their position on this reference.
We incepted and applied ‘single-cell injector’, a two-step procedure based on Seurat’s anchoring integration function [11] (Figure S1). The single-cell injector integrates as described [11] a new dataset (named ‘Query’) into a reference dataset (named ‘reference’) in which cells coordinates are already annotated (cells, cluster, t-SNE, UMAP, trajectory, milestone, pseudotime). The resulting dataset (‘Query 2’) is then used by Seurat’s function MapQuery to anchor Query 2 in the reference as already published [11]. Because pseudotime and milestones are already known in the reference, the N ‘auto’ anchors of the reference’s N cells to themselves allow to precisely determine the pseudotime and milestone attributes of each Query’s single cell, without change to the reference trajectory. The injector procedure was validated using the γδ T cell reference dataset since it comprises cells whose MST1, MST2, milestones, and pseudotime are already known. So, n = 7,449 γδ T cells randomly selected from this reference were used as a Query, and this Query was injected into the reference by the depicted procedure. For each Query cell, the injected position and initial position were compared, using as a metric the Euclidian distance (Δ) between the injected and the initial (MST1, MST2) coordinates. With maximally wrong injections such tests could theoretically lead to Δmax = 91. However, the distribution of each Query cell’s Δ revealed 87% perfect injection (n = 6,512 cells injected at Δ = 0) and 13% injected close to the expected position (n = 935 cells injected at Δ < 15, all of which for cells from the M5–M8 branching milestones) (Figure S1b). These results validated the ab extra cell injector procedure, so the CTCL derived γδ T lymphocytes were injected likewise in the reference and their respective pseudotimes and milestones were determined accordingly (Tables S1 and S2). When mentioned in the text, the same pipeline was applied to the CTCL-derived CD8 T cells.
Pathway enrichment analysis was performed using Single-Cell Signature Explorer function scorer [13] to score all the signatures from the MSIgDB (http://www.gsea-msigdb.org) collections Kyoto Encyclopedia of Genes and Genomes (KEGG), GO-MF, GO-BP, Reactome, hallmarks, C6, and C7. These genesets were scored in each single γδ T cell of the specified subset from the reference’s healthy donors [2] and from the patch or plaque samples. Each score was compared between the specified CTCL and healthy cell groups by using unpaired Student’s t and Bonferroni correction false discovery rate (FDR). Plots of representative differential pathways were produced by using the R package pathfindR.
Cell classifications of differentiation stage were based on their respective milestones as Tn (M1, M2), Tcm (M3–7), Tem (M8–13), and Temra (M13, 14) (Figure 1). Since γδ T lymphocytes express either the TRGC1-encoded TCRVγ9 or the TRGC2-encoded TCRVγnon9 in a mutually exclusive fashion, subtyping of the TCRVγ9 and TCRVγnon9 γδ T cells was performed by plots of compensated scores of the signatures (‘TRDC, TRGC1’ positive cells) vs. (‘TRDC, TRGC2’ positive cells) [2]. The cell classifications as tissue resident memory T cell (Ttrm)/recirculating (non-Ttrm) and exhausted T cell (Tex)/functional (non-Tex) were performed by ‘at least one binary’ as follows. The single cells were scored for several reference gene signatures (Table S1). For Tex classification, the reference Tex signatures were as published [14–18]. For each signature, a cut-off was defined as the maximal score of the (n = 3,680) control γδ T or CD8 T lymphocytes extracted from healthy adults peripheral blood mononuclear cell (PBMC). This threshold defined the cell’s binary (1 for cell score > threshold, 0 otherwise). The Tex cut-offs were: 3.9 for ‘Chihara_IL27_Coinhib_module’ [14]; 0.52 for ‘Alfei_ d20_tox’ [15]; 0.22 for ‘Khan_Tox_OverExpressed_genes’ [16]; 0.5 for ‘Tosolini_ NHL_IEGS33’ [17]; and 0.16 for ‘Balanca_QP_genes’ [18]. For each tumor-infiltrating lymphocyte (TIL), the five Tex binaries were summed, and any TIL with a non-zero-sum of binaries was classified Tex, or non-Tex otherwise. The Ttrm classification was applied likewise using Ttrm signatures from the literature [19, 20]. The binarizing cutoffs established with the control CD8 T lymphocytes were: 0.46 for ‘Kumar_13g_Ttrm’; 0.3 for ‘Kumar_3g_Ttrm’ [19]; 3.72 for ‘Wu_Tcellcluster4.1_trm’; 2.6 for ‘Wu_Tcellcluster8.3_trm’; 2.8 for ‘Wu_Tcellcluster8.3b_trm’; 4.2 for ‘Wu_ Tcellcluster8.3c_trm’ [20]. These Ttrm binaries were summed, and any TIL with a non-zero-sum of Ttrm binaries was classified Ttrm, or non-Ttrm (recirculating) otherwise.
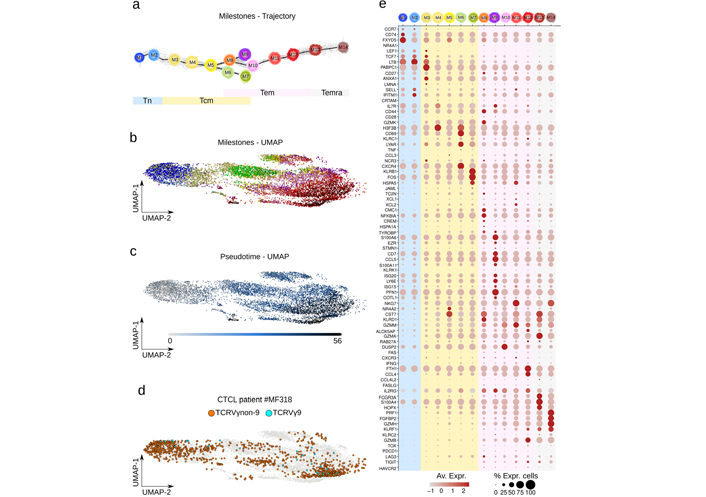
Differentiation trajectory, UMAP, and marker genes of reference and CTCL patient γδ T cells. a). Differentiation trajectory of all γδ T cells digitally extracted from the reference and dataset of MF318 patient skin is shown with the corresponding reference trajectory milestones. Differentiation pseudotime scale: 0–5 for Tn, 5–20 for Tcm, 20–48 for Tem; 48–55 for Temra. UMAP of the same cells featuring b). the above milestones (same color key as a); or c). their pseudotime; d). UMAP of γδ T cells extracted from the CTCL patient specifying the TCRVγ subtype overlaid to the reference cells (grey); e). mean and percentage of marker gene expression level per milestones
The γδ T lymphoma cells of CTCL type were sourced from the public scRNAseq dataset of CTCL patient MF318 (GEO GSE173205, Methods), a 55 years old Caucasian female patient diagnosed with stage IIB CD30+ γδ MF without large cell transformation [10]. Its γδ T lymphocytes were digitally purified using score and gate by successively discarding the keratinocytes, melanocytes, myeloid, B, natural killer (NK), CD4 T, and finally CD8 T cells from the dataset. A total of 1,220 γδ T cells were obtained. We previously produced a so-called ‘public’ differentiation trajectory of γδ T cells from > 150 individuals’ blood and tissue samples [2]. Using the single-cell injector procedure (Methods, Figure S1), the (n = 1,220) γδ T cells from the CTCL patient MF318 were injected into this reference. With ~20,000 cells distributed in 14 milestones from Tn to Temra cells, this trajectory represents the most exhaustive and resolutive map of γδ T differentiation so far (Figure 1a). Together, these milestones still form a consistent and coherent continuum when the integrated dataset is represented by an alternative computational method such as UMAP (Figure 1b). Also, visualization in this UMAP of the trajectory pseudotime validated the previous sequence of differentiation milestones (Figure 1b). In UMAP, the γδ T cells from the CTCL patient MF318 were embedded in all areas of the dataset, confirming their transcriptomic similarity to the reference γδ T cells. Also, these cells encompassed both TCRVγ9 and TCRVγnon9 γδ T cell subsets (Figure 1d). The expression profile of a series of published marker genes [2, 21] in each milestone showed smooth profile transitions across the trajectory (Figure 1e). Based on expression intensity and percentage of expressing cells, the Tn marker genes typically encompass CCR7, TCF7, LTB, and SELL; Tcm genes include ANXA1, PABPC1, IL7R, H3F3B, CD69, LYAR, CXCR4, KLRB1, NR4A2 and FOS, Tem genes comprise S100A6, KLRD1, NKG7, CST7, PFN1, GZMM, GZMB, DUSP2, FTH1, CCL4, and IL2RG, and Temra genes include FCGR3A, S100A4, PRF1, GZMA, FGFBP2, GZMH, and KLRK1. These profiles confirmed earlier reports [2, 21] depicting a progressive differentiation of type-1 cytotoxic functions along Tem and Temra stages, with the Temra cells detected here in both M13 and M14 instead of M14 only [2]. Few innate-like γδ T cells were present in this integrated reference dataset, as KLRB1 (encoding for CD161) was expressed by most of the late Tcm (M7) cells but KLRC1 (encoding for NKG2A) and TBX1 (encoding for PLZF1) by very few Tem (M13) cells. Fetal differentiation-derived type-3 effector γδ T cells revealed by their CCR6, RORC, IL23R, and DPP4 marker genes [21] were not abundant in the integrated reference, though clearly represented in most milestones (not shown).
Given the correspondence of the differentiation trajectory and UMAP visualizations of the integrated dataset, we investigated further the γδ T cells from the CTCL patient MF318 with the higher resolution of pseudotimed trajectory maps.
Among the variants of CTCL, MF is depicted as a malignancy of skin-resident Tem cells, in contrast to leukemic CTCL which is composed of skin-recirculating malignant Tcm cells [9]. So to determine precisely the differentiation of the skin γδ T cells from patient MF318, the (n = 1,220) γδ T cells were analyzed by injection in the reference γδ T pseudotimed trajectory. In parallel controls, (n = 238) CD8 T lymphocytes extracted from the same CTCL dataset were injected into their respective CD8 T reference differentiation trajectory [2]. These CD8 T cells encompassed a few Tn, Tcm, and early Tem cells, but no Temra (Figure 2). In contrast, the γδ T cells displayed all stages of differentiation. When cells were stratified by patch or plaque origin, the CD8 T cells differentiation was similar in both cases. In contrast, the γδ T cells from the patch were only Tn and early Tcm cells, while in the plaque, they comprised a few late Tcm and mostly Tem cells (Figure 2).
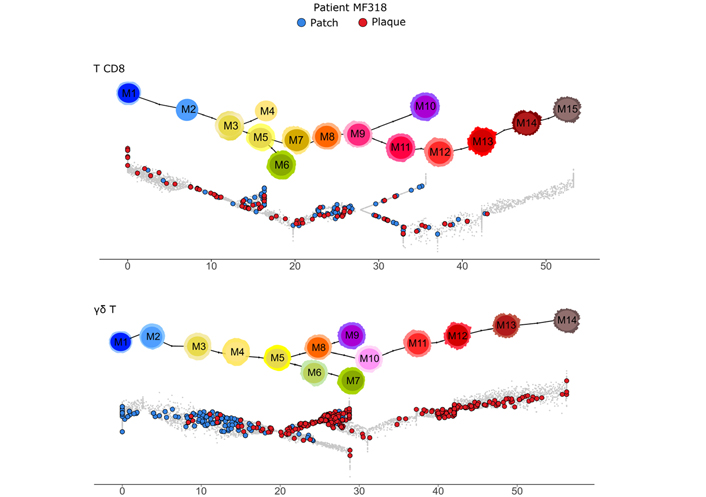
Differentiation of γδ T and CD8 T lymphocytes from a γδ CTCL patient MF318 skin dataset. The (n = 238) CD8 T (top) and (n = 1,220) γδ T (bottom) cells digitally extracted from the scRNAseq dataset of MF318 patient skin are overlaid on their respective differentiation trajectory, specifying the patch or plaque tissue source. The respective reference trajectory and milestones are shown above for CD8 T cells (top) and γδ T cells (bottom). γδ T cell differentiation pseudotime scale: 0–5 for Tn, 5–20 for Tcm, 20–48 for Tem; 48–55 for Temra
These analyses unveiled a γδ T cell-selective differentiation from Tcm to Tem upon the patch-to-plaque progression of patient MF318’s skin lesions.
By scoring various gene signatures and applying a classifier based on these scores (Methods), the above γδ T cells were characterized for TCRVγ9 or TCRVγnon9 subset, tissue-residency or recirculating, and exhaustion or functional cell states. These distinct features were then visualized simultaneously on the mapped γδ T cells (Figure 3a). This showed that the TCRVγnon9 subset (n = 1,189 TCRVγnon9 cells vs. n = 31 TCRvγ9 cells) was largely prominent among the skin γδ T cells (Figure 3). Unexpectedly however, these TCRVγnon9 lymphocytes were in majority recirculating (n = 723 recirculating, n = 466 Ttrm), and their (n = 167) Tex cells were more often Ttrm (n = 116 Tex; 25% of the Ttrm) than recirculating lymphocytes (n = 51 Tex; 7% of the recirculating). The fewer TCRvγ9 cells comprised (n = 19) recirculating cells including (n = 2) Tex and (n = 12) functional Ttrm.
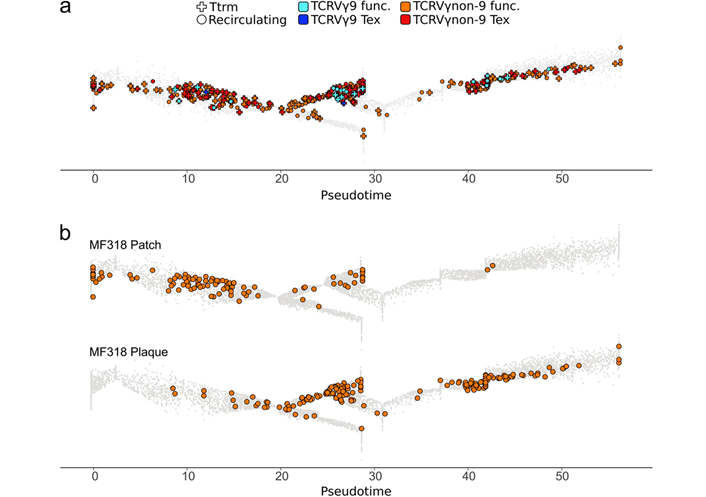
Functional hallmarks of skin γδ T lymphocytes from patient MF318. a). The TCRVγ9 (blue) and TCRVγnon9 (orange), as well as the Ttrm (cross) or non-Ttrm (circle), and the Tex or non-Tex hallmarks of cells among the γδ T lymphocytes shown in Figure 1 are visualized overlaid on the same public trajectory of γδ T lymphocyte differentiation. γδ T cell differentiation pseudotime scale: 0–5 for Tn, 5–20 for Tcm, 20–48 for Tem; 48–55 for Temra; b). same as above focused on the circulating TCRVγnon9 cells only, by tissue source. The similarity of this panel with the global view (Figure 2) reflected the TCRVγ9 cells (n = 31) scarcity among the total γδ T cells (n = 1,220, Figure 2 bottom)
There were evident changes during the patch-to-plaque progression concerning cell counts: the TCRVγ9 cells remained unchanged and scarce in both samples (n = 13 cells in patch, n = 18 in plaque), while the TCRVγnon9 cells strongly increased (n = 471 cells in patch, n = 718 cells in plaque). This was a doubling of the cell counts for recirculating cells (patch: n = 247 Ttrm and n = 224 recirculating, plaque: n = 219 Ttrm and n = 499 recirculating). In the patch, the recirculating compartment of TCRVγnon9 lymphocytes comprised 18% Tn, 62% Tcm (n = 139 cells), 20% Tem, and 0% Temra cells, while in the plaque it comprised 0% Tn, 7% Tcm, 86% Tem (n = 431 cells), and 7% Temra (Figure 3b).
Thus the patch-to-plaque progression of the γδ CTCL patient MF318 involved a Tcm proliferation and Tem differentiation of the TCRVγnon9 subset of skin γδ T lymphocytes.
To further determine cellular hallmarks of the plaque γδ T lymphocytes, we compared various pathway signatures between the circulating TCRVγnon9 γδ T Tem cells (milestones M8–M12) and in their corresponding control cells (n = 1,431) from reference’s healthy donors [1].
Several signatures appeared significantly enriched in the plaque Tem cells (Figure 4). Their most upregulated encompassed T cell activation signatures (graft-versus-host disease, type 1 diabetes, allograft rejection, autoimmune thyroid disease) and immune escape to cell cytotoxicity (protection from NK cell lysis, protein tyrosine kinase inhibition). Asthma and immunoglobulin E (IgE) binding corresponding to an allergic context were enriched in the plaque γδ T cells, suggesting that some contact dermatitis could underlie this progression of lesions [22]. The ‘viral ribonucleoprotein (RNP) complexes in the host cell nucleus’ signature were also significantly upregulated which, together with significantly downregulated cytosolic DNA sensing, toll-like receptors (TLR), cytokine, and chemokine signalings, supported the hypothesis of a viral infection in CTCL [23]. By contrast, activities of several transcription factors [targets of early 2 factor (E2F), MYC, and the polycomb repressive complex 2-enhancer of zeste homolog 2 (PRC2-EZH2) and PRC1-BMI1] and all the main energetic pathways [glycolysis, oxidative phosphorylation, fatty acid (FA) metabolism] were significantly upregulated in the Tem TCRVγnon9 γδ T cells from the plaque (Figure 4 right panel). Further comparisons of the same lymphocytes from patches to their respective controls unveiled that circulating Tem TCRVγnon9 γδ T cells with the above signatures were less abundant but actually present in the earlier patches (Figure 4 left panel).
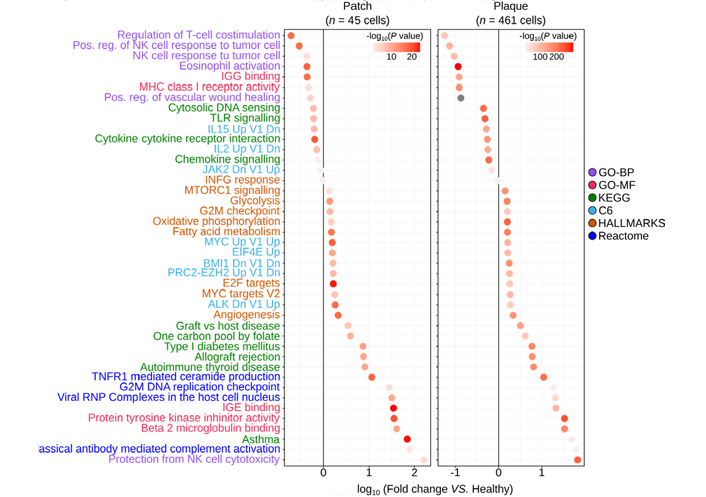
Most significant gene signatures of the skin circulating TCRVγnon9 Tem γδ T cells (milestones M8–M13) relative to the same subset of correspondingly differentiated γδ T cells (n = 1,431) from healthy donors. Left: patch–derived γδ T cells vs. control cells; right: same analyses for plaque-derived γδ T cells vs. control cells (color key: signature databases; P values from)
So the TCRVγnon9 γδ T cell proliferation and differentiation-associated with the patch-plaque switch of patient MF318 involved a global evolution of their transcriptome profile.
During the differentiation of control γδ T lymphocytes from healthy individuals, there is no flagrant change in the expression level of the main energetic pathways (Figure S2). So here, we aimed at characterizing more precisely those skin recirculating Tem TCRVγnon9 γδ T cells displaying increased levels of the above signatures. Plotting all the patient’s γδ T cells for both energetic pathways (sum of glycolysis, OXPHOS, and FA metabolism scores) vs. transcription factor activity (E2F targets) confirmed that some cells, more numerous in the plaque, had simultaneously up-regulated both signatures (Figure 5a). When selected for a focused analysis, these (n = 342) cells comprised 98% of TCRVγnon9 lymphocytes (Figure 5b). Their positioning on trajectories characterized a majority of Tcm cells in the patch and of effector cells in the plaque (Figure 5c). However, rare (n = 8) Tn cells from the patch also displayed this activated phenotype (Figure 5c). Finally, mapping the oxidative phosphorylation levels in ungated γδ T cells from healthy controls and MF318 patch and plaque (not shown) confirmed that this activated phenotype of plaque TCRVγnon9 cells was not the mere consequence of normal γδ T differentiation, consistent with their malignant state.
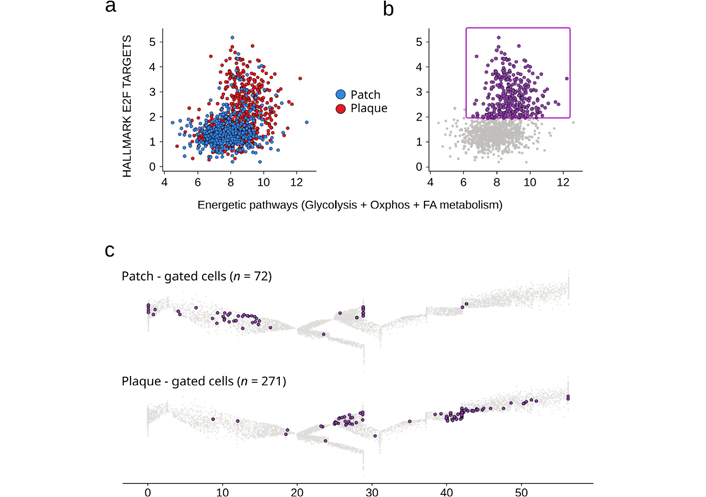
Recirculating skin TCRVγnon9 Tem γδ T cells with dually upregulated energetic and transcriptional profiles. a: Scatterplot of scores for the specified signatures (same as in Figure 3) of all the patch–and plaque derived γδ T cells; b: the gate of dual profiles-upregulating γδ T cells; c: differentiation maps of the gated cells. Results per sample, gated cells (purple) overlaid to the reference trajectory (grey). γδ T cell differentiation pseudotime scale: 0–5 for Tn, 5–20 for Tcm, 20–48 for Tem; 48–55 for Temra
Hence, the MF318 patient’s skin lesions encompass a sizeable subset of recirculating skin TCRVγnon9 γδ T cells whose energetic and transcriptional profiles were above those of normal cells all along with their Tn, Tcm, and Tem differentiation, consistent with the malignant status of these MF skin-derived γδ T cells [10].
The separation of human γδ T lymphocytes according to their differentiation stage has been instrumental to understand their different functions in the immune response to various challenges. Typically, this was done by flow cytometry analyses of cells surface markers that separate differentiation subsets and then ascribing molecular hallmarks and immune functions to these subsets. However, the mere split of any TCR-delineated γδ T cell subset into four successive Tn, Tcm, Tem, and Temra stages based on cell surface phenotypes is well established but might mask some critical levels of information such as those from gene expression. The development of scRNAseq technologies provides us with visualizations of the transcriptomic-based cell transitions between differentiation stages with a far better resolution than ever before. This progress is not achieved by harnessing both the profiles of genes transcribed in each cell, but also by determining precisely each cell’s relative position in a pseudotime-ordered collection of the same cell type (‘reference dataset’).
We had previously depicted the pseudotimed differentiation trajectory of human γδ T lymphocytes from either TCRVγ9TCRVδ2 and TCRVγnon9TCRVδ1 subset, and their subdivision into 14 discrete milestones [2]. Consistent with earlier reports [1, 21], the naive γδ T lymphocytes encompass two stages M1 and M2 sharing graded expression levels of LEF1 and TCF7, two genes encoding for Tn-typifying transcription factors [24, 25] together with those of the homing factors CCR7 and SELL [26]. This finer subdivision of Tn γδ T lymphocytes was not reported in earlier scRNAseq studies analyzing fewer cells [27]. The following five Tcm milestones include a smooth profile transitions from the M3 milestone as illustrated by the Tn-like gene LTB, to the following Tcm M4–M7 that display progressively reduced Tn gene but increasing levels of activation genes FOS, IL7R, CD69, CD44, and CXCR4 genes. Such an ordering validated the original proposal of Tcm as a transitional status between true Tn and Tem [28] and also pinpoints the Tn cell differentiation-promoting ANXA1 [29] and regulatory genes NR4A2, PABPC1, H3F3B, and LYAR as Tcm-selective gene markers [21]. Following the Tcm but branching from the M5 milestone, 6 milestones of Tem stages reflected a cytotoxicity gene expression gradient (NKG7, CST7, PFN1, GZMB, FCGR3A, among others). During the M8–M12 Tem, the pleiotropic immune effector functions [30] were not consistently overlaid as the T-helper 1 (Th1) cytokine and cytolytic functions were rather sequentially tiled. The prototype of Th1 gene encoding for interferon gamma (IFNG) peaked (M10–M11) before the cytotoxicity genes whose expression increased continuously along M8–M14. Both the perforin-encoding PRF1 gene and the high-affinity receptor for antibody-dependent cell cytotoxicity FCGR3A peak at the Temra stage (M13–M14) [1, 31] constituting the endpoint of this type-1 cytotoxic differentiation. Presumably, the scarcity of innate-like γδ T and fetal wave-derived type 3 effector cells found in the integrated reference dataset reflects its lack of neonatal or cord blood cells recently depicted elsewhere [21]. Overall, this trajectory clarified how γδ T lymphocytes blend their innate programming and functional polarization [32] through temporal tiling. This trajectory also constitutes a reference roadmap onto which ab extra γδ T cells from any additional scRNAseq datasets can now be positioned such as to identify their hallmarks. The γδ T cells infiltrating human tumors, and those from blood or lung lesions of COVID-19 patients were characterized accordingly [3]. Likewise, mapping of γδ T cells extracted from a human γδ T cell lymphoma scRNAseq dataset had never been attempted, however, and the present study reports its successful use for characterizing CTCL of γδ T lineage.
Our report shows that trajectory mappings can help to explore the cell-of-origin of a cancer cell type and its molecular transitions, beyond the more classic characterization of normal cell differentiation as currently reported [33]. Specifically, CTCL is a heterogeneous group of non-Hodgkin T cell lymphoma whose etiology remains ill-defined [34]. Among these, the γδ CTCL constitutes an uncommon type of aggressive disease in which cell-of-origin depends on the tissue from which the lymphoma derives. Hepatosplenic and subcutaneous fat panniculitis-like γδ T cell lymphoma develops from the TCRVγ9Vδ2 subsets of cells while the γδ T cell lymphomas arising from the epidermis and dermis rather develop from TCRVγnon9Vδ1 lymphocytes [4, 7, 35]. Given the prominent TCRVγnon9/TCRVδ1 and TCRVγ9/TCRVδ2 cell surface TCR chain pairings of human γδ T lymphocytes, the TCRVγnon9 cell differentiating while the skin patch evolves to plaque lesions suggests a cell-of-origin for the CTCL-like progression in this γδ MF patient. At this point, however, whether this differentiating TCRVγnon9 γδ T cell population homogeneously represents a truly malignant MF single clone or a mix with premalignant and/or non-malignant polyclonal TCRVγnon9 γδ T cells remain undetermined. On the one hand, the original case report depicts this cell population as a single ‘malignant γδ T cell clone’ [10]. On the other hand, TCRVγnon9 γδ T cells are physiological skin-resident and the cells under study were from a thigh skin patch and plaque diagnosed as stage IIB CD30+ γδ MF without large cell transformation [10]. Although next-generation sequencing of a single cell’s whole exomes would be necessary to formally detect whether-/which- plaque’s TCRVγnon9 γδ T cells carry some of the known CTCL driver mutation(s) [7], this can not be done with the currently available scRNAseq dataset.
This study evidenced a TCRVγnon9-selective differentiation of a recirculating subset of skin γδ T lymphocytes associated with MF disease progression. The non-random TCR chain usage of γδ CTCL suggests common triggering antigens for TCRVγnon9TCRVδ1 and TCRVγ9TCRVδ2 γδ lymphomas [7]. Indeed, skin-colonizing Staphylococcus aureus can contribute to the pathogenesis of MF and Sezary syndrome (SS), notably through superantigens driving tumor cells proliferation [36]. More specific antigens for TCRVgnon9 cells such as CD1d-restricted lipids [7], histidyl-tNAsynthase, or butyrophilin-like 3-restricted antigens have been proposed [37–40], but the precise structure of antigens driving the T cell lymphomagenesis remain unidentified. This information is currently out of reach to approaches using scRNAseq, although a viral signature ‘viral RNP complex in the nucleus’ possibly suggesting undefined viral antigens was underpinned here by enrichment analysis (Figure 4).
Whatever the antigen, however, TCR stimulation of T lymphocytes drives their differentiation. Flow cytometry analyses of surface markers such as CCR7, CD27, and CD62L characterized MF as a malignancy of non-cytotoxic skin CD4 Tem cells, by contrast with SS that generally arises from a single transformed clone of CD4 Tcm recirculating cells [41, 42]. Since Tcm is a stage more proliferative and recirculating between skin and blood, Tcm cells are more prone to lead to the dissemination of aggressive SS with high phenotypic heterogeneity [43–46]. Here, unveiling that skin patch Tn and Tcm γδ T cells differentiate into Tem Trm cells when lesion switched to plaque confirms the prominence of skin-resident Tem cells in MF lesions [9]. This also suggests that among skin TCRVγnon9 γδ T cells, the Tcm are more prone than Tem to recirculate in blood [47].
Aside from the TCRVγnon9 γδ T cell differentiation associated with progression of the MF CTCL, the finding here is that the other subsets of cytolytic skin T lymphocytes, namely CD8 T and TCRVγ9 γδ T cells, remained unaffected by this progression (Figures 2 and 3) is puzzling and confirms further the correlated differentiation of γδ T and CD8 T TILs in human cancers [2]. Whatever the disease stage, the skin-infiltrating TCRVγ9 γδ T lymphocytes represented a minority of the TILs from this CTCL sample, presumably as blood-borne cells, and they did not differentiate while the disease progressed. This might reflect their lack of genuine tropism for this epithelial tissue in nearly physiological conditions, or alternatively that the TCRVγnon9 γδ T MF cells did not up-regulate phosphoantigens/butyrophilins prone to activate the blood TCRVγ9 γδ T lymphocytes. Second, these malignant MF cells had upregulated several pathways providing an immune escape to NK cell cytolysis, apparently prior to detectable activation of the TILs (Figure 3). Hence in this MF patient, the lesion progressed in a landscape without change of cell counts or phenotype from neighboring cytolytic TILs, while the MF cells evolved protection from immune attack. This landscape was consistent with earlier studies of B cell non-Hodgkin’s lymphoma (B-NHLs) which upregulate immune escape pathways before TIL cell activation [48]. Finally, the JAK/signal transducers and activators of transcription (STAT), mitogen-activated protein kinases (MAPK), MYC, and chromatin modification pathways which are mutated in most γδ CTCL [7] corresponded to the upregulated gene signature profile found here in the MF318 patient’s plaque cells. These cells also upregulated both energetic pathways through a non-physiological metabolic decoupling classically found in malignant cells. So, the TCRVγnon9 Tem cells of skin-resident γδ T lymphocytes display a phenotype merging immune-escape, high energetic supply, and elevated transcriptional activities, recapitulating the hallmarks of cancer cells. Beyond confirming and extending the original identification of a γδ CTCL in an MF patient [10], our study provides an important resource for hematological cancer research. Beyond, it suggests that implementing the therapeutic targeting of γδ CTCL with small molecule inhibitors of energetic metabolism and γδ T cell-based cancer immunotherapies represent promising approaches for these treatment-refractory diseases.
CTCL: cutaneous T-cell lymphoma
GEO: Gene Expression Omnibus
MF: mycosis fungoides
MST: minimum spanning tree
NK: natural killer
scRNAseq: single-cell RNA sequencing
SS: Sezary syndrome
Tcm: central memory T cells
TCR: T-cell receptor
TCRVγ9: T-cell receptor variable chain γ9
Tem: effector memory T cells
Temra: CD45Ra+ effector memory T cells
Tex: exhausted T cell
TIL: tumor-infiltrating lymphocyte
Tn: naive T cells
Ttrm: tissue resident memory T cell
UMAP: uniform manifold approximation and projection
The supplementary Figures for this article are available at: https://www.explorationpub.com/uploads/Article/file/100344_sup_1.pdf. The supplementary Tables for this article are available at: https://www.explorationpub.com/uploads/Article/file/100344_sup_2.tsv and https://www.explorationpub.com/uploads/Article/file/100344_sup_3.tsv.
We thank Pierre Brousset, Jean Philippe Merliot, and CRCT collaborators for support and critical discussions.
JJF and JPC conceived and designed the study, JPC conceived methods, processed and performed bioinformatic data analyses, JJF and JPC generated figures, and wrote the manuscript. MP and FP conceived algorithms. CL, SB and JJF supervised the study and all authors wrote the paper. All authors contributed to manuscript revision, read and approved the submitted version.
The authors declare that they have no conflicts of interest.
Not applicable.
Not applicable.
Not applicable.
Further information and reasonable requests for the integrated (cell, gene, hallmarks) matrix of extracted γδ T should be directed to Jean-Jacques Fournie (jean-jacques.fournie@inserm.fr) or Juan-Pablo Cerapio (juan-pablo.cerapio-arroyo@inserm.fr).
This work was supported in part by institutional grants from the Institut National de la Santé et de la Recherche Médicale (INSERM), the Université Toulouse III-Paul Sabatier, the Centre National de la Recherche Scientifique (CNRS); Laboratoire d’Excellence Toulouse Cancer (TOUCAN-2) under grant contract ANR11-LABX, the Fondation ARC under grant contract PGA1-RF2019-0208691; Institut Universitaire du Cancer de Toulouse-Oncopole under contract CIEL. This work was granted access to the HPC resources of CALMIP supercomputing center under allocation 2020-T19001. The funders had no role in study design, data collection and analysis, decision to publish, or preparation of the manuscript.
© The Author(s) 2022.
Copyright: © The Author(s) 2022. This is an Open Access article licensed under a Creative Commons Attribution 4.0 International License (https://creativecommons.org/licenses/by/4.0/), which permits unrestricted use, sharing, adaptation, distribution and reproduction in any medium or format, for any purpose, even commercially, as long as you give appropriate credit to the original author(s) and the source, provide a link to the Creative Commons license, and indicate if changes were made.

Xiangjin Zhang ... Wei He
Huidi Wang ... Jia Yin
Chang Liu ... Wei He
Joseph M. McGraw, Deborah A. Witherden
Yue Wang ... Wei He
Rupert Handgretinger ... Manon Queudeville
Gabrielle M. Ferry, John Anderson
Alessandro Poggi, Maria Raffaella Zocchi
Navdeep Jhita, Sunil S. Raikar
Jessica Da Gama Duarte ... Andreas Behren
