 Protocol

Affiliation:
1Olivia Newton-John Cancer Research Institute, School of Cancer Medicine, La Trobe University, Heidelberg 3084, Victoria, Australia
ORCID: https://orcid.org/0000-0003-4289-5204
Affiliation:
1Olivia Newton-John Cancer Research Institute, School of Cancer Medicine, La Trobe University, Heidelberg 3084, Victoria, Australia
ORCID: https://orcid.org/0000-0003-4975-7779
Affiliation:
1Olivia Newton-John Cancer Research Institute, School of Cancer Medicine, La Trobe University, Heidelberg 3084, Victoria, Australia
ORCID: https://orcid.org/0000-0003-4180-0074
Affiliation:
1Olivia Newton-John Cancer Research Institute, School of Cancer Medicine, La Trobe University, Heidelberg 3084, Victoria, Australia
ORCID: https://orcid.org/0000-0001-7582-3990
Affiliation:
1Olivia Newton-John Cancer Research Institute, School of Cancer Medicine, La Trobe University, Heidelberg 3084, Victoria, Australia
2Department of Medicine, University of Melbourne, Parkville 3010, Victoria, Australia
Email: andreas.behren@onjcri.org.au
ORCID: https://orcid.org/0000-0001-5329-280X
Explor Immunol. 2022;2:383–392 DOI: https://doi.org/10.37349/ei.2022.00057
Received: January 10, 2022 Accepted: April 27, 2022 Published: June 16, 2022
Academic Editor: Dieter Kabelitz, Christian-Albrechts University of Kiel and University Hospital Schleswig-Holstein Campus Kiel, Germany
The article belongs to the special issue Interplay of γδ T cells and Tumor Cells
Conventional immunohistochemistry methods though once fundamental for the individual staining of cell markers, have now been superseded by multispectral immunohistochemistry (mIHC). mIHC enables simultaneous detection of multiple cell markers in situ using single formalin-fixed paraffin-embedded (FFPE) tissue sections. In addition to conserving patient tissue specimens, the ability to visualise more than one marker on individual cells allows for further refining of cell phenotypes, and provides insight into cell-to-cell interactions and spatial arrangements across single tissue sections. Here, a comprehensive protocol is described for the in situ interrogation of γδ T cells and phosphoantigen-presenting butyrophilin (BTN) molecules (BTN2A1 and BTN3A1) in human FFPE tissue using Opal™ tyramide signal amplification (TSA)-based mIHC. It is demonstrated that an effectively optimised Opal™-TSA 7-marker [CD3, Pan-γδ T cell receptor (TCR), granzyme B, BTN2A1, BTN3A1, tumour marker, 4’,6-diamidino-2-phenylindole (DAPI)] mIHC panel can be used to define the presence, localisation, and activation status of γδ T cells and the BTN2A1 and BTN3A1 ligands.
γδ T cells are a versatile subset of T cells with effector and regulatory roles that are capable of linking innate and adaptive immune responses [1]. Due to their major histocompatibility complex (MHC)-independent mode of antigen recognition, cytotoxic potential and ability to influence other immune cells, γδ T cells play a key role in infectious diseases, autoimmunity and tumour immunology and can be harnessed for a wide range of potential therapeutic applications [2, 3]. Human γδ T cells can be subdivided into two major subsets based on Vδ chain expression, with Vδ2 populations (usually paired with the Vγ9 chain) predominantly found in circulation and secondary lymphoid organs, and Vδ1 populations in mucosal tissues [4]. γδ T cells can be recruited to the tumour to exert anti- or pro-tumoural functions, and are mainly composed of Vδ1 and Vδ2 γδ T cell subsets [5]. Following tumour cell recognition, γδ T cells are capable of targeted tumour cell killing via perforin and granzyme expression and modulation of the recruitment, differentiation and activity of other immune cells (including αβ T cells, B cells, dendritic cells, macrophages, monocytes, natural killer cells and neutrophils) mainly via chemokine and cytokine production [5].
Butyrophilin (BTN) molecules, in particular BTN2A1 and BTN3A1, are important immune mediators and have recently been established as direct ligands of human γδ T cell receptors (TCRs) [6–8]. Moreover, cell surface co-expression of BTN2A1 and BTN3A1 is required for Vγ9Vδ2 T cells to recognise and be activated by phosphoantigens produced by microbes and tumour cells [7]. Hence, a multispectral immunohistochemistry (mIHC) panel capable of identifying intratumoural γδ T cells and tumour cell expression of BTN2A1 and BTN3A1 in a spatial context is a valuable tool that can infer γδ T cell activity in solid tumours.
Tyramide signal amplification (TSA) has enabled the emergence of more sophisticated multiplexing approaches when compared to conventional immunohistochemistry methods, allowing for simultaneous detection of multiple antigens [9, 10]. The Opal™-TSA method can be used to accurately detect up to 8 antigen targets on a single 4 μm thick formalin-fixed paraffin-embedded (FFPE) tissue section [11]. To comprehensively interrogate various tumour types for the presence of BTN molecules and their relation to γδ T cell infiltration and granzyme B expression, we have developed two Opal™-TSA 7-marker mIHC panels for the manual staining of human FFPE tumour sections: 1) CD3, Pan-γδ TCR, granzyme B, BTN2A1, BTN3A1, pan-cytokeratin (PanCK), 4’,6-diamidino-2-phenylindole (DAPI); 2) CD3, Pan-γδ TCR, granzyme B, BTN2A1, BTN3A1, melanoma cocktail, DAPI. These panels have been manually optimised with regards to primary antibody dilution and incubation time, pairing with Opal™ fluorophores and staining order to enable accurate downstream multispectral image (MSI) unmixing, quantification and analysis.
This protocol is limited to a maximum of 7 markers, 6 antigen targets and a DAPI nuclear counterstain, on a single FFPE tissue section. However, if an in-depth cellular and molecular characterisation is required, emerging spatial phenotyping techniques, such as the PhenoCycler™-Fusion (Akoya Biosciences), spatial sequencing or combinations thereof may be warranted, but are often costly and labor-intensive.
Due to the lack of adequate commercial primary antibodies currently available against specific Vδ1+ and Vδ2+ T cell subsets, these panels only include Pan-γδ T cell markers and hence cannot distinguish between distinct γδ T cell subsets. However, this may be achieved by incorporating RNA-specific probes into the staining panel. Similarly, no commercial reagents exist to our knowledge that reliably differentiate between BTN3A1/A2/A3, currently limiting additional insights into the molecular activation mechanism of γδ T cell subsets.
Moreover, individual antigen targets may be replaced, as per the user’s research needs. If doing so, prior primary antibody optimisation is required before substitution in the current protocol, and details regarding the antigen abundance and co-localisation will determine if a direct substitution may be possible or if re-optimisation of the primary antibody staining order and Opal™ fluorophores pairing is required.
In addition to general laboratory consumables and equipment, the following primary antibodies, reagents, instruments, and software required for this protocol are listed in Table 1. This protocol was developed using the Opal™ multiple immunohistochemistry (IHC) Assay Development Guide and Image Acquisition Information (Akoya Biosciences) guide.
List of necessary primary antibodies, reagents, instruments and software
| Resource | Company | Clone | Concentration | Catalogue number |
|---|---|---|---|---|
| Antibody | ||||
| CD3e | Invitrogen | SP7 | n.d.1 | MA5-14524 |
| Pan-γδ | Santa CruzBiotechnology | H-41 | 0.1 mg/mL | Sc-100289 |
| Granzyme B | Cell Signaling | D6E9W | 6 μg/mL | #46890 |
| BTN2A1 | Atlas Antibodies | Polyclonal | 50 μg/mL | HPA019208 |
| BTN3A1 | Antibodies Online | 4E1B9 | 0.1 mg/mL | ABIN5684130 |
| PanCK | Abcam | AE1/AE3 | 80 μg/mL | Ab27988 |
| Melanoma Cocktail2 | Abcam | HMB45 + M2-7C10 + M2-9E3 | n.d. | Ab732 |
| Reagent | ||||
| Manual Opal™ 7-Color IHC Kit3 | Akoya Biosciences | NEL811001KT | ||
| VECTASHIELD Vibrance™ | Abacus dx | VEH170010 | ||
| Instrument | ||||
| Vectra® 3 Automated | Akoya Biosciences | |||
| Quantitative Pathology Imaging System | ||||
| Software | ||||
| inForm® Tissue Analysis Software | Akoya Biosciences | |||
| HALO® Image Analysis Platform | Indica Labs | |||
1 not determined (supplied as cell culture supernatant);
2 this cocktail includes HMB45 and MART-1;
3 includes antigen retrieval (AR) buffer at pH6 (AR6 buffer), AR9 buffer, antibody diluent and blocking buffer formulation (Blocking/Antibody Diluent), Opal™ Polymer horseradish peroxidase (HRP) mouse and rabbit (reacts specifically with primary antibodies raised in mouse and rabbit), Opal™ signal amplification diluent (1× Plus Amplification Diluent), 6 reactive Opal™ fluorophores (Opal™ 520, 540, 570, 620, 650 and 690), and spectral DAPI
This step prepares the tissue sections for staining via deparaffinisation, tissue rehydration tissue fixation, and quenching of endogenous peroxidase activity.
1. Place slides with 4-μm-thick FFPE single tissue sections (SuperFrost® Plus positively charged slides) into a metal slide rack and bake in an oven for 1 h to 2 h at 65°C.
Note. This step ensures that the tissue adheres to the slide and minimises tissue loss during subsequent steps.
2. Transfer slides to a slide rack and wash slides by gradual immersion in pre-filled glass jars containing xylene for 10 min, 3 times, followed by 100% ethanol for 10 min, and 95% ethanol for 10 min.
3. Rinse slides in 70% ethanol and then deionised water (dH2O).
4. Incubate slides in 10% Neutral Buffered Formalin (NBF) for 20 min, and then rinse in dH2O.
5. Block slides using 3% hydrogen peroxide for 5 min, and then rinse in dH2O.
This step enables unmasking of antigen epitopes and in a multiplex setting concomitantly strips previously bound antibodies (leaving only depositions of Opal™ fluorophore at the antigen site), thus enabling the binding of subsequent primary antibodies.
6. Place slides vertically in Hellendahl staining jars and fill with AR6 or AR9 buffer (target epitope-dependent; 250 mL).
7. Microwave Hellendahl staining jars with lids on at full power until AR buffer boils, then immediately proceed at 20% power using a conventional microwave (1000 W) for 15 min at a constant buffer temperature of approximately 95°C.
8. Allow slides to cool for at least 15 min, and then wash slides for 2 min, 3 times in TRIS-buffered saline with 0.05% Tween-20 (TBST, 1×) and once in dH2O at room temperature (RT) on an orbital shaker at approximately 70 rotations per minute (rpm).
This step minimises background and non-specific binding that may occur.
9. Wash slides 2 min, 3 times in TBST at RT on an orbital shaker at approximately 70 rpm.
10. Dry slides with lint-free paper without touching the tissue (should always remain hydrated), and place slides horizontally in a slide staining humidity chamber (StainTray™ with black lid). If necessary, circle tissue with a hydrophobic barrier pen suitable for immunohistochemical staining to conserve reagents.
11. Cover tissue with Blocking/Antibody Diluent and incubate slides for 10 min at RT.
This step enables binding of the primary antibody to its cellular target.
12. Drain blocking buffer from each slide, cover tissue in optimal dilution of primary antibody in Blocking/Antibody Diluent (individual CD3e, Pan-γδ, granzyme B, BTN2A1, BTN3A1, PanCK or Melanoma Cocktail), and incubate slides for 30 min at RT or overnight at 4°C (antibody-dependent).
13. Rinse slides with TBST, transfer slides to Hellendahl staining jars and wash slides 2 min, 3 times in TBST at RT on an orbital shaker at approximately 70 rpm.
This step enables the reaction of the secondary antibody (HRP conjugate) with tissue-bound primary antibodies (raised in mouse or rabbit) for a rapid biotin-free detection.
14. Dry slides with lint-free paper without touching the tissue, and place slides horizontally in a staining humidity chamber.
15. Cover tissue with Opal™ Polymer HRP mouse and rabbit (Ms + Rb) for 10 min at RT.
16. Rinse slides with TBST, transfer to Hellendahl staining jars and wash slides 2 min, 3 times in TBST at RT on an orbital shaker at approximately 70 rpm.
This step enables reaction with TSA reagent (bound HRP catalyzes conversion of tyramide molecules into highly reactive free radicals) and signal amplification (free radicals form covalent bonds with tyrosine residues in proximal proteins and localise to the target antigens).
17. Dry slides with lint-free paper without touching the tissue, and place slides horizontally in a staining humidity chamber.
18. Cover tissue with optimal dilution of Opal™ fluorophore (individual Opal™ 520, 540, 570, 620, 650, or 690), and incubate slides for 10 min at RT.
19. Rinse slides with TBST, transfer to Hellendahl staining jars and wash slides 2 min, 3 times in TBST at RT on an orbital shaker at approximately 70 rpm.
20. Repeat 5 additional rounds of heat-induced epitope retrieval (HIER) and stripping, blocking, primary antibody incubation, secondary antibody incubation and Opal™ signal generation steps for each primary antibody.
Note. A total of 6 rounds of HIER and stripping, blocking, primary antibody incubation, secondary antibody incubation and Opal™ signal generation steps are required. In each round, a single primary antibody and a single Opal™ fluorophore is added to the tissue.
This step enables staining of all cell nuclei and prepares the slides for imaging.
21. Transfer slides to Hellendahl staining jars and fill with AR6 buffer (250 mL).
22. Microwave Hellendahl staining jars with lids on at full power until AR buffer boils, then immediately proceed at 20% power using a conventional microwave (1000 W) for 15 min at a constant buffer temperature of approximately 95°C.
23. Allow slides to cool for at least 15 min, rinse slides in TBST and then in dH2O at RT on an orbital shaker at approximately 70 rpm.
24. Dry slides with lint-free paper without touching the tissue, and place slides horizontally in a staining humidity chamber.
25. Cover tissue with DAPI (1 drop per 500 μL of dH2O) and incubate slides for 1 min at RT.
26. Transfer slides to Hellendahl staining jars and wash slides 2 min in TBST and then dH2O at RT on an orbital shaker at approximately 70 rpm.
27. Dry slides with lint-free paper without touching the tissue.
28. Apply 40 μL of VECTASHIELD Vibrance mounting medium to each slide and apply coverslips (22 mm × 50 mm). Ensure that no bubbles form on the tissue, as they will affect imaging and downstream analysis.
This step enables the determination of optimal imaging conditions and subsequent imaging of whole slide scans (WSS, 10×) and MSIs (20×).
29. For each slide use the Vectra® 3 Automated Quantitative Pathology Imaging System to manually set optimal exposure times for DAPI, fluorescein isothiocyanate (FITC), Cy3, Texas red and Cy5 channels for WSS (10×) and MSIs (20× or 40×).
30. Load slides into a slide cassette and perform WSS.
31. View WSS for each slide using Phenochart™ whole slide viewer, select regions of interest for MSI capture and image MSIs.
Note. The maximum dimension of tissue sections for imaging of WSS at 10× can be the full length and width of the coverslips used (22 mm × 50 mm). However, downstream spectral unmixing of Opal™ fluorophores and image analysis can only be performed on MSIs taken at 20× or 40× magnification of selected regions of interest. While MSIs can be taken of the whole tissue area, scanning time is substantially increased when compared to selected representative regions of interest.
This step enables qualitative and quantitative image analysis and cell phenotyping using sophisticated machine-learning-based software.
32. Spectrally unmix MSIs using the inForm® Cell Analysis software using custom or synthetic built-in spectral libraries for each Opal™ used, as per manufacturer instructions.
33. Perform subsequent tissue segmentation (e.g., tumour vs. normal tissue), adaptive cell segmentation (nucleus, cytoplasm, membrane), phenotyping and scoring to quantify cells of interest (e.g., CD3+Pan-γδ+granzymeB+ phenotype for activated γδ T cells) as per the Opal™ Multiple IHC Assay Development Guide and Image Acquisition Information (Akoya Biosciences) guide.
Note. Image analysis and subsequent data analysis are adaptable and specific to the user’s research needs, and hence specific step-by-step recommendations have not been included in this experimental protocol.
34. Alternatively, export unmixed MSIs as component images [multi-image tag image file format (TIFF)] and analyse using the HALO® Image Analysis Platform (Indica Labs, recommended), which also includes spatial analysis, as per the software version-specific user guide.
A summarised flowchart of this protocol is shown in Figure 1 below.
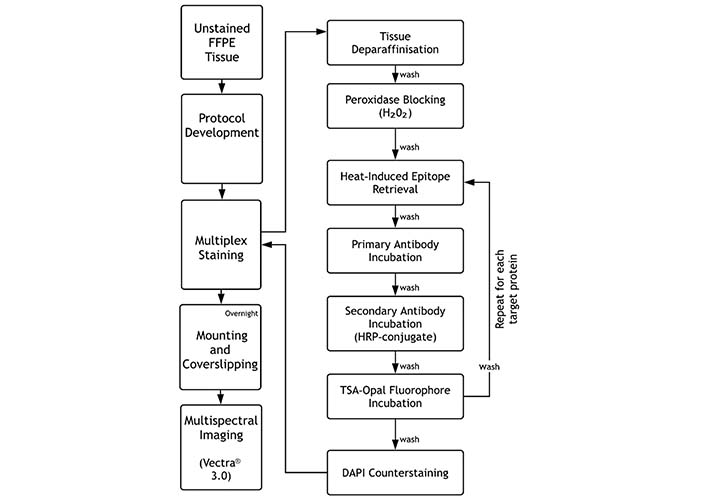
Flowchart of Opal™-TSA multiplex immunohistochemistry assay. Following protocol development and FFPE tissue section preparation, specimens undergo sequential target staining through repetition of HIER and striping, blocking, primary antibody incubation, secondary antibody incubation Opal™ signal generation, followed by DAPI counterstaining, slide mounting and imaging
Prior to performing panel development, individual primary antibodies underwent optimisation to determine optimal dilution and incubation times using serial sections of positive control tissue, in accordance with the Opal™ Multiple IHC Assay Development Guide and Image Acquisition Information (Akoya Biosciences) guide. Briefly, after identifying a tissue type suitable for use as a positive control (vendor-recommended or https://www.proteinatlas.org/), three different concentrations (vendor-recommended concentration, and then 1:2 and 1:4 subsequent dilution from the vendor-recommended concentration) were tested for 30 min using both AR6 and AR9 buffer (6 serial sections in total). Optimal conditions include appropriate staining pattern and cellular localisation, with specific, consistent and intense Opal™ signal with negligible background. Moreover, appropriate negative controls (negative control tissue and primary antibody omission on positive control tissue) and autofluorescence controls (positive control tissue) should also be performed.
Representive MSIs of these positive control stains for CD3 (healthy tonsil tissue, 1:100 dilution for 30 min), granzyme B (healthy tonsil tissue, 1:125 dilution for 30 min), Pan-γδ (PanGD; healthy tonsil tissue, 1:100 dilution for 30 min), BTN2A1 (melanoma tissue, 1:500 dilution overnight), BTN3A1 (melanoma tissue, 1:1,000 dilution overnight), PanCK (healthy colon tissue, 1:40 dilution for 30 min) and melanoma cocktail (cell block from in-house melanoma cell line LM-MEL-75, 1:100 dilution for 30 min) antibodies are included in Figure 2 below.
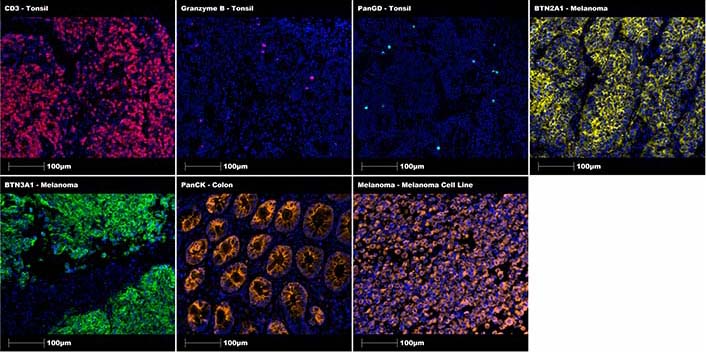
Positive control staining of individual markers using specific tissue sections. Representative regions of interest showing CD3 in tonsil (red), granzyme B in tonsil (magenta), Pan-γδ in tonsil (cyan), BTN2A1 in melanoma (yellow), BTN3A1 in melanoma (green), PanCK in colon (orange), melanoma cocktail in melanoma (orange) with DAPI (blue) counterstain. All images were taken at 20× magnification, and scale bars indicate 100 μm
Two 7-marker mIHC panels were subsequently optimised for the detection of γδ T cells and BTN ligands in epithelial cancer FFPE tissue (including colon, lung, breast, prostate, and bladder cancer) and in melanoma FFPE tissue. Panel 1 is indicated for use in epithelial cancers and includes CD3, Pan-γδ TCR, granzyme B, BTN2A1, BTN3A1, PanCK, and DAPI, while panel 2 is indicated for use in melanoma and includes CD3, Pan-γδ TCR, granzyme B, BTN2A1, BTN3A1, melanoma cocktail, and DAPI. The specific conditions used for each panel, including the HIER buffer used, the sequence of primary antibody and Opal™ fluorophores, the primary antibody concentrations and incubation times, and the Opal™ fluorophores and concentrations used are detailed in Tables 2 and 3 below.
Staining conditions for panel 1 (epithelial cancer tissue)
| HIER buffer (pH) | HIER incubation time | Primary antibody | Antibody dilution | Antibody incubation time | Secondary antibody | Secondary antibody incubation time | Opal™ | Opal™ dilution | Opal™ incubation time |
|---|---|---|---|---|---|---|---|---|---|
| AR9 | 15 min | CD3e | 1:100 | 30 min | HRP | 10 min | 520 | 1:100 | 10 min |
| AR9 | 15 min | BTN3A1 | 1:1,000 | Overnight | HRP | 10 min | 540 | 1:100 | 10 min |
| AR9 | 15 min | Granzyme B | 1:125 | 30 min | HRP | 10 min | 570 | 1:100 | 10 min |
| AR9 | 15 min | BTN2A1 | 1:500 | Overnight | HRP | 10 min | 620 | 1:100 | 10 min |
| AR9 | 15 min | Pan-γδ | 1:100 | 30 min | HRP | 10 min | 650 | 1:100 | 10 min |
| AR9 | 15 min | PanCK | 1:40 | 30 min | HRP | 10 min | 690 | 1:50 | 10 min |
This panel includes markers for CD3, Pan-γδ TCR, granzyme B, BTN2A1, BTN3A1, PanCK, and DAPI.
* using the following stock concentrations: CD3e: not determined (supplied as cell culture supernatant); BTN3A1: 0.1 mg/mL; granzyme B: 6 μg/mL; BTN2A1: 50 μg/mL; Pan-γδ: 0.1 mg/mL; PanCK: 80 μg/mL
Staining conditions for panel 2 (melanoma tissue)
| HIER buffer (pH) | HIER incubation time | Primary antibody | Antibody dilution | Antibody incubation time | Secondary antibody | Secondary antibody incubation time | Opal™ | Opal™ dilution | Opal™ incubation time |
|---|---|---|---|---|---|---|---|---|---|
| AR9 | 15 min | CD3e | 1:100 | 30 min | HRP | 10 min | 520 | 1:100 | 10 min |
| AR9 | 15 min | BTN3A1 | 1:1,000 | Overnight | HRP | 10 min | 540 | 1:100 | 10 min |
| AR9 | 15 min | Granzyme B | 1:125 | 30 min | HRP | 10 min | 570 | 1:100 | 10 min |
| AR9 | 15 min | BTN2A1 | 1:500 | Overnight | HRP | 10 min | 620 | 1:100 | 10 min |
| AR9 | 15 min | Pan-γδ | 1:100 | 30 min | HRP | 10 min | 650 | 1:100 | 10 min |
| AR9 | 15 min | Melanoma | 1:100 | 30 min | HRP | 10 min | 690 | 1:50 | 10 min |
This panel includes markers for CD3, Pan-γδ TCR, granzyme B, BTN2A1, BTN3A1, melanoma cocktail, and DAPI.
* using the following stock concentrations: CD3e: not determined (supplied as cell culture supernatant); BTN3A1: 0.1 mg/mL; granzyme B: 6 μg/mL; BTN2A1: 0.05 mg/mL; Pan-γδ: 0.1 mg/mL; melanoma: not determined (supplied as cell culture supernatant)
Following optimisation, these panels have been successfully used to stain γδ T cells and BTN ligands in full-face tissue sections and tissue microarrays in lung cancer, colon cancer, prostate cancer, breast cancer, bladder cancer and melanoma. Representative merged (on left) and single channel (on right) MSIs of each panel on a lung cancer specimen (primary lung adenocarcinoma in the lung, upper panel) and a melanoma specimen (metastatic melanoma in the skin, lower panel). BTN2A1 and BTN3A1 ligands co-stain mainly with tumour cells (PanCK+ and melanoma cocktail+) in both lung cancer and melanoma, γδ T cells (Pan-γδ+) are detected in the tumour microenvironment, albeit in low abundance, co-stain with the CD3 pan-T cell marker (CD3+) and include inactive (CD3+Pan-γδ+granzymeB–) and active (CD3+Pan-γδ+granzymeB+) subsets are included in Figure 3 below.
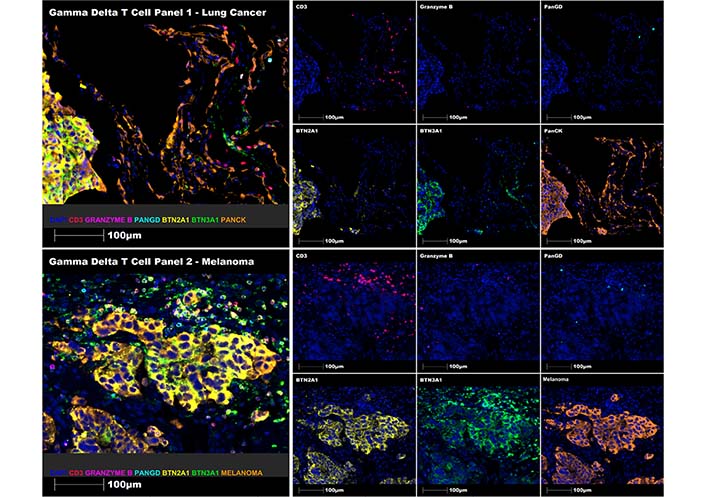
Multiplex staining of γδ T cell panels 1 (upper panel) and 2 (lower panel) using representative human lung cancer and melanoma FFPE tissue sections, respectively. Representative regions of interest showing merge and single staining for panel 1: CD3 (red), granzyme B (magenta), Pan-γδ (cyan), BTN2A1 (yellow), BTN3A1 (green), and PanCK (orange) antibodies with DAPI (blue) counterstain (upper immune-fluorescence panel); and panel 2: CD3 (red), granzyme B (magenta), Pan-γδ (cyan), BTN2A1 (yellow), BTN3A1 (green) and melanoma cocktail (orange) antibodies with DAPI (blue) counterstain (lower immune-fluorescence panel). All images were taken at 20× magnification, and scale bars indicate 100 μm
This comprehensive protocol enables users to identify and quantify intratumoural γδ T cells and their BTN2A1 and BTN3A1 ligands using single human FFPE solid tumour tissue sections. This tool can be used to further elucidate the potential anti- and pro-tumoural roles of γδ T cells in the microenvironment of solid tumours.
AR: antigen retrieval
AR6 buffer: antigen retrieval buffer at pH6
BTN: butyrophilin
DAPI: 4’,6-diamidino-2-phenylindole
dH2O: deionised water
FFPE: formalin-fixed paraffin-embedded
HIER: heat-induced epitope retrieval
HRP: horseradish peroxidase
IHC: immunohistochemistry
mIHC: multispectral immunohistochemistry
MSI: multispectral image
PanCK: pan-cytokeratin
rpm: rotations per minute
RT: room temperature
TBST: TRIS-buffered saline with Tween-20
TCRs: T cell receptors
TSA: tyramide signal amplification
WSS: whole slide scans
The Olivia Newton-John Cancer Research Institute acknowledges the support of the Victorian Government Operational Infrastructure Support Program, and the Ian Potter Foundation for providing funds to purchase the Vectra System. We would also like to thank Dr Khashaya Asadi, Austin Pathologist, for the provision of lung cancer FFPE tissue slides.
JDGD, LTQ, ET, SO and AB contributed to the concept, design and execution of the method; JDGD wrote the original manuscript; LTQ, SO and AB reviewed and edited the manuscript; JDGD and AB supervised the project; AB acquired funding for the project. All authors have read and agreed to the published version of the manuscript.
AB is the recipient of research funding for work on butyrophilins in cancer; AB and SO are inventors on multiple patents related to the topic. No other authors declare a conflict of interest.
Not applicable.
Not applicable.
Not applicable.
Not applicable.
JDGD is supported by Cure Cancer Australia through the Cancer Australia Priority—Driven Cancer Research Scheme (#1187815). The contents of the published material are solely the responsibility of La Trobe University and do not reflect the views of Cancer Australia. AB is the recipient of a Fellowship from the Victorian Government Department of Health and Human Services acting through the Victorian Cancer Agency. The funders had no role in study design, data collection and analysis, decision to publish, or preparation of the manuscript.
© The Author(s) 2022.
Copyright: © The Author(s) 2022. This is an Open Access article licensed under a Creative Commons Attribution 4.0 International License (https://creativecommons.org/licenses/by/4.0/), which permits unrestricted use, sharing, adaptation, distribution and reproduction in any medium or format, for any purpose, even commercially, as long as you give appropriate credit to the original author(s) and the source, provide a link to the Creative Commons license, and indicate if changes were made.

Xiangjin Zhang ... Wei He
Huidi Wang ... Jia Yin
Chang Liu ... Wei He
Joseph M. McGraw, Deborah A. Witherden
Yue Wang ... Wei He
Rupert Handgretinger ... Manon Queudeville
Gabrielle M. Ferry, John Anderson
Juan-Pablo Cerapio ... Jean-Jacques Fournie
Alessandro Poggi, Maria Raffaella Zocchi
Navdeep Jhita, Sunil S. Raikar
