 Original Article

Affiliation:
1Laboratorio de Investigación en Nutrición, Facultad de Medicina, Universidad Autónoma del Estado de México, Toluca 50180, México
Email: martinez_elina9@hotmail.com
ORCID: https://orcid.org/0000-0002-2663-5202
Affiliation:
1Laboratorio de Investigación en Nutrición, Facultad de Medicina, Universidad Autónoma del Estado de México, Toluca 50180, México
ORCID: https://orcid.org/0000-0002-0242-0928
Affiliation:
1Laboratorio de Investigación en Nutrición, Facultad de Medicina, Universidad Autónoma del Estado de México, Toluca 50180, México
ORCID: https://orcid.org/0000-0003-0093-886X
Affiliation:
2Laboratorio de Inmunología de mucosas, Sección de Estudios de Posgrado e Investigación, Escuela Superior de Medicina, Instituto Politécnico Nacional, Ciudad de México 11340, México
ORCID: https://orcid.org/0000-0003-1415-5524
Affiliation:
1Laboratorio de Investigación en Nutrición, Facultad de Medicina, Universidad Autónoma del Estado de México, Toluca 50180, México
ORCID: https://orcid.org/0000-0001-6364-0775
Affiliation:
3Laboratorio de Morfología, Sección de Estudios de Posgrado e Investigación, Escuela Superior de Medicina, Instituto Politécnico Nacional, Ciudad de México 11340, México
ORCID: https://orcid.org/0000-0003-0467-2528
Affiliation:
4Clínica Multidisciplinaria de Salud, Universidad Autónoma del Estado de México, Toluca 50130, México
ORCID: https://orcid.org/0000-0002-0294-2515
Explor Immunol. 2025;5:1003195 DOI: https://doi.org/10.37349/ei.2025.1003195
Received: June 09, 2024 Accepted: April 15, 2025 Published: May 20, 2025
Academic Editor: Lucia Malaguarnera, Università degli Studi di Catania, Italy
The article belongs to the special issue The Nutritional Influence on Immune Functionality
Aim: This study aims to analyze the impact of sucrose consumption on inflammatory and immunological parameters of newborn offspring of females with gestational diabetes mellitus (GDM).
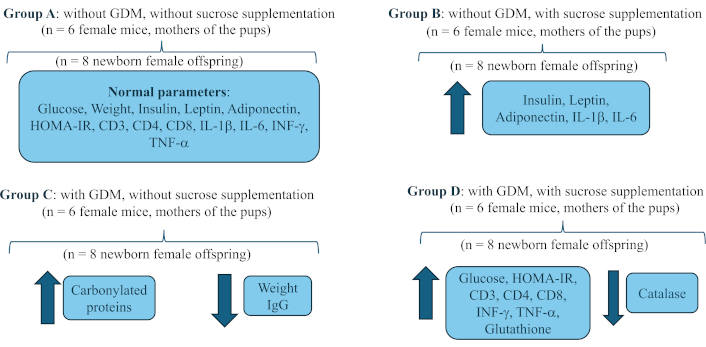
Methods: 4 groups of pregnant female CD1 mice were created (n = 6): A, without GDM, without sucrose supplementation; B, without GDM, with sucrose supplementation; C, with GDM, without sucrose supplementation; and D, with GDM, with sucrose supplementation. GDM was induced by subcutaneous injection of streptozotocin, with a dose of 230 mg/kg. Sucrose supplementation was administered at a concentration of 41.66 mg/mL per oral stool (500 μL volume) to each female daily at 8:00 am from confirmation of gestational diabetes until the end of pregnancy. Immediately after birth, the pups were sacrificed in the first 2 h of life. The following were quantified in each group of 8 newborns: body weight, glycaemia, leptin, adiponectin, insulin, HOMA-IR index, percentage of lymphocytes: CD3, CD4, and CD8, immunoglobulins (IgA and IgG), cytokines (IL-1β, IL-6, TNF-α, and IFN-γ), and redox activity: (carbonylated proteins, malondialdehyde, superoxide dismutase, catalase, reduced glutathione, total antioxidant capacity).
Results: Sucrose consumption increased the levels of adiponectin, IL-1β, IL-6 and decreased the concentration of IgA in the offspring. Group C and D caused lower body weight and higher concentration of carbonylated proteins. The combination of sucrose and GDM favored an increase in blood glucose, the HOMA-IR index, the percentage of T lymphocytes, the concentration of proinflammatory cytokines, and reduced glutathione, with reduction of catalase.
Conclusions: Sucrose consumption by mothers during pregnancy and the presence of GDM generate alterations at the cellular, immunological, metabolic, hormonal, and redox levels in newborns. This results in an inflammatory state, with an imbalance in the redox state, which predisposes the newborn to short and medium-term metabolic problems from birth.
Gestational diabetes mellitus (GDM), a condition characterized by hyperglycemia and impaired glucose tolerance [1], becomes evident between the 24th and 28th weeks of gestation [2]. Recognized globally as a public health problem, GDM affects 30% of pregnancies worldwide and roughly 20% of pregnant women in Mexico [3, 4]. It can lead to a series of perinatal complications such as macrosomia, cesarean delivery, shoulder dislocation during delivery, neonatal hypoxia, and more [5, 6]. Furthermore, several postnatal issues can develop within the child’s initial 10 years [2, 3, 7, 8].
Diet, particularly the consumption of sucrose, plays a significant role in the occurrence of GDM [4]. A high-sucrose diet has been researched in healthy and unhealthy individuals and found to result in hyperglycemia, hyperlipidemia, pro-inflammatory states, and increased body weight [9]. However, there’s a scarcity of data relating to sucrose intake during pregnancy when GDM is present, specifically its impact on the offspring.
Hormones leptin and adiponectin, which affect insulin functionality, are additional factors contributing to the emergence of GDM. A failure in leptin’s role in regulating food intake and satiety leads to metabolic and energy imbalances, fostering insulin resistance and triggering GDM [10, 11]. This imbalance in leptin may also reduce adiponectin levels [10]. Adiponectin, an adipokine, enhances insulin sensitivity and has anti-inflammatory effects. Thus, lower adiponectin concentrations heighten GDM risk [12, 13]. Elevated carbohydrate consumption, particularly of sucrose, may increase postprandial leptin and adiponectin levels [14, 15].
Moreover, pregnancy induces a pro-inflammatory state characterized by tumor necrosis factor-α (TNF-α) production, subsequently encouraging the formation of reactive oxygen species (ROS). This process results in and exacerbates oxidative stress in pregnant patients, worsening their metabolic condition [12]. Animal studies indicate that consuming excessive amounts of sucrose may amplify this pro-inflammatory state and oxidative stress, increasing malondialdehyde (MDA) levels and decreasing reduced glutathione, oxidized glutathione, and superoxide dismutase [16]. This is further intensified by the downregulation of genes that produce antioxidant enzymes, such as catalase, glutathione peroxidase, and glutathione reductase [17].
Regrettably, current literature provides inadequate evidence to explain how high sucrose consumption in GDM-affected pregnant mothers directly influences hormonal, immune, and oxidant/antioxidant marker activity in their children. Therefore, this study aims to investigate the effect of sucrose intake on the inflammatory and immunological parameters of infants born to women diagnosed with GDM, since nowadays chronic diseases are being seen in earlier ages like scholars and teenagers, without and adequate diagnosis and treatment.
This experimental, prospective, controlled and randomized study was carried out with the offspring of 24 specific pathogen-free female CD1 mice from the bioterium of the Nutrition Research Laboratory of the Faculty of Medicine, Universidad Autónoma del Estado de México (UAEMéx). The rodents’ care and maintenance adhered to the Official Mexican Standard NOM-062-ZOO-1999, setting technical specifications for the production, care, and use of laboratory animals [18]. Additionally, we followed the ARRIVE (Animal Research: Reporting of In Vivo Experiments) guidelines for animal studies [19]. Pregnant females were housed two per box and fed a standard diet of Rodent Laboratory Chow 5001 (3.02 kcal/g). Water was provided ad libitum, with consistent 12/12 h light-dark cycles.
To produce offspring, we used 24 ten-week-old CD1 female mice that were housed two per cage with one male for mating over 5 days. On the fifth day, we checked the females for pregnancy indicators through vaginal cytology, wherein the presence of a vaginal plug served as a positive confirmation [20]. After confirming pregnancy, we randomly distributed the 24 females into four groups, with each group containing six females.
Group A: without GDM, without sucrose supplementation.
Group B: without GDM, with sucrose supplementation.
Group C: with GDM, without sucrose supplementation.
Group D: with GDM, with sucrose supplementation.
Upon confirmation of pregnancy on the fifth day, the females were subject to pharmacologically induced GDM. A single dose of streptozotocin (230 mg/kg body weight) was administered subcutaneously, with a citrate buffer solution acting as a diluent [21]. Blood glucose levels were recorded over the next five mornings using a portable glucometer (One Touch Brand, Select Plus Flex Model) starting from the day of inoculation. GDM was confirmed if a female recorded a blood glucose level over 200 mg/dL, adhering to the criteria set by the American Diabetes Association in 2022 [22]. The criteria include a sustained glucose concentration of 200 mg/dL or more, polyphagia, polydipsia, and noticeable changes in body weight.
For groups B and D, we prepared a sucrose supplement solution at a concentration of 41.66 mg/mL using purified water. This solution adhered to the guidelines of the Official Mexican Standard NOM-218-SSA1-2011 for producing and using sweetened and non-alcoholic flavored beverages [23]. Once prepared, 500 µL of the solution was administered orally to each female from the beginning to the end of gestation, at 8:00 am (Figure 1).
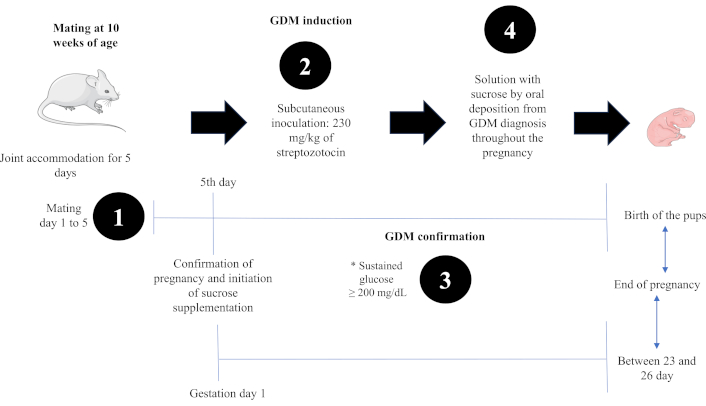
Experimental design to obtain offspring from mothers with gestational diabetes mellitus and sucrose consumption. * To confirm the diagnosis of GDM, glucose, body weight, food intake and water consumption were quantified for 5 days to establish clinical signs of GDM. Images of the figure were used from or adapted from pictures provided by Servier Medical Art, licensed under CC BY 4.0
Once the gestation period was over, the offspring were sacrificed by decapitation by a skilled operator, immediately after birth to avoid consumption of breast milk, thus avoiding a biased quantification of immunoglobulin A (IgA). Before euthanasia in an ether chamber, each pup was weighed using a mouse scale (Model CS200-001, OHAUS, New Jersey, USA). Given their size and weight, individual blood samples obtained from newborn pups were insufficient (50 µL per pup). Therefore, pooled blood samples were collected from each litter (approximately 8 to 12 pups per female). These pooled samples were then centrifuged at 2,000 rpm for 10 min to extract serum.
Insulin (Cat. No. ENZ-KIT141-0001, Enzo, New York, USA), leptin (Cat. No. ADI-900-019A, Enzo, New York, USA), and adiponectin (Cat. No. KMP0041, Invitrogen, Vienna, Austria) were quantified by enzyme-linked immunosorbent assay (ELISA-test) as part of the hormonal profile. All samples were prepared according to the protocols provided by the manufacturers. The homeostatic model assessment index was applied to measure insulin sensitivity and resistance, using the formula: HOMA = [(Glycaemia (mg/dL)/18.2)] × Insulin (mU/mL)/22.517 [24].
The immunological profile was determined using the T lymphocyte phenotype, identified by surface markers CD3, CD4, CD8, and immunoglobulins IgA and IgG in whole blood and serum samples. The percentage of the following cell populations was determined: CD3+/CD8+/CD4+, using the flow cytometry technique. The staining of the lymphocytes was carried out using the next anti-mouse antibodies from Becton Dickinson (BD) Technologies: PE-CD3a (cat. 553064, BD Pharmingen), APC-CD8a (cat. 553035, BD Pharmingen), obtained from Pharmingen (San Diego, CA), and PERCP-CD4 (cat.100538, BioLegend), obtained from BioLegend (San Diego, CA). Cytokines were quantified using BioLegend antibodies: anti-interleukin-6 (IL-6)/PE (Cat. No. 504504), anti-TNF-α/PE (Cat. No. 506306), anti-mouse interferon-γ (IFN-γ)/FITC (Cat. No. 505806) and from R&D Systems anti-IL-1β/FITC (Cat. No. IC4013F) obtained from Pharmingen (San Diego, CA).
From the whole blood sample, lymphocytes were obtained using a 1:2 Ficoll gradient. The cell band was collected and washed with RPMI medium at 1,500 rpm. Thereafter, the cell suspensions were adjusted to 1 × 10⁶ cells/mL in PBS for cytofluorometric analysis of the intracellular signals of IFN-γ, IL-6, TNF-α, and IL-1β in CD4+ T cells; these analyses were conducted based on previously described protocols (Arciniega-Martínez et al., 2016) [25]. The cell suspension was adjusted to 1 × 10⁶ cells/mL/tube in PBS, following the technique of Arciniega-Martínez et al. [25], with some modifications for cytofluorometric analysis [25]. Each tube was labeled according to the corresponding antibody and stain mixture: a) CD3+/CD4+/CD8+, b) CD4+/IL-1β+/IL-6+, and c) CD4+/TNF-α+/IFN-γ+.
Ten microliters of the antibody mixture were added to tubes. They were incubated for 20 min in the dark. Staining tube 1 was filled with 500 µL of PBS and centrifuged for 5 min at 1,500 rpm; the supernatant was discarded, and 500 µL of paraformaldehyde was added. For staining tubes 2 and 3, 200 µL of Citofix/CitoPerm was added, and they were incubated for 20 min in the dark. After incubation, they were centrifuged for 5 min at 1,500 rpm, decanted, and 500 µL of PermWash was added. Another wash was performed, and 10 µL of mix of (IL-1β/IL-6) and (TNF-α/IFN-γ) antibodies were added. They were incubated for 20 min in the dark. After this, 500 µL of PermWash was added to each tube, centrifuged again for 5 min at 1,500 rpm, and kept refrigerating until reading on the cytometer. The fluorescence signal intensity was recorded and analyzed by a FACSCalibur flow cytometer (Becton Dickinson Biosciences San Jose CA, USA). Events were collected from the lymphocyte gate on the FSC/SSC dot plot. A total of 20,000 gated events were acquired from each sample using BD FACSDiva™ software 6.1 (Becton Dickinson Biosciences). Data was analyzed using Summit software v4.3 (Dako, Fort Collins CO, USA).
The determination of IgA and IgG was conducted using the direct ELISA technique with three antibodies: Goat Anti-mouse IgA HRP (Cat. No. I1890-21, USbiological, Massachusetts, USA), Peroxidase-conjugated Goat IgG fraction to mouse IgG F(AB’)2 (Cat. No. 55553, MP Biomedicals, California, USA), and Goat Anti-mouse IgM (Cat. No. A135PN, American Qualex, California, USA). We added 50 µL of each sample to a 96-well plate and incubated it overnight at 4°C.
Next, we washed the plate with 200 µL PBS-Tween per well. To block the plate, we added 200 µL of 5% Svelty solution per well and incubated it at 37°C for 1 h. After a subsequent wash, we added 200 µL of each diluted (1:3,000) antibody in 5% Svelty and incubated at 37°C for 1 h. We covered the plate with aluminum during this step.
We then performed another wash and added 200 µL of the orthophenylenediamine (OPD) substrate per well. The plate was left for 15 min. Afterward, we added 100 µL of 98% sulfuric acid [H2SO4] solution per well to stop the reaction. We used a microplate reader (Molecular Device Brand, Emax Model) at a wavelength of 492 nm.
We performed determinations of oxidant activity markers, specifically MDA (Cat. No. DTBA-100, BioAssay Systems, California, USA), and the concentration of carbonylated proteins, using dinitrophenylhydrazine (DNPH) [26]. The Lowry technique was employed for protein determination. Regarding the antioxidant activity markers, we utilized commercial kits: superoxide dismutase (Cat. No. ESOD-100), catalase (Cat. No. ECAT-100), total antioxidant capacity (Cat. No. DTAC-100), and reduced glutathione (Cat. No. DIGT-250), all sourced from BioAssay Systems (California, USA), in compliance with the supplier’s instructions.
We processed the collected data using the Statistical Package for the Social Sciences (SPSS, version 19.0; SPSS Inc., Chicago, IL, USA) software. We evaluated data normality with the Shapiro-Wilk test and obtained measures of central tendency. We performed a one-way analysis of variance (ANOVA) test to identify intergroup differences and employed a post hoc HSD Tukey’s test to ascertain intragroup differences. We deemed differences significant if the P value was less than 0.05.
Significant differences in body weight were observed among the groups (P < 0.050) of offspring (Table 1). Group C’s weight was notably lower (P < 0.050, pos hoc Tukey’s test) compared to Groups A, B, and D, while no significant variances were detected between other groups (Table 1). Elevated glycemia levels were detected in offspring whose mothers had experienced GDM, evident in Group D (pos hoc Tukey’s test, P < 0.001) (Table 1), compare to Groups A and B. Noteworthy differences emerged between groups that had sucrose supplementation (B and D, P < 0.001, pos hoc Tukey’s test) and groups comprising offspring with GDM (C and D, P < 0.001, pos hoc Tukey’s test).
Anthropometric and hormonal variables in newborn offspring of females with and without GDM and sucrose consumption
| Variables | Group A | Group B | Group C | Group D | P value |
|---|---|---|---|---|---|
| Mean ± SDn = 8 | Mean ± SDn = 8 | Mean ± SDn = 8 | Mean ± SDn = 8 | ||
| Body weight (g) | 1.75 ± 0.16 | 1.70 ± 0.13 | 1.53 ± 0.10a | 1.67 ± 0.13 | < 0.050 |
| Glycaemia (mg/dL) | 79.2 ± 6 | 84.6 ± 5 | 91 ± 8 | 108.6 ± 12a | < 0.001 |
| Insulin (pg/mL) | 0.609 ± 0.16 | 0.682 ± 0.05 | 0.652 ± 0.07 | 0.624 ± 0.07 | 0.488 |
| HOMA-IR index | 0.751 ± 0.05 | 0.801 ± 0.05 | 0.861 ± 0.08 | 1.02 ± 0.12a | < 0.001 |
| Leptin (pg/mL) | 163 ± 11 | 220 ± 8.5 | 157 ± 20 | 128 ± 24 | < 0.001 |
| Adiponectin (µg/mL) | 166 ± 19 | 208 ± 8.1a | 200 ± 26 | 163 ± 10 | < 0.001 |
The values represent the mean ± standard deviation of body weight, glycaemia, insulin, leptin, adiponectin and HOMA index (homeostatic model assessment) at birth. Twenty-four CD1 female mice were used to obtain the offspring (n = 6 per group). To process the samples from the offspring, groups of 8 newborns were created. Group A = without GDM and without sucrose supplementation, Group B = without GDM with sucrose supplementation, Group C = with GDM without sucrose supplementation, and Group D = with GDM and sucrose supplementation. The one-way ANOVA test was performed to compare the means between groups, with Tukey’s post hoc test to identify intergroup differences. a Significant difference by Tukey’s test with group A. P value < 0.05 was considered statistically significant
Insulin concentration between the female offspring groups did not show any significant differences (P = 0.488). There were significant differences in the HOMA-IR index among the groups (P < 0.001) (Table 1). Group D (P < 0.001, pos hoc Tukey’s test), along with groups B and C (P < 0.001, pos hoc Tukey’s test), exhibited a higher HOMA-IR compared to Group A. Additionally, the leptin levels were significantly different (P < 0.001), showing an increase in Group B (P < 0.001, pos hoc Tukey’s test) and a decrease in groups D and C (P < 0.001 and P < 0.050, respectively, pos hoc Tukey’s test), compared to Group A. Lastly, adiponectin concentration was different among the groups (P < 0.001) (Table 1). The highest value was observed in Group B (P < 0.001, pos hoc Tukey’s test), followed by Group C (P < 0.001, pos hoc Tukey’s test), while Group D (P < 0.001, pos hoc Tukey’s test) had the lowest concentration compared to Group A.
Statistically significant differences were found in the percentage of TCD3+ lymphocytes (P < 0.001) (Table 2). Group D had the highest percentage (P < 0.001, pos hoc Tukey’s test), followed by Group C (P < 0.001, pos hoc Tukey’s test). Group B exhibited the lowest percentage (P < 0.001, pos hoc Tukey’s test) when compared to Group A (Figure 2).
Phenotype of T lymphocytes and pro inflammatory cytokines in newborns offspring of females with and without GDM with sucrose consumption
| Immune parameters | Group A | Group B | Group C | Group D | P value |
|---|---|---|---|---|---|
| Mean ± SDn = 8 | Mean ± SDn = 8 | Mean ± SDn = 8 | Mean ± SDn = 8 | ||
| T lymphocytes phenotype | |||||
| CD3+ (%) | 5.33 ± 0.21 | 2.79 ± 0.37 | 6.53 ± 0.03 | 14.97 ± 1.73a | < 0.001 |
| CD3+/CD4+ (%) | 2.27 ± 0.03 | 0.86 ± 0.17 | 4.06 ± 0.02 | 16.40 ± 2.51a | < 0.001 |
| CD3+/CD8+ (%) | 0.28 ± 0.12 | 0.43 ± 0.25 | 1.93 ± 0.10 | 3.53 ± 0.10a | < 0.001 |
| Pro inflammatory cytokines | |||||
| IL-1β pg/mL | 0.40 ± 0.04 | 6.13 ± 0.79a | 5.0 ± 0.02 | 2.9 ± 0.21 | < 0.001 |
| IL-6 pg/mL | 0.86 ± 0.15 | 11.67 ± 1.96a | 5.7 ± 0.05 | 7.17 ± 0.82 | < 0.001 |
| IFN-γ pg/mL | 0.28 ± 0.09 | 2.80 ± 0.58 | 5.61 ± 0.02 | 7.34 ± 1.14a | < 0.001 |
| TNF-α pg/mL | 0.54 ± 0.08 | 3.89 ± 0.32 | 2.88 ± 0.93 | 10.56 ± 0.21a | < 0.001 |
| Immunoglobulins | |||||
| IgA (OD) | 0.082 ± 0.016 | 0.066 ± 0.007a | 0.077 ± 0.004 | 0.081 ± 0.006 | < 0.001 |
| IgG (OD) | 0.227 ± 0.093 | 0.258 ± 0.067 | 0.157 ± 0.028a | 0.245 ± 0.07 | < 0.050 |
The values represent the mean ± standard deviation of the percentage of T lymphocytes, pro-inflammatory cytokines and the optical density (OD) of IgG and IgA. TCD3+ total lymphocytes, CD3+/CD4+ T helper, CD3+/CD8+ cytotoxic T lymphocytes, interleukin 1 beta (IL-1β), interleukin 6 (IL-6), interferon gamma (IFN-γ) and tumor necrosis factor alpha (TNF-α), immunoglobulin A (IgA), immunoglobulin G (IgG). Twenty-four CD1 female mice were used to obtain the offspring (n = 6 per group). To process the samples from the offspring, groups of 8 newborns were created. Group A = without GDM and without sucrose supplementation, Group B = without GDM with sucrose supplementation, Group C = with GDM without sucrose supplementation, Group D = with GDM and with sucrose supplementation. The one-way ANOVA test was performed to compare the means between groups, with Tukey’s post hoc test to identify intergroup differences a with group A. P value < 0.05 was considered statistically significant
Twenty-four CD1 female mice were used to obtain the offspring (n = 6 per group). To process the samples from the offspring, groups of 8 newborns were created, which were sacrificed immediately after birth to obtain blood samples
Group D displayed a significantly higher percentage of TCD3+/CD4+ lymphocytes compared to the other groups (P < 0.001) (Table 2). Although the increase in the percentage of CD3+/CD4+ Th lymphocytes in Group C was greater than that in Group A (P < 0.050, pos hoc Tukey’s test), it was less pronounced than in Group D. Moreover, Group B exhibited a decrease in this percentage compared to Group A (P < 0.001, pos hoc Tukey’s test).
The CD3+/CD8+ T lymphocyte group exhibited similar behavior, with the highest percentage found in Group D (P < 0.001, pos hoc Tukey’s test), followed by groups C and B in that order (P < 0.001 respectively) when all are compared to Group A (Table 2).
There were significant differences in the concentrations of both IgA (P < 0.001) and IgG (P < 0.050), as evidenced in Table 2. The IgA concentrations showed a marked decrease in groups B (P < 0.001, pos hoc Tukey’s test) and C (P < 0.050, pos hoc Tukey’s test) when compared to Group A, though there was no apparent difference when compared to Group D (P = 0.583, pos hoc Tukey’s test). As for IgG, it was observed that the concentration was the lowest in Group C (P < 0.050, pos hoc Tukey’s test) while being notably higher in groups B and D (P < 0.001 and P < 0.001, respectively, pos hoc Tukey’s test).
All groups exhibited elevated levels of pro-inflammatory cytokines compared to Group A, with significant localizations found in the interleukins IL-1β and IL-6 for Group B (P < 0.001 and P < 0.050, pos hoc Tukey’s test); notably, IFN-γ and TNF-α showed significant elevations in Group D (P < 0.001 and P < 0.001, respectively), as seen in Table 2.
The offspring’s serum was analyzed for carbonylated protein concentration, with significant differences found between the groups (P < 0.001), like seen in Table 3. Group C had the highest concentration (P < 0.001, pos hoc Tukey’s test), followed by Group D (P < 0.050, pos hoc Tukey’s test), in comparison to Group A. Conversely, Group B showed a lower concentration (P < 0.050, pos hoc Tukey’s test), even less than Group A (Table 3). However, the MDA quantification between groups showed no significant differences (P = 0.074), as highlighted in Table 3.
Redox activity in newborn offspring with and without GDM and sucrose consumption
| Oxidation/reduction parameters | Group A | Group B | Group C | Group D | P value |
|---|---|---|---|---|---|
| Mean ± SDn = 8 | Mean ± SDn = 8 | Mean ± SDn = 8 | Mean ± SDn = 8 | ||
| CP (nmol/mg protein) | 12.47 ± 1.31 | 3.70 ± 0.46 | 44.91 ± 27.09a | 23.10 ± 5.56 | < 0.001 |
| MDA (µM) | 0.193 ± 0.086 | 0.171 ± 0.039 | 0.115 ± 0.074 | 0.139 ± 0.006 | 0.074 |
| SOD (U/mL) | 2.37 ± 0.93 | 2.98 ± 0.76 | 2.67 ± 0.92 | 1.82 ± 0.74 | 0.063 |
| Catalase (U/L) | 0.017 ± 0.002 | 0.015 ± 0.003 | 0.015 ± 0.002 | 0.012 ± 0.005a | < 0.050 |
| RG (µM) | 83.42 ± 6.57 | 67.27 ± 6.58 | 81.88 ± 20.53 | 121.06 ± 17a | < 0.001 |
| TAC (µM eq. of Trolox) | 0.404 ± 0.164 | 0.224 ± 0.236 | 0.607 ± 0.001a | 0.469 ± 0.205 | < 0.001 |
The values represent the mean ± standard deviation of the serum concentration of carbonylated proteins (CP), MDA, superoxide dismutase (SOD), catalase, reduced glutathione (RG) and total antioxidant capacity (TAC) with its units in µM eq. of Trolox. Twenty-four CD1 female mice were used to obtain the offspring (n = 6 per group). To process the samples from the offspring, groups of 8 newborns were created. Group A = without GDM and without sucrose supplementation, Group B = without GDM with sucrose supplementation, Group C = with GDM without sucrose supplementation, Group D = with GDM and with sucrose supplementation. The one-way ANOVA test was performed to compare the means between groups, with Tukey’s post hoc test to identify intergroup differences a with group A. P value < 0.05 was considered statistically significant
Superoxide dismutase quantification revealed no significant differences between the groups (P = 0.063) (Table 3). Conversely, there were notable differences in catalase levels (P < 0.050), with all groups showing lower concentrations compared to Group A; Group D registered the lowest concentration (P < 0.050, pos hoc Tukey’s test) (Figure 2). Distinct differences were also observed in reduced glutathione (P < 0.001, like seen in Table 3), with an incremented level in Group D (P < 0.001, pos hoc Tukey’s test) but a decline in concentration in Group B (P < 0.001, pos hoc Tukey’s test). The total antioxidant capacity (TAC) demonstrated significant differences (P < 0.001, Table 3), recording its peak concentration in the offspring of Group C (P < 0.001, pos hoc Tukey’s test), whereas the lowest concentration was found in Group B (Table 3).
The newborns of mothers without gestational diabetes (GDM) and without sucrose intake (Group A) had a higher body weight compared to those of mothers with GDM and sucrose consumption (Group D). Research in 2017 [27] showed that sucrose intake during pregnancy without GDM resulted in lower birth weight when compared to those from mothers who abstained, the findings are consistent with those reported in this study. Meanwhile, the offspring from non-GDM mothers with sucrose ingestion (Group B) had less body weight than Group A. On the contrary, another study [28] analyzing the perinatal effects of sucrose in pregnant rats found that offspring were heavier when a significant proportion of sucrose was included in the diet (20%). This could be a result of increased glucose exposure to the fetus, leading to enhanced weight gain in the womb. However, this was not observed in this study despite administering a 46% sucrose solution via daily oral deposition. These findings show that the type and quantity of carbohydrates consumed have effects on both mother and fetus, as well as influencing body weight and GDM onset. It is also noted that a diet with 75% more simple carbohydrates could increase offspring’s body weight compared to a 35% carbohydrate diet [29]. However, another study [30] showed no effect on offspring’s weight when mothers’ sucrose exposure was either prenatal or postnatal up until the offspring’s 12th week of life. Outcomes are still contradictory; some reports indicate that offspring from GDM mothers have a higher birth weight due to elevated blood glucose levels affecting the fetus [2, 10]. This is attributed to the activation of insulin’s anabolic pathways, resulting in increased adipose tissue generation [31, 32]. Yet, another study [6] found no significant birth weight differences between offspring from GDM and non-GDM mothers. Interestingly, a literature review [33] suggested that infants of GDM mothers might have a lower weight due to an increased risk of premature birth, which implies less intrauterine development time, resulting in low weight for gestational age. Also, a separate experiment [34] utilizing diabetic rats induced with streptozotocin, which were fed a sucrose syrup snack, showed their offspring had a lower weight, supporting the findings of this study. Regarding the glycemia of the offspring, it was found that groups with GDM (Groups D and C) and the non-GDM group with sucrose consumption (Group B) recorded the highest glucose concentrations (Figure 2). The effect of consuming simple sugars in newborns was first showcased in an early animal study [35], showing that female consumption of fructose (a component of sucrose that can cross the placenta) resulted in increased blood glucose in young at birth versus the reference group. Our study reinforces these findings, as Group B offspring had higher blood glucose levels than Group A’s. The authors suggest that the increase is likely due to an overexpression of the glucose transporter GLUT-9 in the placenta, which helps transport both glucose and fructose to the fetus, resulting in a steady state of hyperglycemia, even at birth. However, this contradicts the common understanding as neonates of mothers with GDM often have neonatal hypoglycemia due to high levels of maternal insulin and glucose, hence causing a significant drop in glycemia at birth [2, 10, 36].
The rise in glucose concentrations can be linked to the non-changing insulin levels (Table 1). The HOMA-IR index, on the other hand, displays an increase, specifically among offspring groups B, C, and D (Table 1). An additional 10% fructose in the diet may enhance leptin and insulin signaling within the first 21 days after birth, promoting long-term insulin resistance [29, 37]. This predisposes the offspring to a risk of developing perpetual insulin resistance [2, 38, 39]. Contrarily, another study found higher plasma glucose levels and HOMA-IR index in children born to mothers with GDM as opposed to those without GDM [8]. Despite this study lacking short-, medium-, and long-term follow-up, reports suggest that, in the long run, children of GDM mothers may exhibit reduced sensitivity, production, and release of insulin by the pancreatic beta cells between 18 and 27 years of age [40]. Supporting this, a study involving GDM rat offspring monitoring found their HOMA-IR index to be higher compared to healthy mothers’ offspring at an early stage [41]. Leptin levels increased in the offspring of females given sucrose supplements, specifically in Group B, but not in Groups C and D, regardless of sucrose supplementation. The elevated levels in Group B could be due to the fructose originating from the sucrose [29]. Another study evaluating weight, glucose, insulin, C-peptide, HOMA-IR index, and leptin discovered that children born to women with GDM exhibited higher birth weight, glucose, insulin, leptin concentrations, and a high HOMA index. This aligns with our study’s findings [42]. A different study reported a positive correlation between offspring leptin levels and the presence of GDM compared to children of mothers without GDM [43]. Our study, however, observed low leptin concentrations in GDM-affected groups C and D, which contrasts with the previous findings. The research on adiponectin presents conflicting results. A study measuring adiponectin in umbilical cord blood found lower levels in newborns from mothers with GDM compared to those from mothers without GDM [44]. However, the findings remained inconsistent as adiponectin levels increased in groups B and C. It is crucial to acknowledge that long-term complications from GDM can vary and may even involve diminished gene expressions for leptin and adiponectin into adulthood [45].
The percentages of CD3+, CD4+, and CD8+ T lymphocyte populations were elevated in Group D due to various factors. First, the gestational diabetes status of mothers played a key role; the effect of mothers’ glycemic control with GDM on neonates revealed that poor glycemic control resulted in a diminished percentage of CD3+, CD4+, and CD8+ T lymphocytes. This reduction indicated a higher predisposition to neonatal infections [46]. Additionally, a descriptive study [47] discovered that the offspring of GDM mothers had an increased percentage of LTCD8+ compared to those born to healthy mothers. However, they found no significant differences in the expression and percentage of LTCD4+. This observation contrasts with the findings of our present study. We found modifications in the secretion of Igs, group B experienced a decrease in IgA, with no changes observed in other groups. In stark contrast, IgG levels increased in the groups that consumed sucrose (Groups B and D), while its concentration fell in Group C in instances of GDM without sucrose intake. There is limited research surrounding the impact of sucrose consumption on Igs. A human study detected disparities in IgG levels, with lower concentrations in children whose mothers failed to adequately control GDM when compared to those born to mothers with controlled GDM [46]. No variation was found in IgA production across the groups. Notably, as breast milk contains IgA, its consumption could affect the offspring’s IgA concentrations. Nevertheless, to minimize variability, the offspring in this study were sacrificed within 2 h of birth, thereby potentially restricting any influence on this parameter. The groups that ingested sucrose (B and D), irrespective of whether they had GDM or not, experienced altered cytokine concentrations. IL-1β and IL-6 were notably elevated in Group B, while TNF-α and INF-γ were significantly higher in Group D (Figure 2). Previously published results indicated that TNF-α production in offspring from mothers with GDM was lower than in offspring from mothers without GDM [47]; hence, the elevated cytokine levels can be attributed to sucrose consumption, not maternal GDM. TNF-α levels in expectant patients with and without GDM [48] are associated with increased weight gain in children. However, this study found an inverse relationship in GDM groups consuming sucrose with TNF-α; no significant weight increase was observed. Group C, who had GDM but did not consume sucrose, showed a significant reduction in offspring body weight without considerable TNF-α increase. IL-6, another cytokine, increased with sucrose consumption regardless of whether the mother had GDM or not. Previous studies have shown an increase in IL-6 in the offspring of GDM mothers [49]. However, in this study, IL-6 concentration was significantly elevated in the offspring of non-GDM mothers who consumed high amounts of sucrose during pregnancy (Group B). The alteration of cytokines in GDM mothers, particularly IFN-γ, IL-1α, IL-4, MCP-1, and TNF-α, has been documented, except for IL-1β [50]. Despite this, few studies describe the offspring’s inflammatory state. In this instance, the most significant cytokine secretion alteration was found in offspring whose mothers consumed high amounts of sucrose during pregnancy. The short-term follow-up of GDM mothers’ offspring shows that the pro-inflammatory cytokines’ secretion (IL-1β, IL-6, and TNF-α) remains elevated at 3 months [51], persisting until 20 weeks postpartum, with high levels of IL-1β and IL-6 evident in the liver [52]. If the diet is linked to GDM, raised levels of IL-1β can be seen in the offspring of rats fed on a high-sucrose and fat diet compared to the control group not affected by GDM and which did not consume sucrose [49]. This finding underscores the effect of the maternal diet on the offspring’s organism. In this study, offspring in Group B, born to mothers consuming high sucrose concentrations, demonstrated increased secretion of IL-1β and IL-6. This was in comparison to Group C with GDM but no sucrose intake and Group D with GDM and sucrose intake.
The offspring of mothers with GDM exhibited higher concentrations of carbonylated proteins, indicating increased oxidant activity. Notably, this was specifically in cases where mothers did not consume sucrose (Group C). Conversely, a decrease in MDA was observed in the offspring of mothers without GDM but with sucrose consumption (Group B). This data demonstrates that GDM-induced oxidative stress in offspring is independent of the mother’s diet. This is likely due to the protein damage triggered by insulin resistance and sustained hyperglycemia during GDM. Previous research has reported neuronal death from oxidative stress, along with cognitive damage, in children of mothers with GDM who had high sugar intake before and during pregnancy [31]. Additionally, a study on pregnant rats revealed that offspring exposed to daily fructose or sucrose during gestation had higher MDA concentrations in their plasma and livers than controls and sucrose-supplemented groups [53]. This supports the conclusion that the nature of nutrients consumed during pregnancy can shift the metabolic balance toward redox imbalance. In this study, Group B offspring (non-GDM mothers with sucrose consumption) had lower MDA concentrations compared to the control group (Group A). However, there was a significant difference in carbonylated protein concentrations between the sucrose-supplemented group (Group B) and the group without sucrose (Group A). Oxidative stress is directly linked to GDM [54]. Higher levels of ROS are produced in hyperglycemic conditions, leading to inhibited glucose uptake via insulin and the proliferation of pro-inflammatory cytokines, such as TNF-α, which induce oxidative stress [10]. Hence, this study reveals the indirect impact of GDM on offspring due to the creation of a persistently inflammatory environment characterized by elevated TNF-α levels. Increased TNF-α levels lead to more carbonylated protein production and reduced antioxidant activity. Another issue stemming from cellular-level glucose overload is the excessive production of superoxide dismutase (SOD) in the utero stage. Still, there was no change in this parameter among newborn offspring in any group. Low birth weight or premature children have reportedly less SOD levels due to underdeveloped antioxidant systems [55]. This could clarify why Group D offspring, who were of lower birth weight, had less SOD concentrations compared to the control group (Group A). Moreover, high-sucrose intake coupled with GDM can further diminish antioxidant activity, as exhibited by the significant drop in antioxidants within Group D offspring (Figure 2). Maternal hyperglycemia’s teratogenic effect on offspring is another described impact, resulting from the excess production of reactive oxygen and nitrogen species caused by lipid peroxidation and protein carboxylation, leading to an imbalance in redox systems [56]. The rising catalase levels in the GDM groups of this study could suggest an attempt to preserve the oxidant/antioxidant equilibrium and safeguard the offspring from molecular damage. The declining antioxidant enzymes, such as catalase, reduced glutathione, and SOD in GDM-affected mothers’ offspring further support this hypothesis.
It can be concluded that high consumption of sucrose by pregnant mothers generates changes in their offspring that are aggravated by the presence of GDM. In this study, it was found that body weight decreased in offspring of females with GDM without sucrose supplementation. The groups with the most significant changes were those that consumed sucrose regardless of whether they suffered from GDM; higher glycemia, HOMA-IR index, decreased leptin and adiponectin. It was found that the percentages of CD3+, CD4+ and CD8+ T lymphocytes were increased, as well as INF-γ and TNF-α. Sucrose consumption in mothers without GDM increases all parameters in offspring: CD3+, CD4+ and CD8+, IL-1β, IL-6 and INF-γ, oxidative activity attributed to carbonylated proteins with decreased antioxidants. In contrast, catalase was increased in the DMG groups to counteract the oxidative effect.
ANOVA: analysis of variance
GDM: gestational diabetes mellitus
IgA: immunoglobulin A
IL-6: interleukin 6
INF-γ: interferon factor gamma
MDA: malondialdehyde
ROS: reactive oxygen species
TNF-α: tumor necrosis factor-α
BEMC: Conceptualization, Investigation, Writing—original draft, Writing—review & editing. EAR, CÁRG, and AARA: Investigation, Writing—original draft, Writing—review & editing. RVR, RAJL, and ALGL: Validation, Writing—review & editing, Supervision. All authors read and approved the submitted version.
The authors declare that they have no conflicts of interest.
The protocol was approved by the Faculty’s Research Ethics Committee (CONBIOETICA-15-CEI-002-20210531). The ethical approval number is “009.2022”.
Not applicable.
Not applicable.
The raw data supporting the conclusions in this manuscript will be made available by the authors to any qualified researcher without undue reservation.
Not applicable.
© The Author(s) 2025.
Open Exploration maintains a neutral stance on jurisdictional claims in published institutional affiliations and maps. All opinions expressed in this article are the personal views of the author(s) and do not represent the stance of the editorial team or the publisher.
Copyright: © The Author(s) 2025. This is an Open Access article licensed under a Creative Commons Attribution 4.0 International License (https://creativecommons.org/licenses/by/4.0/), which permits unrestricted use, sharing, adaptation, distribution and reproduction in any medium or format, for any purpose, even commercially, as long as you give appropriate credit to the original author(s) and the source, provide a link to the Creative Commons license, and indicate if changes were made.

View: 2151
Download: 20
Times Cited: 0
Yuko Tanaka ... Tohru Sakai
