Original Article

Affiliation:
1Department of General Surgery, Stanford University, Stanford, CA 94305, USA
2Department of Experimental Medicine and Biotechnology, Postgraduate Institute of Medical Education and Research, Chandigarh 160012, India
Affiliation:
3Department of Neurosurgery, Stanford University, Stanford, CA 94305, USA
Affiliation:
2Department of Experimental Medicine and Biotechnology, Postgraduate Institute of Medical Education and Research, Chandigarh 160012, India
Affiliation:
4Department of Immunopathology, Postgraduate Institute of Medical Education and Research, Chandigarh 160012, India
Affiliation:
4Department of Immunopathology, Postgraduate Institute of Medical Education and Research, Chandigarh 160012, India
Affiliation:
2Department of Experimental Medicine and Biotechnology, Postgraduate Institute of Medical Education and Research, Chandigarh 160012, India
Email: alkabhatia@ymail.com
Explor Immunol. 2025;5:1003194 DOI: https://doi.org/10.37349/ei.2025.1003194
Received: July 12, 2024 Accepted: April 09, 2025 Published: May 15, 2025
Academic Editor: Jean Amiral, Hyphen BioMed, France
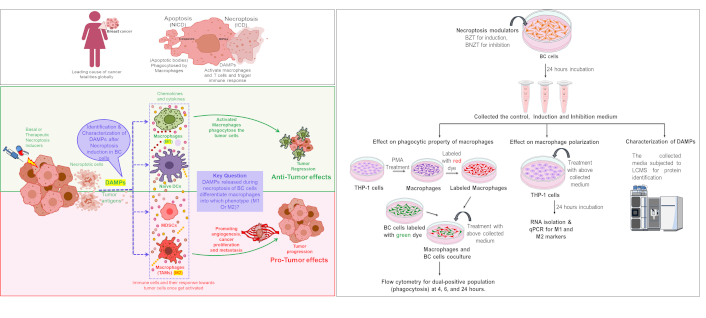
Aim: Mutations in key regulators of apoptosis have necessitated exploring the alternative cell death pathways like necroptosis in breast cancer (BC). Necroptosis is immunogenic due to the release of damage-associated molecular patterns (DAMPs) into extracellular environment, which can trigger pro- or anti-tumor immune responses. Inducing necroptosis in estrogen receptor-positive (ER+) BC cells leads to the release of DAMPs, which can influence macrophages polarisation within the tumor microenvironment. The study aims to identify and characterize the DAMPs released from ER+ BC cells after necroptosis induction and to investigate their effects on macrophage properties.
Methods: Necroptosis was induced by treating T-47D cells with Z-VAD-FMK and TNF-α (24 hours). The culture medium was collected as induction medium (IM). Necrostatin-1 alongside Z-VAD-FMK and TNF-α was added to inhibit necroptosis, the culture medium was collected as inhibition medium (InM) and used as a negative control for necroptosis. IM also referred as conditioned medium (CM), was analyzed using LC-MS/MS for the identification of DAMPs. THP-1 macrophages were incubated with the CM (24 hours), and their differentiation into M1 or M2 subtypes was assessed using qPCR, by evaluating the expression of specific M1 and M2 markers.
Results: A total of 35 unique proteins with potential DAMP activity were identified in the IM. Functional and pathway analyses using PANTHER and DAVID revealed their involvement in immune regulation, metabolism, stress responses, and key pathways such as glycolysis, signaling, and inflammation. These proteins were primarily intracellular or secretory and included cytoskeletal components, chaperones, and binding modulators. Furthermore, IM treatment promoted THP-1 monocyte differentiation into both M1 and M2 macrophage subtypes.
Conclusions: These findings highlight the role of necroptosis in generating DAMPs, which can modulate macrophage differentiation within the BC microenvironment. The identified DAMPs hold potential for further investigation as prognostic or predictive biomarkers and therapeutic targets in future studies.
Breast cancer (BC), a global health problem is the leading cause of cancer fatalities in women. In cancer, there is an imbalance between cell proliferation and death. Thus, therapies effective against cancer may act not only to kill cancer cells but also to decrease their proliferation rate.
Cell death may be categorized into programmed (PCD) and non-programmed (non-PCD) modes. Apoptosis, the most common type of PCD, is traditionally considered non-immunogenic due to the lack of extracellular release of cellular contents. In contrast, non-PCD necrosis triggers an immune response by releasing cellular material into the extracellular matrix (ECM) [1, 2].
Necroptosis is a programmed form of necrosis involving specific molecular pathways, with TNF-α-mediated necroptosis being the most studied [3–5]. Necroptosis is an immunogenic cell death (ICD) owing to early plasma membrane permeabilization and release of different types of damage-associated molecular patterns (DAMPs), which are recognized by pattern recognition receptors (PRRs). Thus, DAMPs have the potential to induce an immune response, which is believed to help in the repair and regeneration of the tissues; however, the same can sometimes lead to diseases of inflammatory, autoimmune, or neurodegenerative nature. In the context of cancers, the sterile inflammation caused by DAMPs can have both anti-tumor and pro-tumor effects. The necroptosis pathway is especially believed to be active when apoptosis is not working. The latter is frequently the case in cancer cells [6–8].
DAMPs may be secreted or released passively from the stressed/dying/dead cells. Different types of DAMPs have been identified both in the context of cancer, and their role is being studied. Common types of DAMPs include high-mobility group box 1 protein (HMGB1), calreticulin (CRT), adenosine triphosphate (ATP), S-100 family proteins, uric acid, etc. HMGB1 is the most common DAMP passively released from the cancer cells following therapy. Various studies on different primary and metastatic cancers have correlated HMGB1 expression with overall survival [9]. DAMPs like S100 A8 correlate with enhanced metastasis of BC to lung [10]. Similarly, DAMP release following epirubicin treatment has been correlated with remission status in BC patients in a previous study [11].
Studies analysing the type of immune response generated by DAMPs have shown involvement of both innate and adaptive immune players and have mainly been directed at T-helper and regulatory cells, dendritic cell maturation, myeloid-derived suppressor cells, macrophages, etc. [12]. This may be important, especially in the tumor microenvironment (TME) where many cell types are present, and the release of DAMPs from dying or dead cells can act as a friend or foe! Till now, it is still being determined whether the type of DAMPs released is specific to a particular tumor type! Also, the types of DAMPs released in response to a particular type of cell death are poorly characterized.
Thus, in this work, we attempted to identify the DAMPs released after induction of necroptosis via TNF-α pathway in estrogen receptor-positive (ER+) BC cell line T-47D (infiltrating ductal carcinoma) by LCMS/MS. As monocytes are one of the most important innate cells modulated by the tumors to escape the immune response, an effort has been made to understand the effect of a DAMP-containing medium on differentiation, polarization, and phagocytic properties of monocytic (THP-1) cells.
T-47D and THP-1 cell lines were procured from the National Centre for Cell Science, Pune, India. Both cell lines were maintained in RPMI-1640 cell culture media (Gibco, Thermo Fisher Scientific), supplemented with 10% Foetal Bovine Serum (Himedia), 100 µg/ml penicillin (Himedia), and 100 µg/ml streptomycin (Himedia) at 37°C under sterile conditions in humidified 5% CO2 incubator. The culture medium was changed on the alternative days, and the cells were trypsinized (0.25% trypsin, 0.02% EDTA) when they reached 80–90% confluency. Cell culture flasks (T25 & T75), plates (6, 12, 24 & 96 well), and 15 ml falcon tubes were purchased from Corning. For drug filtration, 0.22 µM syringe filters were obtained from Merck-Millipore. The necroptosis-modulating drugs, including TNF-α (Biolegend Inc), Z-VAD-FMK (Enzo Life Sciences), and Necrostatin-1 (Sigma Aldrich), were procured. Z-VAD-FMK and Necrostatin-1 were dissolved in DMSO. Primary stocks of all the above-mentioned drugs were prepared in the respective solvents, and the working dilutions were prepared in the culture medium at the time of the experiment. Control cells were treated with an equal volume of solvent alone for the respective drugs.
A combination of drugs was used to modulate necroptosis in T-47D cells. The combination used for induction was 10 ng BV-6 (cIAP inhibitor) + 20 µM Z-VAD-FMK (pancaspase inhibitor) + 10 ng TNF-α, termed BZT, while for inhibition, the combination 10 ng BV-6 + 20 µM Z-VAD-FMK + 10 ng TNF-α + 30 µM of Necrostatin-1 was used and named BNZT. The cells were treated with BV-6, Z-VAD-FMK, and Necrostatin-1 for 24 hours, followed by TNF-α for 12 hours (Table 1) [13].
Drug dosing schedule for induction and inhibition of necroptosis
| Drugs | Induction | Inhibition | Target | ||
|---|---|---|---|---|---|
| Dose | Time | Dose | Time | ||
| Z-VAD-fmk | 20 µM | 24 Hrs | 20 µM | 24 Hrs | Pan caspase inhibitor |
| Necrostatin-1 | - | - | 30 µM | 24 Hrs | RIPK-1 inhibitor |
| BV-6 | 10 ng | 24 Hrs | 10 ng | 24 Hrs | Pan cIAPs and xIAPs inhibitor |
| TNF-α | 10 ng | 12 Hrs | 10 ng | 12 Hrs | Necroptosis inducer, TNFR |
RIPK-1: receptor interacting protein kinase; cIAPs: cellular inhibitor of apoptosis proteins; xIAPs: X-linked inhibitor of apoptosis proteins; TNFR: tumor necrosis factor receptor
After necroptosis modulation with the above drug combinations, the cell death was determined by flow cytometry. For this, T-47D cells were first trypsinized and transferred to the FACS tubes, followed by centrifugation for 3 minutes at 1,200 rpm. The supernatant was discarded, and the cells were incubated with Annexin-V antibody (BD Biosciences) along with the binding buffer for 30 minutes. After incubation, the final volume of each tube was adjusted to 300 µl by adding 200 µl of binding buffer and propidium iodide. The tubes were acquired immediately in the flow cytometer (BD Aria). The cells in Q1 quadrants were identified as necroptotic [14].
The conditioned media, namely the induction medium (IM) and inhibition medium (InM), were collected from the BC cell line after induction and inhibition of necroptosis respectively. The collected medium was then centrifuged at 1,500 rpm for 10 minutes to remove any suspended cells or debris. Following this, cell culture supernatant was concentrated by using 3 kDa molecular weight concentrator (MWCO) centrifugal filter units (Amicon), which separated proteins into two sets based on size, i.e., < 3 kDa and ≥ 3 kDa. The proteins were then estimated by bicinchoninic acid assay (Thermofisher) for further use.
After obtaining the proteins having molecular weight ≥ 3 kDa, 20 µl (containing 20–25 µg) of protein sample was taken and added to boiling 6M GnHcl/0.1M Tris, pH 8.5, and incubated for 5 minutes. The mixture was then thoroughly mixed and vortexed before cooling to room temperature (RT). Subsequently, 2 µl of dithiothreitol (10 mM) from a stock solution (100 mM) was added to each sample and incubated for 45 minutes in the dark. Following this, 50 mM iodoacetamide (Sigma) was added to the samples, which were then incubated in the dark for an additional 45 minutes. The samples were diluted 10-fold by adding 20 µl to 180 µl of LC-MS grade water, with the pH adjusted and maintained between 8–8.5 using Tris HCl. Finally, 2 µl of trypsin (Promega, 1 µg/µl) was added to each sample, followed by incubation at 37°C for 16 hours. The samples were analysed by LC-MS/MS for the characterization of DAMPs.
The LC-MS/MS analysis was conducted on a Thermo Fisher Orbitrap Fusion machine (Thermo Fisher Scientific), with a runtime of 180 minutes. The peptides were subsequently desalted on C18 cartridges (Thermo Fisher SPE Cartridges C18), concentrated by vacuum centrifugation, and reconstituted in 40 μl of 0.1% (vol/vol) formic acid. The peptides were separated on a C18 reversed-phase analytical column (Thermo Scientific Easy Column) over a 180-minute gradient from buffer A (0.1% formic acid and 2% acetonitrile, vol/vol) and B linear gradient solvent (0.1% formic acid and 84% acetonitrile).
The raw data obtained from all the samples were analysed using Proteome Discoverer Software version 2.0 and searched against the UniProt database. The search parameters were set as follows: enzyme trypsin, maximum mass cleavage-2, precursor mass tolerance-20 ppm, fixed modification-carbamidomethylation of cysteines, precursor mass window-6 ppm, variable modifications-protein N-terminal acetylation and methionine oxidation. The proteins were screened based on the following criteria: highest protein scores of > 70, false discovery rate (FDR) of < 0.5% with a significance score of < 20, and identification of at least 2 to 10 unique peptides. Additionally, MW and isoelectric point (pI) of the identified proteins were determined using the SEQUEST database.
The protein lists from the control and induction groups were analyzed using Venny 2.0 software to identify common and unique proteins. The unique proteins were subjected to functional enrichment analysis using ShinyGo 0.81 and the Protein Analysis Through Evolutionary Relationships (PANTHER) database. Groups of proteins with the highest hits were selected for further analysis. The functional enrichment of proteins was performed using the total proteins identified from the induction vs control group. These proteins were identified to be involved in various crucial biological and molecular functions. The significantly enriched Gene Ontology (GO) biological process and involvement of the identified proteins in various molecular functions were determined. Furthermore, PANTHER evaluations unveiled the involvement of identified proteins in several pathways that play an important role in tumor growth and progression. The unique proteins identified in the induction group were analysed for their roles in cellular, biological, and molecular processes using the Database for Annotation, Visualization, and Integrated Discovery (DAVID). A detailed step-by-step workflow for utilizing DAVID to analyse the induction proteins is provided in the Figure S1.
THP-1 cells were cultured in RPMI-1640 medium supplemented with 10% FBS. They were stimulated to differentiate into macrophages by incubation with or without 150 nM phorbol 12-myristate 13-acetate (PMA, Sigma) for 48 hours, followed by 36 hours of incubation in a complete medium. The differentiation of monocytes to macrophages was assessed by morphological changes and flow cytometry. To investigate the effect of DAMPs on macrophage properties, the cells were treated with 150 µl of the collected IM and InM for 24 hours.
To study the expression of macrophage differentiation markers at the transcriptomic level, the THP-1 cell line was harvested after treatment with IM and InM obtained from the T-47D cells. RNA isolation was performed using the TRIzol method (Thermo Fisher). 0.5 ml of TRIzol reagent was added to the cells and incubated for 5–10 minutes at RT in the dark. Subsequently, 0.2 ml chloroform was added, and the solution was vigorously mixed for 15–30 seconds and left still for 2–3 minutes. The mixture was then centrifuged for 15 minutes at 12,000 g at 4°C, resulting in the formation of three different layers. The topmost layer, containing RNA, was carefully isolated and transferred to a new microcentrifuge tube. The RNA present in the solution was precipitated by adding 0.5 ml of chilled isopropanol, followed by centrifugation at 12,000 g for 10 minutes at 4°C. The supernatant was discarded, and the RNA pellet was washed in 1 ml of 75% ethanol, followed by centrifugation at 7,500 g for 5 minutes at 4°C. The supernatant was discarded, and the RNA pellet was air-dried in the laminar airflow chamber for 20 minutes. The RNA pellet was then re-dissolved in nuclease-free water and stored at –20°C until further use. The concentration of RNA was determined using a multimode spectrophotometer (Tecan Infinite® 200 PRO), and its purity was checked using the ratio of absorbance at 260 and 280 nm.
cDNA was prepared by using a cDNA synthesis kit (Thermo Fisher) according to manufactures protocol. 2 µg of RNA (A260/A280 ratio ~2.0), 5X reaction buffer (4 µl), ribonuclease inhibitor (1 µl), 10 mM dNTPs (2 µl), reverse transcriptase (1 µl) were added sequentially, mixed, and briefly centrifuged. The total reaction volume was adjusted to 20 µl and incubated at 42°C for 60 minutes to facilitate cDNA synthesis. The reaction was stopped by inactivation of reverse transcriptase by incubating at 70°C for 5 minutes. Finally, the cDNA products were stored at –80°C until further use.
The qPCR analysis was conducted in light cycler 96 system (LC96), using cDNA synthesized earlier and specific primers purchased from IDT. The relative expression level of a gene was calculated by comparing the Ct values of gene of the interest with the housekeeping gene, i.e., 18 s. To prepare the qPCR master mix, 5 µl of SYBR green and 1 µl of cDNA were combined. Forward and reverse primers were added as per the results of standardization sets of primers (Table 2). The total volume was adjusted to 10 µl with nuclease-free water, followed by gentle vortexing to ensure thorough mixing. The reaction mixture was dispensed into the 96-well plate in triplicate. The plate was then loaded into the LC96 instrument, and the program was run at a specific temperature cycle for primer annealing and extension. The result was obtained by calculating δCt values, providing insights into the relative expression levels of the target genes.
Primers used in the study
| Macrophage markers | Primers | Forward sequence | Reverse sequence |
|---|---|---|---|
| M2 markers | ARG1 | 5’-GGAAGTGAACCCATCCCTGG-3’ | 5’-CGAGCAAGTCCGAAACAAGC-3’ |
| PPAR-γ | 5’-CTGGCAAAACATTTGTATGACTC-3’ | 5’-ACGAATGGTGATTTGTCTGTTGTC-3’ | |
| IL1β | 5’-GCTCGCCAGTGAAATGATGG-3’ | 5’-GGTGGTCGGAGATTCGTAGC-3’ | |
| M1 markers | IL-6 | 5’-GACCCAACCACAAATGCCAG-3’ | 5’-GTGCCCATGCTACATTTGCC-3’ |
| IL12 | 5’-TGACAACGGTTTGGAGGGAC-3’ | 5’-TCCTCCCTTGAAGAACCGGA-3’ | |
| CD68 | 5’-ATGAGAGGCAGCAAGATGGAC-3’ | 5’-GCAACTCGAGCATCATTCTTTCACC-3’ | |
| House keeping gene | 18S | 5’-ATCCTGCCAGTAGCATATGC-3’ | 5’-ACCGGGTTGGTTTTGATCTG-3’ |
T-47D cells were cultured in RPMI-1640 medium supplemented with 10% FBS. For the co-culture experiments, THP-1 monocytes were seeded in 24 well plate and were differentiated with and without PMA. Following differentiation, the macrophages were labelled with red dye (Thermo Fisher vibrant DiO) while T-47D cells were labelled with green dye (Thermo Fisher vibrant Dil). Subsequently, T-47D cells and macrophages were co-cultured in a ratio of 1:2 (1 part T-47D and 2 parts macrophages) in IM for 4, 6, and 24 hours, respectively.
Following the designated incubation periods, the cells were trypsinized and transferred to the FACS tubes along with the media. The tubes were centrifuged at 1,200 rpm for 5 minutes to enable the cells to settle down. The medium was discarded, and the cells were resuspended in the phosphate buffer saline for subsequent analysis. Flow cytometry analysis revealed distinct cell populations: Q1 quadrant representing macrophages labelled with red dye and Q4 quadrant representing T-47D cells labelled with green dye. The Q2 quadrant (area of interest) represented the population of cells undergoing phagocytosis, characterized by dual labelling.
For statistical analysis, means and standard deviations were calculated. One way ANOVA was used for groups with more than two datasets, while Student’s t-test was applied for pairwise comparisons. The p-values < 0.05 were considered significant: * p < 0.05, ** p < 0.01, *** p < 0.001, and **** p < 0.0001. These analyses were performed using GraphPad Prism software.
Detailed research design and experimental algorithm for necroptosis induction, macrophage differentiation, and phagocytosis assay are provided in Figure S2.
The transcriptional expression of the gold standard necroptosis marker MLKL, was found to increase significantly in the induction group (BZT = 236 folds) compared to the untreated control. Further, a significant decrease in the expression of the same was observed in the inhibition group (BNZT = 236.548 folds) (one way ANOVA; p-values < 0.05). At the phenotypic level, no significant increase in necroptosis was observed in the BZT group, (control = 8.1 ± 0.56, BZT = 11.26 ± 1.41). Similarly, although a decrease in the Q1 population was observed after Necrostatin-1 treatment in the BNZT group (BNZT 10.93 ± 2.38), it did not reach statistical significance (Figure 1A–C). The results may indicate impending necroptosis of BC cells in our induction group which was inhibited by Necrostatin-1.
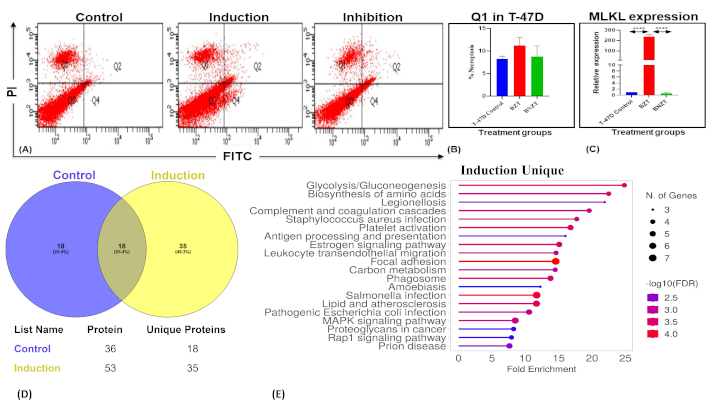
Assessment of necroptosis and associated molecular changes in T-47D cells. (A) Flow cytometry analysis using the Annexin-V/PI assay to assess necroptosis in T-47D cells. Experimental groups include dual-control (untreated), induction (BZT), and inhibition (BNZT). The Q1 quadrant represents the PI-positive population, indicative of necroptotic cells. PI: propidium iodide; FITC: fluorescein isothiocyanate. (B) Bar charts depict the percentage necroptotic population (Q1) in control, induction, and inhibition groups with statistical significance. (C) MLKL expression levels after necroptosis modulation were analyzed by qPCR, revealing a significant increase in the induction group (BZT, p < 0.0001) compared to the untreated control, and a significant decrease in the inhibition group (BNZT, p < 0.0001) compared to the induction group (One way ANOVA). (D) Venn diagram illustrating proteins identified from comparative proteomic analysis of control (untreated), and treated (BZT) groups, respectively. (E) ShinyGO pathway analysis of unique proteins identified in the induction group, highlighting enriched pathways. FDR: false discovery rate
The supernatant from T-47D cells after necroptosis modulation was collected and then concentrated by using protein concentrators. LCMS analysis identified 122 proteins in the control group and 198 in the induction group. Based on the filtering criteria mentioned in Materials and methods, 36 and 53 proteins in the control and IM, respectively, were subjected to comparative proteomic analysis. Among these, 18 proteins were common in both groups, while 35 and 18 proteins were unique to the induction and control groups, respectively (Figure 1D, Tables 3 and 4).
List of proteins common and unique to the control and induction groups
| S.No | Common proteins | Unique in control | Unique in induction |
|---|---|---|---|
| 1 | ALB | AC4APIENSL | KRT9 |
| 2 | ITIH2 | AP4SAPIENSL | KRT1 |
| 3 | THBS1 | PP4OSL | ACTB |
| 4 | TLN1 | SERPINC1 | ACTG1 |
| 5 | ITIH3 | HP2HOMOL | SERPINF1 |
| 6 | GSN | RP2HOMOL | C3 |
| 7 | VCL | CP2OSL | HBA1 |
| 8 | AFP | MSN | KRT2 |
| 9 | TTR | H2AFJ | KRT10 |
| 10 | A2M | HIST1H2AD | OLFML3 |
| 11 | FN1 | HIST1H2AG | HSPB1 |
| 12 | VTN | HIST2H2AC | C4B |
| 13 | ITIH1 | HIST2H2AA3 | TUBB |
| 14 | LUM | HIST1H2AB | RBP4 |
| 15 | TAGLN2 | HIST3H2A | TUBB1 |
| 16 | POSTN | HIST1H2AC | COL1A2 |
| 17 | LTF | HIST1H2AH | AHSG |
| 18 | C4A | HIST1H2AJ | PPIA |
| 19 | PKM | ||
| 20 | APOE | ||
| 21 | COL6A1 | ||
| 22 | COTL1 | ||
| 23 | ENO1 | ||
| 24 | C9 | ||
| 25 | GAPDH | ||
| 26 | RAP1B | ||
| 27 | RAP1A | ||
| 28 | RP1BL | ||
| 29 | CLU | ||
| 30 | PGK1 | ||
| 31 | APOB | ||
| 32 | HSPA1B | ||
| 33 | HSPA1L | ||
| 34 | HSP90AA1 | ||
| 35 | FLNA |
Unique proteins from the induction group reported as DAMPs and their interacting receptors on immune cells
| S.No | Unique in induction | Interaction with immune receptor | Role as a DAMP |
|---|---|---|---|
| 1 | KRT9 | PRRs | Yes |
| 2 | KRT1 | PRRs | Yes |
| 3 | ACTB | DNGR-1 | Yes |
| 4 | ACTG1 | DNGR-1 | Yes |
| 5 | SERPINF1 | Under investigation | Yes |
| 6 | C3 | C3b (CR1) | Yes |
| 7 | HBA1 | TLR4 | Yes |
| 8 | KRT2 | PRR, TLR, RAGE | Yes |
| 9 | KRT10 | TLR | Yes |
| 10 | OLFML3 | Iba1 | Yes |
| 11 | HSPB1 | PRR | Yes |
| 12 | C4B | PRR | Yes |
| 13 | TUBB | PRR | Yes |
| 14 | RBP4 | TLR4 | Yes |
| 15 | TUBB1 | PRR | Yes |
| 16 | COL1A2 | PRR, TLR | Yes |
| 17 | AHSG | RAGE | Yes |
| 18 | PPIA | CD147 | Yes |
| 19 | PKM | No specific receptor | Yes |
| 20 | APOE | VLDLR, ApoER2 | Yes |
| 21 | COL6A1 | α1β1 and α2β1 | Yes |
| 22 | COTL1 | F-actin | No data available |
| 23 | ENO1 | PRR | Yes |
| 24 | C9 | No specific receptor | Yes |
| 25 | GAPDH | TLR2, 4, RAGE | Yes |
| 26 | RAP1B | PRR | Yes |
| 27 | RAP1A | RAGE | Yes |
| 28 | RP1BL | No specific receptor listed | Yes |
| 29 | CLU | RAGE | Yes |
| 30 | PGK1 | TLR2, 4 | Yes |
| 31 | APOB | LDLR, PRR, TLR | Yes |
| 32 | HSPA1B | TLR2, 4, CD14, CD91 | Yes |
| 33 | HSPA1L | TLR2, 4 | Yes |
| 34 | HSP90AA1 | TLR2, 4 | Yes |
| 35 | FLNA | TLR2, 4 | Yes |
PRR: pattern recognition receptors; TLR: toll like receptors; DNGR-1: dendritic cell-specific intercellular adhesion molecule-grabbing non-integrin; CR: complement receptor; RAGE: receptor for advanced glycation end products; Iba-1: ionized calcium-binding adapter molecule 1: CD147: cluster of differentiation 147; VLDLR: very low-density lipoprotein receptor; ApoER2: apolipoprotein E receptor 2; α1β1 and α2β1: alpha-1 beta-1 integrin; LDLR: low-density lipoproteins receptors
Pathway enrichment analysis was performed using multiple bioinformatics tools, including ShinyGO 0.81, PANTHER, and DAVID, to gain insights into the roles of the unique proteins in IM in various biological processes and molecular functions. These analyses revealed key pathways and functional categories associated with the proteins, highlighting their potential involvement in critical cellular processes and signalling mechanisms. Analysing the unique proteins in the induction group using ShinyGO revealed significant enrichment in pathways such as glycolysis/gluconeogenesis, biosynthesis of amino acids, and the complement and coagulation cascades. Additional pathways identified include leukocyte transendothelial migration, carbon metabolism, phagosome formation, and the MAPK signalling pathway, indicating a broad involvement of these proteins in metabolic processes, immune regulation, and signalling events (Figure 1E).
The unique proteins in the induction group were further subjected to PANTHER for their molecular and functional class analysis. The identified proteins were found to be involved in various crucial molecular functions such as binding (33.3%), catalytic activity (18.8%), structural molecular activity (14.6%), molecular function regulation (6.3%), and transporter activity (2%) (Figures 2A and 2B). Additionally, the identified proteins were further found to be involved in significant biological processes such as response to stimuli (11.3%), immune system processes (1.4%), cellular processes (31%), metabolic processes (12.7%), biological regulation (15.5%), and localization (2.8%), etc. (Figure 2C and 2D).
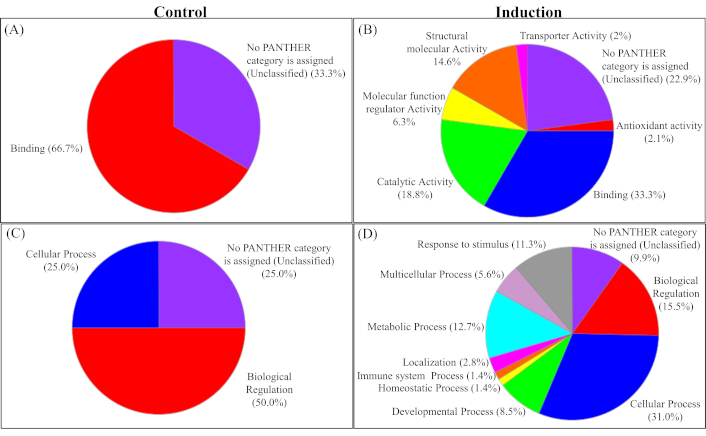
PANTHER analysis of unique proteins identified in the control and induction groups. (A and B) Molecular functions of proteins are unique in the control and induction groups, respectively. (C and D) Biological processes associated with proteins unique in the control and induction groups, respectively. It highlights the proteins involved in various important pathways
Notably, more than one-third (36%) of the identified proteins were intracellular, depicting release due to increased plasma membrane permeability or cell bursting. The proteins belong to different classes, such as transfer/carrier proteins (11.4%), cytoskeletal proteins (20%), chaperon (14.3%), protein binding activity modulators (17.1%), and metabolite interconversion enzymes (11.4%) (Figure 3A).
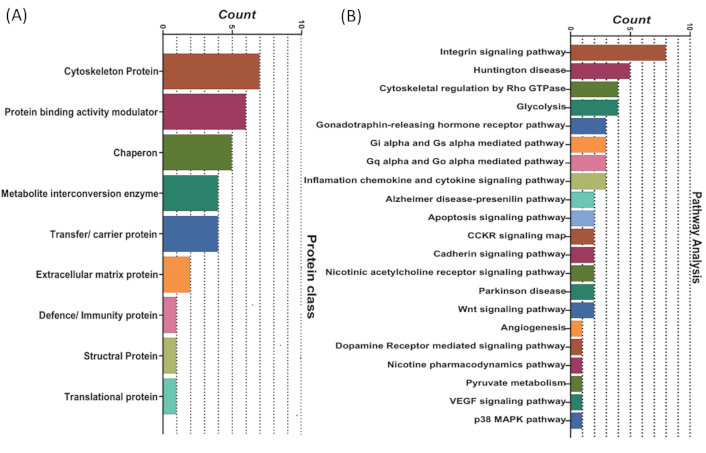
PANTHER analysis of unique proteins identified in the control and induction groups. (A) Classification of unique proteins from the induction group into different protein classes. (B) Functional enrichment analysis of proteins identified through comparative proteomic analysis of the induction versus control groups, highlighting their involvement in various key biological pathways
Pathway analysis using PANTHER revealed that the proteins unique to the induction group were found to be involved in several significant pathways associated with tumor growth and progression. The majority of the screened proteins from our study were involved in the integrin signalling pathway (11.4%), cytoskeletal regulation by Rho GTPase (5.7%), glycolysis (5.7%), heterotrimeric G-protein signalling pathway-Gi alpha and Gs alpha mediated pathway (4.3%), inflammation mediated by chemokine and cytokine signalling pathway (4.3%), apoptosis signalling pathway (2.9%), etc. (Figure 3B).
The unique proteins were further analysed using DAVID software for functional annotation, and the results were consistent with those obtained from previous analyses. We found that these proteins are involved in key biological processes, including innate immunity, host-virus interactions, immunity, the complement pathway, glycolysis, stress responses, and the complement alternative pathway. The majority of these proteins are localised in the cytoplasm, secretory pathways, and cytoskeleton. Detailed information about the identified proteins is provided in Figure 4, and the details of the proteins with name, fold enrichment, and p-value are provided in Tables 5 and 6.
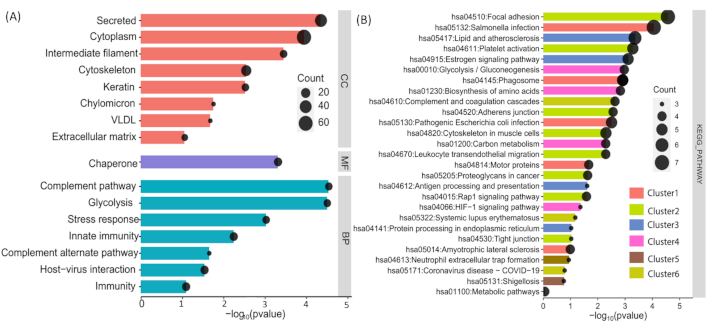
Functional enrichment analysis of identified proteins using DAVID. (A) Cellular component, biological process, and molecular function classifications of the unique proteins identified. (B) Pathway enrichment analysis of the unique proteins, highlighting several significantly enriched annotation clusters with high enrichment scores, indicative of their association with diverse biological processes and pathways
Functional enrichment analysis of unique proteins in the induction group: cellular components, biological processes and molecular functions analysed by DAVID
| Category | Term | % | Count | Fold enrichment | p-value |
|---|---|---|---|---|---|
| Cellular component | Cytoplasm | 62.85714 | 22 | 62.31292517 | 1.15E-04 |
| Cellular component | Secreted | 40 | 14 | 60.58201058 | 4.47E-05 |
| Cellular component | Cytoskeleton | 25.71429 | 9 | 3.491631915 | 0.002869473 |
| Molecular function | Chaperone | 14.28571 | 5 | 2.060522538 | 4.87E-04 |
| Biological process | Innate immunity | 14.28571 | 5 | 27.88189588 | 0.005745408 |
| Biological process | Host-virus interaction | 14.28571 | 5 | 12.43619247 | 0.029247886 |
| Biological process | Immunity | 14.28571 | 5 | 19.30046355 | 0.081609915 |
| Biological process | Complement pathway | 11.42857 | 4 | 3.441120061 | 2.88E-05 |
| Biological process | Glycolysis | 11.42857 | 4 | 13.34225693 | 3.14E-05 |
| Cellular component | Intermediate filament | 11.42857 | 4 | 6.384521022 | 3.58E-04 |
| Biological process | Stress response | 11.42857 | 4 | 108.7393939 | 9.44E-04 |
| Cellular component | Keratin | 11.42857 | 4 | 90.61616162 | 0.00300903 |
| Cellular component | Extracellular matrix | 8.571429 | 3 | 83.88278388 | 0.088131196 |
| Cellular component | Chylomicron | 5.714286 | 2 | 3.95100069 | 0.017697186 |
| Cellular component | VLDL | 5.714286 | 2 | 2.830935074 | 0.021200032 |
| Biological process | Complement alternate pathway | 5.714286 | 2 | 5.846203975 | 0.02248262 |
Functional annotational cluster of the induction group analysed using DAVID
| Category | Term | Count | Fold enrichment | % | p-value |
|---|---|---|---|---|---|
| Annotation cluster 1 | Enrichment score: 2.4257169569172325 | ||||
| KEGG pathway | Salmonella infection | 7 | 8.804780876 | 20 | 8.85E-05 |
| KEGG pathway | Phagosome | 5 | 10.05459509 | 14.28571 | 0.001222 |
| KEGG pathway | Pathogenic Escherichia coli infection | 5 | 7.776213934 | 14.28571 | 0.003131 |
| KEGG pathway | Motor proteins | 4 | 6.41044235 | 11.42857 | 0.021516 |
| KEGG pathway | Amyotrophic lateral sclerosis | 4 | 3.403927609 | 11.42857 | 0.102141 |
| Annotation cluster 2 | Enrichment score: 2.404989126773895 | ||||
| KEGG pathway | Focal adhesion | 7 | 10.88669951 | 20 | 2.69E-05 |
| KEGG pathway | Platelet activation | 5 | 12.62857143 | 14.28571 | 5.20E-04 |
| KEGG pathway | Cytoskeleton in muscle cells | 5 | 6.804187192 | 14.28571 | 0.005046 |
| KEGG pathway | Adherens junction | 4 | 13.57910906 | 11.42857 | 0.002746 |
| KEGG pathway | Leukocyte transendothelial migration | 4 | 10.88669951 | 11.42857 | 0.005119 |
| KEGG pathway | Proteoglycans in cancer | 4 | 6.19047619 | 11.42857 | 0.023569 |
| KEGG pathway | Rap1 signalling pathway | 4 | 5.956873315 | 11.42857 | 0.026044 |
| KEGG pathway | Tight junction | 3 | 5.571428571 | 8.571429 | 0.094388 |
| Annotation cluster 3 | Enrichment score: 2.277392789782016 | ||||
| KEGG pathway | Lipid and atherosclerosis | 6 | 8.76984127 | 17.14286 | 4.33E-04 |
| KEGG pathway | Estrogen signalling pathway | 5 | 11.35662898 | 14.28571 | 7.76E-04 |
| KEGG pathway | Antigen processing and presentation | 3 | 11.83928571 | 8.571429 | 0.024525 |
| KEGG pathway | Protein processing in endoplasmic reticulum | 3 | 5.571428571 | 8.571429 | 0.094388 |
| Annotation cluster 4 | Enrichment score: 1.9020966694702295 | ||||
| KEGG pathway | Glycolysis/Gluconeogenesis | 4 | 18.84861407 | 11.42857 | 0.001069 |
| KEGG pathway | Biosynthesis of amino acids | 4 | 16.83809524 | 11.42857 | 0.001482 |
| KEGG pathway | Carbon metabolism | 4 | 10.88669951 | 11.42857 | 0.005119 |
| KEGG pathway | Metabolic Pathways | 4 | 0.809005216 | 11.42857 | 0.879547 |
| KEGG pathway | HIF-1 signalling pathway | 3 | 8.68938401 | 8.571429 | 0.043283 |
| Annotation cluster 5 | Enrichment score: 1.5349186533829084 | ||||
| KEGG pathway | Phagosome | 5 | 10.05459509 | 14.28571 | 0.001222 |
| KEGG pathway | Neutrophil extracellular trap formation | 3 | 4.933035714 | 8.571429 | 0.115723 |
| KEGG pathway | Shigellosis | 3 | 3.803786575 | 8.571429 | 0.175688 |
| Annotation cluster 6 | Enrichment score: 1.530461617078536 | ||||
| KEGG pathway | Complement and coagulation cascades | 4 | 14.35064935 | 11.42857 | 0.002346 |
| KEGG pathway | Systemic lupus erythematosus | 3 | 6.81397739 | 8.571429 | 0.06672 |
| KEGG pathway | Coronavirus disease-COVID-19 | 3 | 3.979591837 | 8.571429 | 0.163704 |
Upon treatment with 10 ng/ml PMA, the THP-1 suspension cells began adhering to the substratum by the second day. The cells were kept for 5 days to allow their differentiation into macrophages. On examination, under the inverted microscope, the differentiated macrophages displayed a flattened morphology and enhanced adherence to the substratum compared to THP-1 monocytes. Similarly, flow cytometry analysis, which is based on the increase in side scatter upon differentiation, showed the highest number of cells with high side scatter on day 5 (Figure 5).
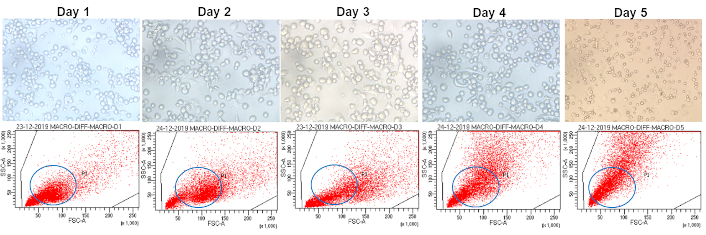
Morphological and flow cytometric analysis of PMA-differentiated THP-1 cells. THP-1 cells differentiated into macrophages with PMA displaying characteristic morphology under a light microscope and display distinctive side scatter properties on flow cytometry. Notably, the highest number of cells with high side scatter is observed on day 5. PMA: phorbol 12-myristate 13-acetate is commonly used to differentiate THP-1 cells into macrophage-like cells, inducing the expression of surface markers and macrophage-like morphology and function
qPCR analysis, using M1 and M2 markers, demonstrated a significant increase (p-value < 0.05) in the expression of both M1 (IL-1β, IL-6, IL-12, and CD68) and M2 (ARG1 and PPAR-γ) related genes in THP-1 cells exposed to conditioned medium from T-47D cells, compared to THP-1 cells cultured in standard complete medium (Figure 6). THP-1 cells exposed to the IM also showed significantly higher relative expression of M1 (CD68, IL-12, and IL-1) and M2 (PPAR-γ) related genes than the conditioned medium-treated group. The expression of the above genes was found to decrease again in the inhibition as compared to the induction group (p-value < 0.05) (Figure 7).
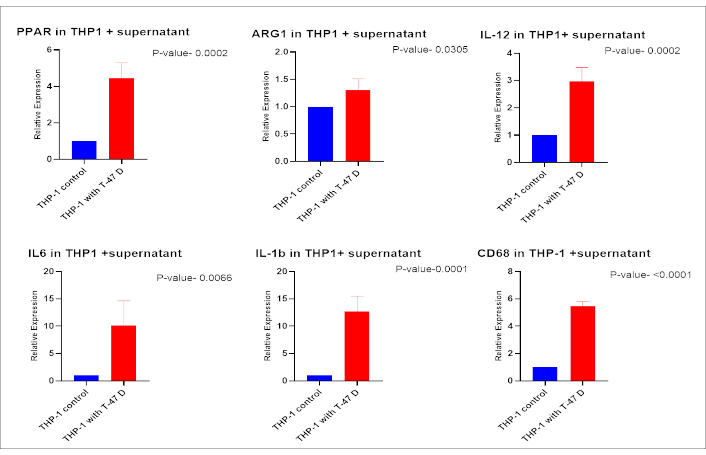
Transcriptional analysis of macrophage polarization markers in THP-1 cells treated with conditioned medium from T-47D cells. THP-1 cells were incubated with conditioned medium from untreated T-47D cells, and the transcriptional expression of differentiation markers was assessed. Markers for M2 polarization (PPAR-γ, ARG1) and M1 polarization (CD68, IL-1β, IL-12, and IL-6) were analysed. THP-1 cells cultured in complete medium served as the control group
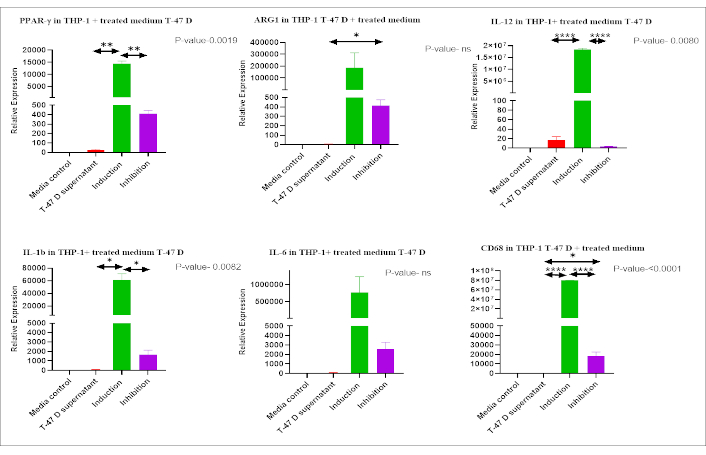
Expression of M1 and M2 polarization markers in THP-1 cells treated with IM. Expression of M1 (CD68, IL-12, IL-1, and IL-6) and M2 (PPAR-γ, ARG1) markers in THP-1 cells treated with IM using qPCR. Comparisons among groups revealed significantly higher expression of most of the markers in the Induction group compared to other groups. mRNA expression levels were normalized to 18s in each group and calculated as relative expression against the control group. * p < 0.05, ** p < 0.01, *** p < 0.001, and **** p < 0.0001, ns: non significant
We observed an increase in both the M1 and M2 macrophage populations after incubation with the IM; we next assessed the phagocytic activity of macrophages in the presence of dying BC cells. Co-culture experiments were conducted by stimulating macrophages with IM in the presence of BC cells and incubating them for varying time intervals (4, 6, and 24 hours). The two cell types were labeled with distinct fluorescent dyes to differentiate between BC cells and macrophages, as described in detail in the methodology section. Phagocytosis was identified by the presence of both fluorescent signals within a single cell (Q2 quadrant). Flow cytometry analysis revealed differences, albeit non-significant, in the percentage of cells showing phagocytosis amongst different groups at the early time point (4 hours). However, no change was observed in the 6- and 24-hour periods (Figure 8).
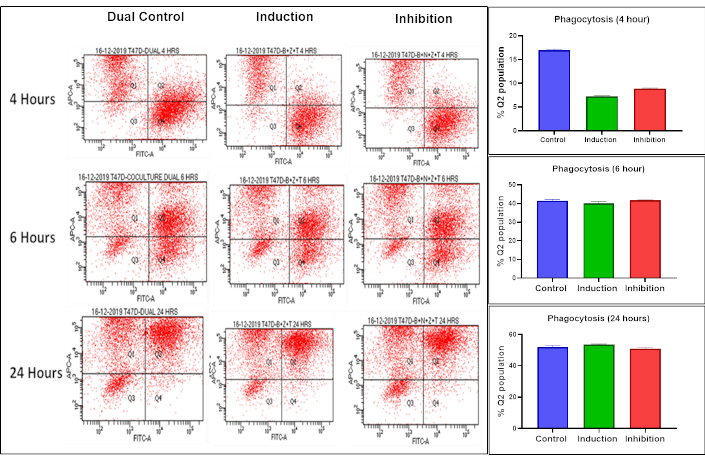
Flow cytometry analysis of phagocytosis at different time intervals. Phagocytosis was assessed at 4, 6, and 24-hours using flow cytometry with two dyes: red for labeling macrophages (Q1 quadrant) and green for labeling BC cells (Q4 quadrant). The dual-positive cell population (Q2 quadrant) represents phagocytosis, while Q3 quadrant represents unstained cells not labelled with either red or green. Although differences albeit non-significant, in percentage of cells showing phagocytosis amongst different groups were observed at 4 hours, no change was observed in the subsequent time periods
Mutations in the key regulators of apoptosis is a significant survival mechanism of BC cells after chemotherapy. These alterations display a major obstacle in the efficacy of cancer treatment. Thus, interfering with the apoptotic pathways by developing small-molecule inhibitors that mimic the endogenous IAP protein SMAC presents a promising strategy to counteract resistance by inducing necroptosis, followed by the release of cellular contents called DAMPs into the extracellular environment [15, 16].
In this study, we investigated the effect of induction of necroptosis via the TNF-α pathway on T-47D BC cells. In this work, BC cells treated with a BZT combination exhibited signs of stress or early necroptosis, evidenced by increased expression of MLKL, which is a key executioner of necroptosis, without any significant increase in phenotypic necroptosis. However, when we inhibited RIPK-1 with Necrostatin-1, we observed a significant decrease in necroptosis. Previous studies have shown that necroptosis can be induced in BC cells using compounds like shikonin and quercetin. However, other studies have shown that hypermethylation of RIPKs, low expression of necroptosis key molecules, and mutations in the kinase as well as functional domains of the key necroptosis molecules in the BC cells may render the necroptosis machinery non-functional [17–20].
Since necroptosis is an ICD, dead/dying or stressed cells either actively or passively release DAMPs into the culture medium. We used this fact and conducted a proteomic analysis of the culture medium derived from BC cells treated with necroptosis-inducing drugs. LCMS analysis identified various proteins with DAMP-like properties, including members of the keratins, glycolysis pathway components, Ras-related proteins, apolipoproteins, and complement system proteins. Pathway enrichment analysis on these unique proteins of the induction group revealed several significantly enriched annotation clusters with high enrichment scores, suggesting associations with diverse biological processes and pathways.
The proteins in the induction group were predominantly secretory, as the cells did not exhibit significant necroptosis but demonstrated increased transcription of the necroptosis key molecule, MLKL. Studies have reported that stressed cells secrete DAMPs, which can stimulate immune responses [21–23]. The endoplasmic reticulum (ER), an organelle involved in protein synthesis, is also known to secrete DAMPs under stress, further contributing to immune cell activation. The released DAMPs are found to be involved in the biological processes like complement pathway. To understand the role of released DAMPs in the activation of immune system and tumor regression we need to use the biological system like mouse models [24].
Another prominent cluster observed in the induction group involved cellular adhesion and signaling pathway proteins. In BC, focal adhesion molecules, particularly focal adhesion kinase (FAK), are reported to be upregulated [25]. FAK plays a role in regulating necroptosis by influencing the cell’s mechanical state and signaling pathways, potentially impacting the decision between survival and PCD, like necroptosis, particularly by modulating the interaction with the ECM and the cytoskeleton, which is crucial for cell shape changes during necroptosis [26]. Additionally, keratins identified in the IM may act as alarmins, as suggested by their roles in autoimmunity and psoriasis [27].
Clusters related to metabolic pathways, including glycolysis, lipid metabolism, and immune processes like antigen processing and presentation were also prominent in the induction group. Glycolytic enzymes such as glyceraldehyde-3-phosphate dehydrogenase and enolase-1 (ENO-1) are multifunctional enzymes that may accumulate in cancer cells due to the Warburg phenomenon. Previous studies have reported that ENO-1 is highly expressed in ER+ cancer cells [28]. We also found this protein in the IM. ENO-1 is a key glycolytic enzyme that has been used as a diagnostic marker to identify human lung cancers. Its expression is higher in ER+ tumors, where it has been linked to a poor prognosis [29]. Other proteins, like apolipoprotein A1, have been associated with the induction of IL-6 in osteoarthritis patients [30]. Metabolic pathway-associated DAMPs have been previously implicated in the pathogenesis of various immunological diseases [31]. These findings underscore the dual role of metabolic enzymes in tumor progression and their potential as immunogenic DAMPs. However, the same can be verified by studying their exact effect on the immune microenvironment of BC in futuristic studies.
Further, immune-related pathways, including the complement and coagulation cascades, phagosome, and neutrophil extracellular trap (NET) formation proteins, were significantly enriched. The complement system and coagulation pathways are integral to immune responses and hemostasis. Activation of these pathways can lead to the generation of DAMPs, which may influence necroptosis. For instance, components of the complement system can interact with necroptotic cells, potentially enhancing inflammatory responses [32]. Also, an occasional study has suggested that C3 complement protein can act as a DAMP and play some role in the induction of immune responses upon cell death. Phagosomes, responsible for engulfing debris and pathogens, are stimulated by DAMP release during necroptosis, promoting cell clearance and immune modulation.
The NET formation proteins like histones, myeloperoxidase, neutrophil elastase, peptidylarginine deiminase 4, cathepsin G, proteinase 3, and lysozyme, typically linked to neutrophils, are also expressed in T-47D BC cells, and can function as DAMPs. These proteins, such as histones and extracellular DNA, when released into the ECM, play dual roles by aiding in pathogen defence while contributing to inflammation, tissue damage, and immune dysregulation in pathological contexts. NETs have been shown to induce macrophage pyroptosis, highlighting their complex role in cell death and immune interactions [33].
The proteomic analysis also showed the presence of other cytoskeletal proteins besides keratins in the IM. Cytoskeletal proteins, such as actin, tubulin, and intermediate filaments, are essential for maintaining cell structure and integrity. During necroptosis, plasma membrane disruption can lead to the release of these proteins into the extracellular space. Once outside the cell, these proteins have the potential to act as DAMPs by interacting with PRRs on immune cells, thereby promoting inflammatory responses [34, 35]. A variable expression of tubulin has been observed across different histological types of BC in previous studies, and its overexpression has been associated with adverse features in the above cancer [36]. Another protein, i.e., co-actosin-like, is an F-actin-binding protein whose role in cancer is largely unknown. It is highly expressed in a rat epithelial BC cell line, and the expression of the protein in MCF-7 was found to induce IL-24, which is a tumor-suppressive cytokine [37].
Pathway analysis identified proteins associated with integrin and G-signaling, which are crucial in the development and progression of many tumors including BC [38]. Also, several studies over the last decade have demonstrated that ECM/integrin signaling provides a survival advantage to various cancer cell types against numerous chemotherapeutic drugs and antibody therapy [39]. Calaf and Abarca-Quinones [40] recently reported that Ras-associated protein can be used as a biomarker for predicting the progression of BC.
We have yet to find classical and more commonly released DAMPs like HMGB1, ATP, CRT, etc. This may be because cells were not dead but only stressed in response to the combination strategy used by us to induce necroptosis. Studying the differences in the DAMPs released from stressed cells that can also recover versus those released from dead ones in futuristic work may perhaps help to explain the above in a better way!
To investigate the immunomodulatory effects of DAMPs, we co-cultured THP-1 cells and differentiated macrophages with the BC cells in the presence of IM. Macrophages are immune cells selectively modulated by cancer cells to promote tumor growth. To investigate the impact of IM on macrophage differentiation and polarization, we assessed their transition into M1 or M2 phenotypes. M1 macrophages, known for their pro-inflammatory and anti-tumor activities, contrast with M2 macrophages, which are anti-inflammatory and associated with tumor progression [41]. This study observed an increase in both M1 and M2 macrophage markers, likely due to the diverse DAMPs present in the IM. It is plausible that specific DAMPs promote M1 polarization while others favour M2 differentiation. To elucidate the individual roles of these DAMPs, further experiments are needed to isolate and characterize each DAMP, followed by targeted stimulation of THP-1 cells. This approach will enable the identification of specific DAMPs driving M1 or M2 macrophage phenotypes, providing deeper insights into their immunomodulatory roles and therapeutic potential in BC.
Additionally, we explored literature correlating the proteins found in IM with macrophage activity. Past research has highlighted the varied effects of proteins identified in IM on macrophage properties. For instance, studies suggest that HSP expression patterns play a role in macrophage differentiation and polarization [42]. Keratin biomaterials have been proposed to facilitate monocyte differentiation into M2 macrophages [43]. Meanwhile, glycolytic pathway enzymes, such as ENO-1, have been associated with favouring the M1 phenotype, as reported in rheumatoid arthritis studies [44]. A detailed analysis of individual proteins identified in IM and their effects on immune and non-immune players within the TME may help pinpoint proteins relevant to immunotherapy.
The phagocytic activity of macrophages plays an important role in the clearance of debris released due to cell death. Our study evaluated the effect of exposure to a DAMPs-containing medium on macrophage phagocytic activity using flow cytometry. However, no significant changes were noticed. A potential explanation could be that THP-1 cells differentiated into both M1 and M2 macrophage subtypes. M1 macrophages are known to phagocytose tumor cells by recognizing specific signals, while M2 macrophages infiltrate tumors, secrete anti-inflammatory cytokines and growth factors that promote angiogenesis and tumor growth, and also suppress T-cell activity through immunosuppressive cytokine release [45].
We did not analyse the co-culture medium for cytokine profiles, which may provide insights into the observed outcomes. It is possible that M1 macrophages did not receive sufficient stimulation or were inhibited by immunosuppressive cytokines secreted by M2 macrophages. However, this remains speculative. Further studies are needed to analyse the conditioned medium for cytokine composition and its impact on macrophage function. Future research exploring these mechanisms may illuminate the interplay between DAMPs, macrophage polarization, and their functional roles in tumor progression.
Overall, the above study has helped to identify novel molecules present in a medium derived from ER+ BC cells in which an attempt was made to induce necroptosis via the TNF-α pathway. In addition to well-known identified DAMPs like (HSPs: HSPB, HSPA1L, HSP90AA1) we also found some molecules like olfactomedin like family 3 (OLFML3) and co-actosin like F-actin binding protein-1 (COTL1) with the potential to act as DAMPs; however, their exact importance in the context of immune response in BC remains to be investigated. Also, the conditioned medium from necroptosis-induced BC cells was observed to promote monocyte differentiation into macrophages. We believe that our results represent a step forward in identifying molecules that may be explored further as targets for immune-based therapies in BC, especially those resistant to conventional therapies.
In this study, we have evaluated the impact of DAMPs released from an ER+ BC cell line following necroptosis on macrophage differentiation. However, the specific roles of individual DAMPs and the signaling pathways they activate were not characterized. Future research should extend these findings to in vivo models using ER+ malignant cells derived from human BC patients to better understand their effects on myeloid cell differentiation in a more complex biological context. Additionally, it is recommended to analyze pMLKL levels post-necroptosis modulation, as well as protein-level expression of M1 and M2 macrophage markers following IM treatment, to provide a more comprehensive understanding of effect on immune response.
ATP: adenosine triphosphate
BC: breast cancer
CRT: calreticulin
DAMPs: damage-associated molecular patterns
ECM: extracellular matrix
ER+: estrogen receptor-positive
HMGB1: high-mobility group box 1 protein
ICD: immunogenic cell death
IM: induction medium
InM: inhibition medium
PCD: programmed cell death
PRRs: pattern recognition receptors
RT: room temperature
TME: tumor microenvironment
The supplementary figures for this article are available at: https://www.explorationpub.com/uploads/Article/file/1003194_sup_1.pdf.
BT, AD, and AKR: Data curation, Investigation, Methodology, Project administration, Software, Validation, Visualization, Writing—original draft. RV: Software, Validation, Visualization, Methodology, Writing—original draft. YK and AB: Conceptualization, Formal analysis, Funding acquisition, Investigation, Methodology, Resources, Supervision, Validation, Visualization, Writing—review & editing.
The authors declare that there is no conflict of interest involved.
Not applicable.
Not applicable.
Not applicable.
Datasets are available on request: The raw data supporting the conclusions of this manuscript will be made available by the authors, without undue reservation, to any qualified researcher.
The authors acknowledge the funding support provided by PGIMER for this work. The funders had no role in study design, data collection and analysis, decision to publish, or preparation of the manuscript.
© The Author(s) 2025.
Open Exploration maintains a neutral stance on jurisdictional claims in published institutional affiliations and maps. All opinions expressed in this article are the personal views of the author(s) and do not represent the stance of the editorial team or the publisher.
Copyright: © The Author(s) 2025. This is an Open Access article licensed under a Creative Commons Attribution 4.0 International License (https://creativecommons.org/licenses/by/4.0/), which permits unrestricted use, sharing, adaptation, distribution and reproduction in any medium or format, for any purpose, even commercially, as long as you give appropriate credit to the original author(s) and the source, provide a link to the Creative Commons license, and indicate if changes were made.