 Original Article

Affiliation:
Centre for Diabetes, School of Biomedical Sciences, Ulster University, BT52 1SA Coleraine, UK
Email: a.sridhar@ulster.ac.uk
ORCID: https://orcid.org/0000-0002-3865-5067
Affiliation:
Centre for Diabetes, School of Biomedical Sciences, Ulster University, BT52 1SA Coleraine, UK
Affiliation:
Centre for Diabetes, School of Biomedical Sciences, Ulster University, BT52 1SA Coleraine, UK
Affiliation:
Centre for Diabetes, School of Biomedical Sciences, Ulster University, BT52 1SA Coleraine, UK
ORCID: https://orcid.org/0000-0001-8548-7943
Affiliation:
Centre for Diabetes, School of Biomedical Sciences, Ulster University, BT52 1SA Coleraine, UK
ORCID: https://orcid.org/0000-0002-7196-7863
Affiliation:
Centre for Diabetes, School of Biomedical Sciences, Ulster University, BT52 1SA Coleraine, UK
ORCID: https://orcid.org/0000-0001-7355-1821
Explor Endocr Metab Dis. 2026;3:101475 DOI: https://doi.org/10.37349/eemd.2026.101475
Received: March 03, 2026 Accepted: May 29, 2026 Published: June 29, 2026
Academic Editor: Marijn Speeckaert, Universitair Ziekenhuis Ghent, Belgium
The article belongs to the special issue Innovative Strategies for Diabetes and Metabolic Disorders: Current and Future Directions
Aim: Estrogens regulate energy balance and glucose homeostasis, but whether they coordinate endocrine changes across the gut–pancreas axis in obesity remains unclear. This study examined whether ethinyl estradiol (EE2) improves metabolic control in obese diabetic mice through combined effects on pancreatic islets and intestinal enteroendocrine cells.
Methods: Female ob/ob mice received EE2 (4,000 ng/mL) or vehicle in drinking water for 21 days. Body weight, food intake, glucose levels, glucose tolerance, pancreatic islet composition, and ileal enteroendocrine cell populations were assessed using biochemical assays and immunohistochemistry.
Results: EE2 significantly reduced body weight and energy intake and produced sustained lowering of blood glucose with markedly improved glucose tolerance and reduced terminal insulin levels. EE2 increased islet density and beta-cell proliferation and shifted islet size distribution toward larger islets, consistent with enhanced islet growth. Alpha-cell area was significantly reduced, indicating improved insulin–glucagon balance. Peptide YY (PYY)-positive cells within pancreatic islets were markedly increased, whereas somatostatin (SST)-positive cells were unchanged. In the ileum, EE2 significantly reduced crypt depth and increased the number of glucagon-like peptide-1 (GLP-1) and glucose-dependent insulinotropic polypeptide (GIP)-positive enteroendocrine cells, particularly within crypt regions, indicating enhanced incretin cell abundance. These coordinated changes across the gut and pancreas were associated with improved glucose control and reduced hyperinsulinaemia.
Conclusions: EE2 improves metabolic control in obese diabetic mice through linked changes in pancreatic islet cell composition and intestinal incretin-producing cells. By increasing beta-cell renewal, reducing alpha-cell area, and enhancing GLP-1, GIP, and PYY expression, estrogen establishes a gut–pancreas endocrine environment that supports glucose homeostasis in obesity.
The global prevalence of obesity and its associated metabolic disorders, such as type 2 diabetes mellitus (T2DM), represents a significant public health challenge [1]. The intricate relationship between obesity and hormonal regulation is a critical area of investigation, with a complex and often bidirectional interplay between metabolic state and hormonal levels [2, 3]. While hormones like leptin and insulin are primary regulators of appetite and metabolism, sex hormones also play a crucial and multifaceted role [4].
The association between obesity and sex hormone levels is highly context-dependent. One investigation found that the average estradiol level in obese premenopausal women was 32.8 pg/mL, compared to 39.8 pg/mL in non-obese women [5]. Estrogen is a potent regulator of core energy metabolism, influencing processes such as insulin secretion, insulin sensitivity, and hepatic glucose production [6, 7]. A deficiency in estrogen can thus promote metabolic dysfunction, predisposing individuals to obesity and T2DM [8].
Given the pronounced metabolic effects of estrogens, preclinical models offer a valuable platform to investigate their therapeutic potential. The ob/ob mouse model is a foundational tool in this research, as it serves as a well-established genetic model for obesity and T2DM [9]. These mice are homozygous for a spontaneous mutation in the leptin gene, leading to a complete deficiency of this key satiety hormone and a severe phenotype characterized by morbid obesity, hyperphagia, glucose intolerance, and hyperinsulinemia [10]. This model is particularly useful for studying the downstream physiological and morphological changes that occur once a state of severe metabolic dysfunction is established [11].
The pathologies of obesity extend to a host of profound morpho-functional changes in the primary organs of glucose regulation. In diet-induced obese (DIO) female mice, the pancreatic beta-cells initially undergo a robust compensation, exhibiting insulin hypersecretion and hyperinsulinemia to maintain normoglycemia [12, 13]. Concurrently, the alpha-cells, which produce glucagon, show a reduced area and impaired suppression of glucagon secretion during hyperglycaemia [13, 14]. However, this compensatory phase is ultimately overwhelmed, progressing to beta-cell failure driven by suppressed AMP-kinase (AMPK) activity, mitochondrial dysfunction, and elevated cholesterol synthesis within the islets [15]. At the cellular level, pancreatic islets express estrogen receptor alpha (Erα), ERβ, and G-protein-coupled estrogen receptor (GPER), enabling both transcriptional and rapid extranuclear estrogen signalling [16]. Activation of these receptors increases insulin gene expression and content [17], enhances glucose-stimulated insulin secretion [18], and protects beta-cells from oxidative and ER stress, thereby reducing apoptosis [19, 20]. Under conditions of increased metabolic demand or beta-cell stress, such as T2DM or partial pancreatomy, estrogens also promote islet beta-cell proliferation [21, 22], with ERα frequently implicated as a key driver of cell cycle entry [23]. While the magnitude of adult beta-cell replication is modest, incremental gains coupled with anti-apoptotic actions can meaningfully influence beta-cell mass over time.
The intestinal tract also undergoes significant pathology in obese models, contributing directly to systemic metabolic dysfunction [13, 24]. Maternal obesity, for instance, leads to offspring with an impaired gut epithelial barrier and a reduced villi-to-crypt ratio in the ileum, due to a decrease in villus height and an increase in crypt depth [25]. These morphological changes are linked to systemic inflammation. Furthermore, studies in morbidly obese individuals and mouse models demonstrate an accelerated rate of proximal intestinal glucose absorption, which is directly associated with increased expression of the glucose transporter Sodium–glucose co-transporter 1 (SGLT-1) [26, 27]. This enhanced absorption creates a hormonal profile that promotes persistent hyperinsulinemia and hyperglycaemia, a key mechanism of the “foregut theory” of T2DM progression [28]. In addition, estrogens influence the gastrointestinal tract, including barrier integrity and the enteroendocrine system [29, 30]. Enteroendocrine cells (EECs) secrete glucagon-like peptide-1 (GLP-1), peptide YY (PYY), and glucose-dependent insulinotropic polypeptide (GIP) to regulate appetite, insulin secretion, and energy balance, and their abundance and secretory tone are altered in obesity [31, 32]. Estradiol has been shown to modulate gut permeability and reshape the microbiota; changes linked to shifts in incretin signalling and whole body metabolism [33]. Despite this, comprehensive analyses of estrogen-induced intestinal morphometry and EEC distributions in genetic obesity remain sparse.
The purpose of this study was to examine whether a synthetic estrogen, ethinyl estradiol (EE2), could therapeutically modulate the metabolic dysfunction in this genetic model. The investigation was designed not only to assess the functional outcome of the intervention via a glucose tolerance test (GTT) but, more importantly, to identify the precise morphological and cellular substrates of its action. Using immunofluorescence of pancreatic sections from EE2-treated ob/ob mice, we assessed islet areas, beta/alpha compartments, alpha-cell localization, and beta-cell proliferation. We also conducted intestinal analysis (crypt/villus morphometry and EEC distribution). By linking systemic metabolic outcomes with specific morphological changes in these key organs, this study aims to provide comprehensive insights into the potential of estrogenic compounds for treating obesity and related metabolic diseases.
Female ob/ob (C57BL/6J background) mice (14–16 weeks of age) were housed individually at 22 ± 2°C on a 12 h light/dark cycle with ad libitum access to drinking water and standard rodent diet (10% fat, 30% protein, and 60% carbohydrate; Trouw Nutrition, Northwich, UK). The model exhibits leptin deficiency, severe obesity, insulin resistance, and islet enlargement/hyperinsulinemia [11]. Mice were randomized to vehicle or EE2 (Catalog no. 10006486, Cayman Chemical) at 4,000ng/mL in drinking water for 21 days. Group sizes (n = 6 per group) are consistent with previous studies for detecting metabolic and hormonal differences in this model [34, 35]. As described previously [36], EE2 has a low solubility in water and hence was initially dissolved in 95% ethanol (5mg/mL). Solubilized EE2 was then added to acidified drinking water (pH 2.5) to produce different dose concentrations, and consumption was recorded to estimate compound intake per animal. For the control groups, an equivalent volume of ethanol (0.1%) was added to acidified drinking water (pH 2.5). EE2-containing water was prepared fresh and replaced every 2–3 days, consistent with its reported stability in aqueous solution over this period [36]. Body weight, blood glucose, and food intake were recorded every 3–4 days. Humane endpoints were predefined to minimise animal suffering. Animals were monitored daily for clinical signs of distress, including body weight loss, lethargy, impaired mobility, poor grooming, and abnormal posture. No animals were allowed to reach severe or unrelieved distress, and all procedures were carried out in accordance with ethical regulations. Mice were euthanized by lethal inhalation of CO2 followed by cervical dislocation. All experiments were conducted under the UK Animals (Scientific Procedures) Act 1986 & EU Directive 2010/63EU and approved by the University of Ulster Animal Welfare and Ethical Review Body (AWERB).
A GTT was performed by evaluating plasma glucose after intraperitoneal (i.p.) injection of glucose (18 mmol/kg body weight, Catalog number: 131341, AppliChem GmbH, Germany) in overnight (18 h) fasted mice. Blood glucose was measured using an Ascencia Contour blood glucose meter (Model no. 61275, Bayer Healthcare, Newbury, UK) at 15 min, followed by 30 min intervals.
Pancreas and ileum were excised and fixed immediately in 4% paraformaldehyde (Catalog no. 9713.5000, VWR, Bristol, UK) for 48 h at 4°C, dehydrated in increasing concentration of ethanol, paraffin-embedded, and sectioned at 5 µm thickness as described previously [37]. Sections were dewaxed in xylene, rehydrated in a series of ethanol solutions (100% to 50%), and incubated in citrate buffer for antigen retrieval at 95°C for 20 min. The slides were then blocked using bovine serum albumin (BSA) and incubated overnight with primary antibodies (Table 1), followed by Alexa Fluor® secondaries (Table 1) and stained with 4’,6-diamidino-2-phenylindole (DAPI, Catalog no. D9542-1MG, Sigma, Dorset, UK). Slides were mounted with antifade mounting medium and viewed using a fluorescent microscope (Olympus System Microscope, model BX51; Southend-on-Sea, UK) and imaged using a DP70 camera adapter system [37]. All staining procedures and image analysis were carried out in a blinded manner.
Target, host, and source of primary and secondary antibodies employed for immunofluorescent imaging experiments.
| Antibody | Target/Host | Dilution | Source/Fluorescent dilution and source* |
|---|---|---|---|
| Primary antibodies | Insulin/Mouse | 1:500 | Abcam, ab6995 |
| Glucagon/Guinea pig | 1:200 | Raised in-house PCA2/4 | |
| PYY/Rabbit | 1:500 | Abcam, ab22663 | |
| SST/Rat | 1:500 | Biorad, 8330-009 | |
| GLP-1/Rabbit | 1:200 | Raised in-house XJIC8 | |
| GIP/Rabbit | 1:400 | RIC34/111J, kindly donated by Professor L Morgan, Guildford, UK | |
| Ki-67/Rabbit | 1:200 | Abcam, ab15580 | |
| Secondary antibodies | Mouse/Goat IgG | 1:500 | A-11005, Alexa Flour 594, Invitrogen, UK |
| Guinea pig/Goat IgG | 1:500 | A-11073, Alexa Flour 488, Invitrogen, UK | |
| Rabbit/Goat IgG | 1:500 | A-11012, Alexa Flour 594, Invitrogen, UK | |
| Rat/Goat IgG | 1:500 | A-11006, Alexa Flour 488, Invitrogen, UK |
*: for secondary antibodies. GLP-1: glucagon-like peptide-1; PYY: peptide YY; GLP-1: glucagon-like peptide-1; GIP: glucose-dependent insulinotropic polypeptide; SST: somatostatin.
Using ImageJ, we quantified per islet: total area, beta-cell (insulin positive) area, alpha-cell (glucagon positive) area, and number of islets per mm2 pancreas using the polygon function [38]. Beta-cell proliferation was defined as insulin-positive Ki-67-positive nuclei/total insulin-positive cells (%). Per mouse, ≥ 10 islets were analyzed across ≥ 3 sections (blinded). For ileum analysis, crypt depth, villus length, GLP-1, and GIP cell counts per mm2 in crypts and villi were measured [38]. Quantification of cell counts was performed on multiple non-overlapping fields, and the average number of positive cells was normalised to tissue area (cells/mm2) to provide a representative and unbiased assessment.
For plasma insulin analysis, terminal blood samples were collected into chilled fluoride/heparin glucose micro-centrifuge tubes (Sarstedt, Numbrecht, Germany) and immediately centrifuged using a Beckman microcentrifuge (Beckman Instruments, Galway, Ireland) for 10 min at 13,000 × g and stored at −20°C, prior to determination of insulin concentrations by a modified insulin radioimmunoassay [39].
Statistical analysis was performed using GraphPad PRISM software (Version 8.0). Values are expressed as mean ± SEM. Comparative analysis between groups was carried out using Student’s unpaired t-test for independent samples. For experiments involving multiple time points, a two-way ANOVA was used to assess the effects of group and time, with Bonferroni post hoc analysis. Data were assessed for normality using the Shapiro-Wilk test and for homogeneity of variance using the Brown-Forsythe test prior to parametric analysis. The difference between groups was considered significant if p < 0.05.
At the end of the treatment period, mice in the EE2 group exhibited a reduction in body weight (63.3 ± 6.6 g) compared with their baseline (69.6 ± 5.5 g), whereas controls showed a slight increase (70.3 ± 6.3 g vs. 67.3 ± 5.7 g; Figure 1A). Blood glucose levels in the EE2 group were significantly reduced (p < 0.05 to p < 0.001) from day 7 onwards, remaining lower than controls until study completion (e.g., 27.0 ± 2.7 mmol/L vs. 7.7 ± 1.0 mmol/L on day 7; 25.5 ± 1.6 mmol/L vs. 3.5 ± 0.8 mmol/L at endpoint; Figure 1B). EE2 treatment also led to a marked reduction in energy intake from days 4–21 (p < 0.05 to p < 0.001) compared with controls (Figure 1C), while EE2 intake within the group remained consistent throughout the study (Figure 1D). Furthermore, EE2 improved glucose tolerance, as reflected by significantly lower blood glucose levels at 30-, 60-, and 90-min following glucose administration (p < 0.01 to p < 0.001; Figure 1E). Correspondingly, 0–90 min area under the curve (AUC) analysis revealed a significant reduction in glucose excursion in EE2-treated mice compared with controls (p < 0.001; Figure 1F). Terminal plasma insulin was also significantly reduced in the EE2-treated mice compared to untreated control ob/ob mice (p < 0.01; Figure 1G).
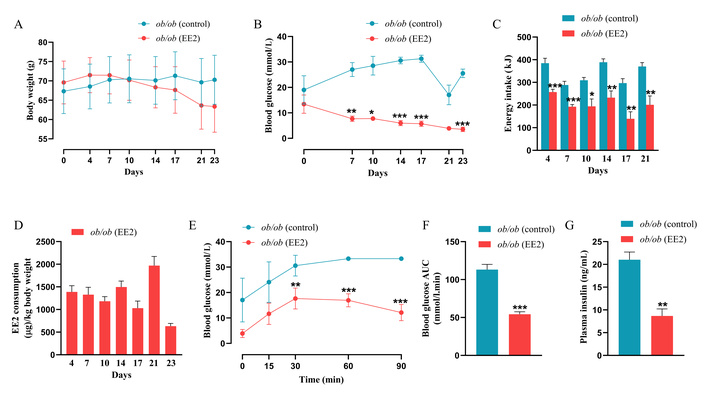
Effect of 21 days of ethinyl estradiol (EE2) administration on metabolic parameters in female ob/ob mice. (A) Body weight (g); (B) Blood glucose (mmol/L); (C) Energy intake (kJ); (D) EE2 consumption (µg/kg body weight). (E) Blood glucose was assessed immediately before and after intraperitoneal administration of glucose (18 mmol/kg bw). Respective (F) blood glucose area under the curve (AUC) data is also shown. (G) Plasma insulin (ng/mL) was measured in terminal samples. Values are mean ± SEM (n = 6 mice). *p < 0.05, **p < 0.01 and ***p < 0.001 compared to control ob/ob mice.
Representative immunostaining of pancreatic islets for insulin with glucagon or Ki-67 is shown in Figure 2A. Quantitative analysis revealed no significant differences in total islet area or beta-cell area between EE2-treated and control groups (Figures 2B, C). In contrast, alpha-cell area was significantly reduced in the EE2 group compared with controls (p < 0.05; Figure 2D). EE2 treatment also markedly increased beta-cell proliferative frequency (p < 0.001; Figure 2E) and significantly enhanced islet density, as indicated by a higher number of islets per mm2 of pancreas (p < 0.001; Figure 2F). Size distribution analysis showed comparable proportions of small islets between groups (35.41% vs. 35.29%), whereas control mice exhibited a higher proportion of medium-sized islets (33.31% vs. 29.41%) and a lower proportion of large islets (31.25% vs. 35.29%) compared with EE2-treated mice (Figure 2G).
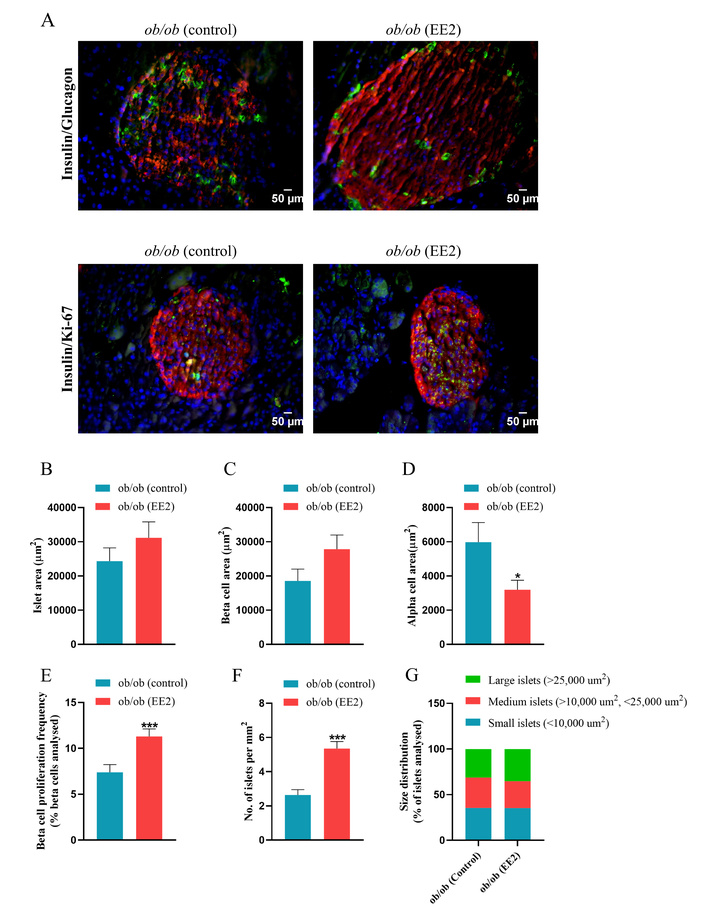
Effect of 21 days of ethinyl estradiol (EE2) administration on islet cell morphology and beta-cell proliferation in female ob/ob mice. (A) Representative images of islets stained for insulin (red), glucagon/Ki-67 (green) and 4’,6-diamidino-2-phenylindole (DAPI, blue), related quantification of (B) islet area (µm2), (C) beta-cell area (µm2), (D) alpha-cell area (µm2), (E) beta-cell proliferation frequency (% beta-cells analysed), (F) No. of islets per mm2 and (G) size distribution (% of beta-cells analysed). Values are mean ± SEM (n = 6 mice). *p < 0.05 and ***p < 0.001 compared to control ob/ob mice.
Representative immunostaining of islets for PYY and SST is shown in Figure 3A. EE2 treatment significantly increased the area of PYY-positive cells compared with controls (p < 0.05; Figure 3B), while no difference was observed in SST-positive cell area between groups (Figure 3D). EE2 did not alter the colocalization of PYY per total glucagon cells in ob/ob mice (Figure 3C). Greyscale images showing the separated fluorescence channels are provided in Supplementary Figure S1.
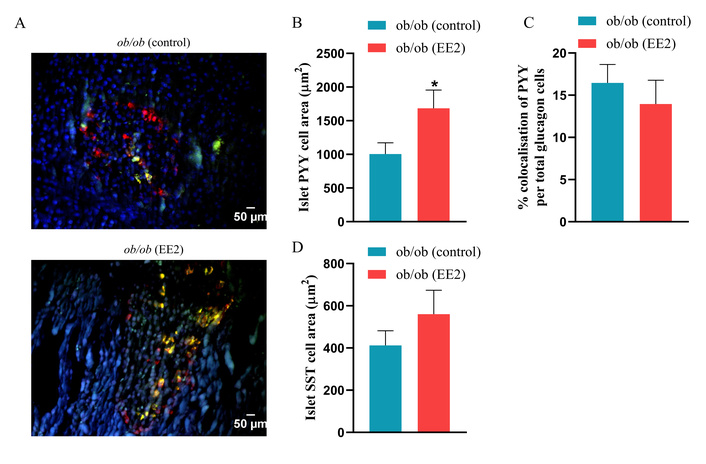
Effect of 21 days of ethinyl estradiol (EE2) administration on islet PYY and somatostatin (SST) cell area in female ob/ob mice. (A) Representative images of islets stained for peptide YY (PYY) (red), SST (green), and 4’,6-diamidino-2-phenylindole (DAPI, blue), related quantification of (B) islet PYY cells area (µm2), (C) % colocalization of PYY per total glucagon cells, and (D) islet SST cell area (µm2). Values are mean ± SEM (n = 6 mice). *p < 0.05 compared to control ob/ob mice.
Representative images of the ileum stained for GLP-1, GIP, and PYY are shown in Figures 4A, 5A, and 6A, respectively. EE2 treatment significantly decreased crypt depth compared to control mice with no change in villi length (p < 0.001; Figures 4B, C). EE2 also increased the number of GLP-1-positive cells in the ileum, including both crypt and villus regions, compared with controls (p < 0.001; Figures 4D–F). Similarly, the number of GIP-positive cells was significantly higher in the ileum and crypts of EE2-treated mice, although no difference was observed in the villi (p < 0.05 to p < 0.01; Figures 5B–D). There was no change in the number of PYY-positive cells in the ileum, its crypt and villi (Figures 6B–D).
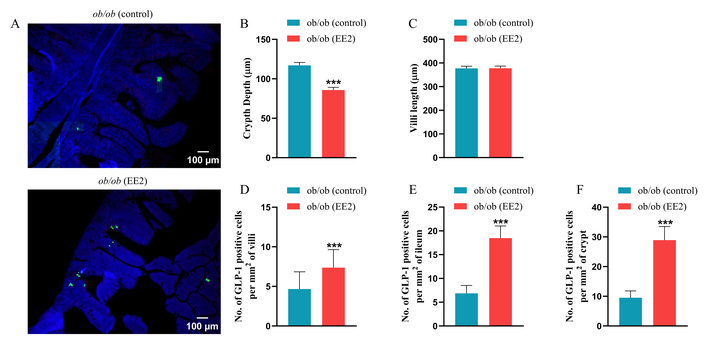
Effect of 21 days of ethinyl estradiol (EE2) administration on ileum morphology and GLP-1 cell distribution in female ob/ob mice. (A) Representative images of ileum stained for GLP-1 (green) and 4’,6-diamidino-2-phenylindole (DAPI, blue). Related quantification of (B) crypt depth and (C) villi length, (D) % GLP-1 positive cells per mm2 of villi, (E) % GLP-1 positive cells per mm2 of ileum, and (F) % GLP-1 positive cells per mm2 of crypt. For each animal, 30–40 non-overlapping fields were analysed and averaged to obtain a single value per mouse. Values are presented as mean ± SEM (n = 6 mice per group). ***p < 0.001 compared to control ob/ob mice.
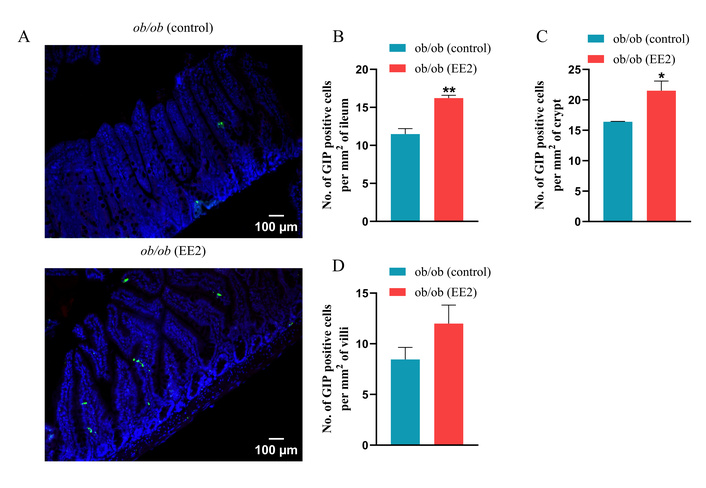
Effect of 21 days of ethinyl estradiol (EE2) administration on ileum morphology and GIP cell distribution in female ob/ob mice. (A) Representative images of ileum stained for GIP (green) and 4’,6-diamidino-2-phenylindole (DAPI, blue). Related quantification of (B) % GIP positive cells per mm2 of ileum, (C) % GIP positive cells per mm2 of crypt, and (D) % GIP positive cells per mm2 of villi. For each animal, 30–40 non-overlapping fields were analysed and averaged to obtain a single value per mouse. Values are presented as mean ± SEM (n = 6 mice per group). *p < 0.05 and **p < 0.01 compared to control ob/ob mice.
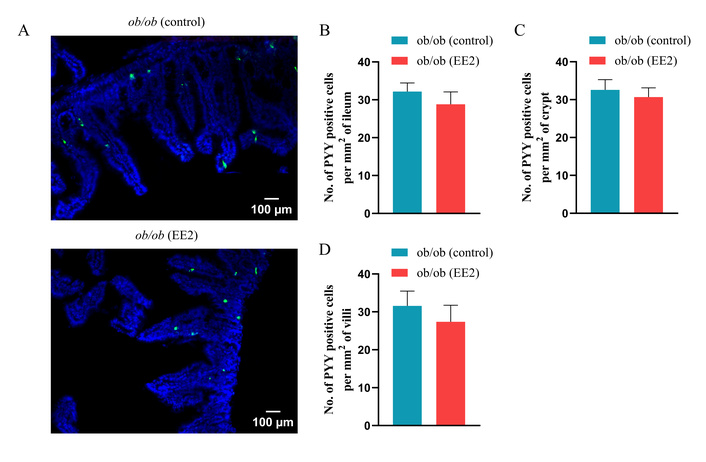
Effect of 21 days of ethinyl estradiol (EE2) administration on ileum morphology and PYY cell distribution in female ob/ob mice. (A) Representative images of ileum stained for PYY (green) and 4’,6-diamidino-2-phenylindole (DAPI, blue). Related quantification of (B) % PYY positive cells per mm2 of ileum, (C) % PYY positive cells per mm2 of crypt, and (D) % PYY positive cells per mm2 of villi. For each animal, 30–40 non-overlapping fields were analysed and averaged to obtain a single value per mouse. Values are presented as mean ± SEM (n = 6 mice per group).
Estrogens are well-established regulators of energy balance and glucose homeostasis, particularly in females [21, 40], yet their capacity to coordinate adaptive remodelling of both pancreatic islets and the enteroendocrine system in obesity remains poorly defined [41, 42]. In this study, we demonstrate that treatment of ob/ob mice with the synthetic estrogen EE2 produces coordinated improvements in body weight, glucose control, islet architecture, and gut endocrine cell composition. Collectively, these findings suggest that EE2 induces an integrated metabolic adaptation involving both central appetite regulation and peripheral endocrine remodelling, rather than isolated tissue-specific effects.
EE2 treatment produced a rapid and sustained reduction in body weight, accompanied by a marked decrease in energy intake. Because ob/ob mice lack functional leptin, these effects demonstrate that estrogen can suppress appetite through leptin-independent mechanisms, consistent with previous studies in this model [43, 44]. Although circulating leptin levels were not measured in the present study, the established leptin-deficient phenotype of ob/ob mice supports a model in which estrogen signalling can bypass leptin deficiency by engaging parallel hypothalamic circuits involved in energy balance regulation. However, direct assessment of leptin would provide additional mechanistic insight. Estrogens are known to act centrally through hypothalamic ERα-expressing neurons to regulate feeding behaviour [45], in part via modulation of neuropeptide Y (NPY) pathways [46]. The present data therefore support the concept that estrogenic signalling provides an alternative satiety pathway when leptin signalling is absent or impaired. Although 17beta-estradiol has been reported to reduce body weight by increasing energy expenditure in other models [47], the consistent reduction in food intake observed here indicates that appetite suppression is a major contributor to the weight-lowering effect of EE2 in ob/ob mice. This is particularly relevant given that estrogen and leptin pathways converge on kisspeptinergic neurons [48], suggesting that estrogen may compensate for defective leptin signalling to restore satiety.
Beyond its effects on body weight, EE2 exerted profound effects on glucose metabolism. EE2-treated mice displayed sustained reductions in fasting glycaemia and markedly improved glucose tolerance, consistent with previous studies showing that estrogens and estrogen derivatives enhance insulin sensitivity and preserve islet function [42, 49]. These findings reinforce the therapeutic potential of EE2 in metabolic disease [9, 42, 50]. Although appetite suppression clearly contributes to improved metabolic status [46], the present data indicate that EE2 also acts directly on glucose-regulating tissues.
Glucose tolerance was significantly improved in EE2-treated mice, as reflected by reduced glucose excursion and AUC during GTT. This improvement likely reflects both enhanced peripheral insulin action and improved pancreatic endocrine function. Mechanistically, this dual improvement suggests that EE2 may act both upstream at the level of systemic insulin sensitivity and downstream at the level of islet endocrine responsiveness, thereby amplifying glucose clearance through complementary pathways. Estrogen increases insulin sensitivity in skeletal muscle and adipose tissue [49] while simultaneously preserving beta-cell survival, proliferation, and glucose-stimulated insulin secretion [19, 40, 41, 51]. This is further supported by studies in ERα knockout mice, which demonstrate impaired insulin responsiveness in peripheral tissues when estrogen signalling is disrupted [52]. Together, these observations indicate that EE2 promotes glucose homeostasis through both improved insulin sensitivity and preservation of functional beta-cell mass.
At the islet level, EE2 induced marked structural remodelling. Although total islet and beta-cell area were unchanged, EE2 significantly increased beta-cell proliferation and islet density and shifted islet size distribution toward larger islet clusters. These changes are consistent with enhanced islet remodelling, in line with previous reports showing that estrogens stimulate beta-cell proliferation and protect against apoptosis [19, 21, 41, 53]. The reduction in medium-sized islets and increase in large islets in EE2-treated mice further support a transition toward a more mature and metabolically competent islet population. These structural adaptations are consistent with estrogen-driven activation of proliferative and survival signalling pathways within beta-cells, potentially involving ERα-mediated modulation of cell cycle and anti-apoptotic pathways [53].
EE2 also significantly reduced alpha-cell area. Obesity and insulin resistance in humans are associated with alpha-cell expansion and hyperglucagonemia, which contribute to excessive hepatic glucose output and worsening hyperglycaemia [54]. Although alpha-cell dynamics in rodent models can differ [55, 56], limiting alpha-cell expansion in ob/ob mice is likely to improve insulin–glucagon balance and support glycaemic control. This suggests that EE2 may contribute to improved glucose homeostasis not only through enhanced insulin output but also through suppression of inappropriate glucagon-driven hepatic glucose production [49]. The combination of reduced alpha-cell area and increased beta-cell proliferation, therefore, represents a favourable reorganisation of islet endocrine architecture.
A particularly notable finding was the increase in PYY-positive cells within the islets of EE2-treated mice. We previously demonstrated that PYY not only suppresses appetite but also directly protects pancreatic beta-cells by reducing apoptosis and preserving islet morphology [13]. PYY plays an important role in energy and glucose regulation and supports islet function. In vitro, PYY protects beta-cells from DNA damage [57], and in vivo, it preserves islet integrity [58]. The increase in islet PYY expression observed here raises the possibility that PYY acts as an intra-islet paracrine mediator linking estrogen signalling to beta-cell survival and functional adaptation, thereby providing a local mechanism of islet protection independent of systemic gut-derived effects [57]. In contrast, SST-positive delta cells were unchanged, suggesting that EE2 selectively remodels alpha- and beta-cell compartments rather than broadly altering all endocrine populations [59]. Collectively, these data indicate that EE2 promotes a more favourable islet phenotype by reducing alpha-cell mass, enhancing beta-cell renewal, and increasing PYY-mediated cytoprotection.
EE2 also induced substantial remodelling of the intestinal enteroendocrine system. Obesity impairs EEC function and reduces GLP-1 secretion [60, 61]. In EE2-treated mice, GLP-1-positive cells were significantly increased in both crypts and villi. Given the well-established actions of GLP-1 on insulin secretion, appetite suppression, and beta-cell survival [62], this likely contributes to the improved glucose tolerance and reduced food intake observed. Similarly, GIP-positive cells were increased, particularly within the crypt compartment. GIP plays an important role in amplifying insulin secretion and regulating glucose metabolism [63], and its upregulation may further support metabolic control [64]. Importantly, the concurrent upregulation of GLP-1 and GIP suggests that EE2 does not act on a single incretin pathway but rather induces a broader reprogramming of enteroendocrine differentiation toward an insulinotropic and metabolically favourable profile. Although GIP is predominantly produced by K cells in the proximal small intestine [65], the present analysis focused on the ileum to enable a coordinated assessment of multiple EEC populations within a single intestinal region, particularly GLP-1 and PYY-expressing L cells [66]. Taken together, these findings support a coordinated gut–pancreas endocrine axis response to EE2, in which structural and functional remodelling of both tissues act synergistically to improve metabolic homeostasis.
Crypts and villi form the structural and functional units of the small intestine, with crypts housing proliferative progenitors and villi containing differentiated absorptive and endocrine cells [67]. Deeper crypts reflect increased proliferative demand, a feature of obesity-associated gut remodelling [68, 69]. EE2 significantly reduced crypt depth while increasing GLP-1 and GIP-positive EECs, suggesting that estrogen relieves obesity-induced hyperproliferation and promotes efficient differentiation toward metabolically beneficial EEC lineages. Estrogen signalling via ERα, ERβ, and GPER has been shown to influence intestinal architecture [70–72], supporting a direct role for EE2 in coordinating gut endocrine remodelling. The concurrent modulation of gut hormone-producing cells and islet architecture following EE2 treatment supports a model of integrated gut–pancreas axis regulation, whereby both direct actions on pancreatic tissue and indirect enteroendocrine signalling may contribute to the observed metabolic improvements. Complementary quantitative approaches, such as Western blotting, would further strengthen the validation of these findings in future studies. A limitation of the present study is the absence of a lean, normal-weight control group. While comparisons between untreated and EE2-treated ob/ob mice reveal treatment effects within a disease context, they do not determine whether EE2 restores parameters to normal physiological levels. Inclusion of a healthy control group in future studies would allow clearer assessment of the extent of normalisation. In addition, circulating estradiol/EE2 concentrations were not measured, and administration via drinking water may introduce variability in dosing. Therefore, the physiological relevance of the selected EE2 dose cannot be fully established, and the observed effects likely reflect pharmacological estrogen exposure rather than precise restoration of endogenous hormone levels.
In conclusion, EE2 treatment in ob/ob mice produced significant improvements in body weight, energy intake, and glycaemic control, accompanied by coordinated remodelling of pancreatic islets and the enteroendocrine system. Increased beta-cell proliferation, reduced alpha-cell area, and enhanced expression of GLP-1, GIP, and PYY together define a favourable gut–islet endocrine environment that supports glucose homeostasis. These findings provide a mechanistic framework for estrogen-driven gut–islet remodelling and highlight the therapeutic potential of estrogenic compounds in obesity-associated diabetes and beta-cell dysfunction in females.
AUC: area under the curve
EE2: ethinyl estradiol
EECs: enteroendocrine cells
Erα: estrogen receptor alpha
GIP: glucose-dependent insulinotropic polypeptide
GLP-1: glucagon-like peptide-1
GPER: G-protein-coupled estrogen receptor
GTT: glucose tolerance test
PYY: peptide YY
SST: somatostatin
T2DM: type 2 diabetes mellitus
The supplementary figure for this article is available at: https://www.explorationpub.com/uploads/Article/file/101475_sup_1.pdf.
AS: Conceptualization, Data curation, Formal analysis, Writing—original draft, Writing—review & editing, Investigation. VNI: Data curation, Formal analysis, Writing—original draft. OM: Data curation, Formal analysis. PRF: Conceptualization, Supervision, Visualization, Writing—review & editing. CRM: Conceptualization, Funding acquisition, Supervision, Visualization, Writing—review & editing. DK: Conceptualization, Data curation, Supervision, Visualization, Writing—review & editing. All authors read and approved the submitted version.
Dr. Dawood Khan, who is the Guest Editor of Exploration of Endocrine and Metabolic Diseases, had no involvement in the decision-making or the review process of this manuscript. The other authors declare no conflicts of interest.
All experiments were conducted under the UK Animals (Scientific Procedures) Act 1986 & EU Directive 2010/63EU as well as the UK Home Office animal project license number PPL2902, and approved by the University of Ulster Animal Welfare and Ethical Review Body (AWERB).
Not applicable.
Not applicable.
The datasets supporting the findings of this study are available from the corresponding author upon reasonable request.
These studies were supported by Diabetes UK RD Lawrence Fellowship grant to RCM and Ulster University strategic funding. The funders had no role in study design, data collection and analysis, decision to publish, or preparation of the manuscript.
© The Author(s) 2026.
Open Exploration maintains a neutral stance on jurisdictional claims in published institutional affiliations and maps. All opinions expressed in this article are the personal views of the author(s) and do not represent the stance of the editorial team or the publisher.
Copyright: © The Author(s) 2026. This is an Open Access article licensed under a Creative Commons Attribution 4.0 International License (https://creativecommons.org/licenses/by/4.0/), which permits unrestricted use, sharing, adaptation, distribution and reproduction in any medium or format, for any purpose, even commercially, as long as you give appropriate credit to the original author(s) and the source, provide a link to the Creative Commons license, and indicate if changes were made.

View: 523
Download: 23
Times Cited: 0
Huiling Huang ... Dongsheng Li
Huiling Huang ... Dongsheng Li
Dorothy E. Vatner ... Stephen F. Vatner
Maria-Kalliopi Spanorriga ... Konstantinos Tsioufis
