Original Article


Affiliation:
Department of Environmental Management and Toxicology, Faculty of Life Sciences, University of Benin, Benin City P.O. BOX. 30001, Nigeria
Email: frank.eghomwanre@uniben.edu
ORCID: https://orcid.org/0000-0002-1173-7281


 ,
,
Affiliation:
Department of Environmental Management and Toxicology, Faculty of Life Sciences, University of Benin, Benin City P.O. BOX. 30001, Nigeria
ORCID: https://orcid.org/0009-0006-3255-5088
Explor Asthma Allergy. 2026;4:1009129 DOI: https://doi.org/10.37349/eaa.2026.1009129
Received: April 05, 2026 Accepted: April 29, 2026 Published: July 07, 2026
Academic Editor: Vincenzo Patella, Federico II University of Naples, Italy, Civil Hospital of S. Maria della Speranza, Italy
The article belongs to the special issue Environment, Infectious Diseases, and Allergy
Aim: Indoor air quality (IAQ) is a critical component of occupational health in hospitals, where healthcare workers face exposure to particulates and clinical chemical vapours. Prolonged exposure to these environments is linked to an increased incidence of chronic respiratory conditions. This study aimed to quantify the indoor concentrations of particulate matter (PM2.5 and PM10), formaldehyde (HCHO), and total volatile organic compounds (TVOCs) in public and private tertiary healthcare facilities in Benin City, Nigeria, and to evaluate the associated non−carcinogenic and carcinogenic health risks for personnel.
Methods: IAQ was monitored in triplicate at high-occupancy sampling points over an eight-week period using handheld digital monitors. Health risks were assessed using hazard quotient (HQ) and incremental lifetime cancer risk (ILCR) models. Additionally, a structured questionnaire was administered to 152 hospital workers to correlate environmental data with self-reported respiratory symptoms.
Results: The PM2.5 and TVOC levels frequently exceeded the WHO guidelines in both facilities. The private facility exhibited alarming HCHO concentrations, particularly in the emergency (HQ = 10.04) and laboratory (HQ = 8.86) units, indicating risks up to ten times the safety threshold. Similarly, the ILCR exceeded the 1.0 × 10⁻⁴ threshold at the highest exposure site, reaching a peak of 1.49 × 10⁻⁴. Coughing (78.3%) was the most prevalent symptom. Notably, compared with workers in the private sector, workers in public hospitals faced significantly greater respiratory burdens, with an adjusted odds ratio (AOR) of 3.009 (95% CI: 1.277–7.088) for persistent cough and an AOR of 2.681 (95% CI: 1.093–6.578) for chest pain.
Conclusions: Hospital indoor air poses severe toxicological and carcinogenic risks. Immediate implementation of advanced mechanical ventilation and specialized filtration is needed to safeguard healthcare personnel.
Hospitals are critical institutions within the healthcare delivery system and provide medical treatment, diagnostic services, and emergency care to diverse populations. These facilities are designed to support life-saving interventions and the treatment of acute and chronic illnesses. However, hospitals are not only places of healing; they are also complex indoor environments where numerous processes, chemical agents, and anthropogenic activities converge, making them susceptible to environmental health risks, particularly those related to air quality [1]. Indoor air quality (IAQ) refers to the condition of the air within and around buildings, particularly as it relates to the health and comfort of occupants. In hospitals, IAQ is a critical element of occupational health, particularly for healthcare workers who spend prolonged periods within enclosed spaces that may concentrate pollutants [2]. Unlike other occupational settings, the hospital environment presents a unique combination of traditional particulates and complex clinical chemical exposures [3]. Hospital workers, including doctors, nurses, cleaners, laboratory staff, and administrative personnel, are continually exposed to indoor pollutants throughout their shifts. Owing to the nature of their work, many healthcare workers spend more than eight hours per day indoors, where pollutants may be recirculated or inadequately filtered. These prolonged and repeated exposures increase the risk of developing respiratory and allergic conditions; notably, recent studies have reported significant associations between occupational disinfectant exposure and increased asthma prevalence among healthcare professionals [4, 5]. Furthermore, poor IAQ has been linked to cardiovascular issues, systemic inflammation, and long-term complications such as cancer [6]. In recent years, increasing attention has been given to airborne pollutants such as volatile organic compounds (VOCs), formaldehyde (HCHO), particulate matter (PM2.5 and PM10), and carbon dioxide (CO2) in hospitals owing to their potential to cause both acute and chronic health effects [6]. Studies in various healthcare environments have identified sources of these pollutants as infiltration of outdoor air, combustion such as generators, sterilization practices, and cleaning agents. The accumulation of these pollutants in poorly ventilated spaces poses significant occupational hazards [7]. The physiological consequences of exposure are severe. Inhalation and dermal exposure to indoor air pollutants can cause respiratory distress, ranging from chronic cough to bronchial irritation [8]. Specifically, fine particulate matter (PM2.5) can penetrate deep into alveolar spaces and enter the bloodstream, triggering systemic inflammation and increasing cardiovascular risk [9]. At the molecular level, chronic exposure to environmental triggers—such as house dust mites or allergens exacerbated by poor IAQ—can activate complex signalling pathways such as the TNFSF11/TNFRSF11A axis, which amplifies airway remodelling by increasing TGFβ1/STAT3 activity [10]. Furthermore, structural proteins such as Syndecan-1 and signalling axes such as TL1A/DR3 have been shown to augment epithelial-mesenchymal transformation (EMT) and TGFβ1/Smad3 signalling in asthma models, providing a mechanistic link between prolonged pollutant inhalation and permanent structural changes in the lungs [11, 12]. In such settings, CO2 accumulation serves as a primary indicator of ventilation failure and inadequate fresh air exchange [13]. Furthermore, HCHO and specific VOCs are classified as known or possible carcinogens by the IARC [14, 15], necessitating an integrated risk assessment approach that considers multiple exposure pathways [15]. To mitigate these risks, international bodies such as the World Health Organization (WHO) and the U.S. Environmental Protection Agency (U.S. EPA) have established guidelines for acceptable indoor air pollutant levels [16]. Despite international recommendations, most hospitals in Nigeria lack the necessary infrastructure and policy frameworks to implement air quality measures effectively [17, 18]. This systemic absence of structured IAQ management systems leaves healthcare workers vulnerable to chronic, cumulative exposure [19]. Furthermore, while the burden of respiratory diseases continues to increase, significant data gaps persist in Nigerian air pollution monitoring because of localized infrastructural challenges [18], necessitating rigorous, site-specific assessments within tertiary healthcare facilities to safeguard occupational health. Given the essential role of healthcare workers, there is a pressing need to move beyond simple pollutant monitoring toward an integrated health risk assessment (HRA). This study aims to quantify the concentrations of PM, CO2, HCHO, and total VOCs (TVOCs) and apply toxicological models—specifically, the hazard quotient (HQ) and incremental lifetime cancer risk (ILCR), as defined by established inhalation risk guidance [16]—to evaluate the safety of the work environment. By comparing public and private tertiary facilities, this research addresses a critical gap in Nigerian occupational health, providing a scientific basis for policy-driven interventions to safeguard the health of those who provide care.
This study was conducted in Benin City, the administrative capital of Edo State, which is situated within the South‒South geopolitical zone of Nigeria. The city occupies a strategic geographical position, roughly defined by coordinates of 6°20′N latitude and 5°37′E longitude, with a mean elevation of approximately 80 m above sea level. As a primary urban hub, Benin City has experienced rapid urbanization and population growth, with current estimates exceeding 1.7 million residents [20]. This high population density necessitates a robust healthcare infrastructure; however, the city’s medical institutions face unique environmental challenges.
The degradation of IAQ within these healthcare settings is driven primarily by a combination of infrastructural, operational, and energy-related factors. The sampling environment is defined by specific architectural and operational constraints, including restricted ventilation systems and a heavy reliance on diesel-powered energy sources. These factors, in addition to high patient turnover and overcrowding, were identified as the primary IAQ stressors during the site characterization phase of this study.
To ensure a representative assessment of the city’s healthcare environment, sampling was conducted at two major facilities representing different administrative and operational structures: a public tertiary institution and a private multispecialty hospital. The public health care institution was established in 1973. It is located along the Ugbowo-Lagos Road in the Uselu district. As one of the largest teaching hospitals in Nigeria, it maintains a capacity of approximately 900 inpatient beds and houses numerous specialized clinical departments. Its sprawling complex provides a diverse environment for assessing pollutant variations in a high-volume, public-sector setting. The private health care institution is a multispecialty healthcare facility founded in 1989. It is situated at Giwa-Amu, off Airport Road. The hospital provides a wide array of specialized services, including Paediatrics, Obstetrics and Gynaecology, and General Surgery. Its inclusion in the study allows for a comparative analysis of IAQ between public-access and private-sector healthcare management models.
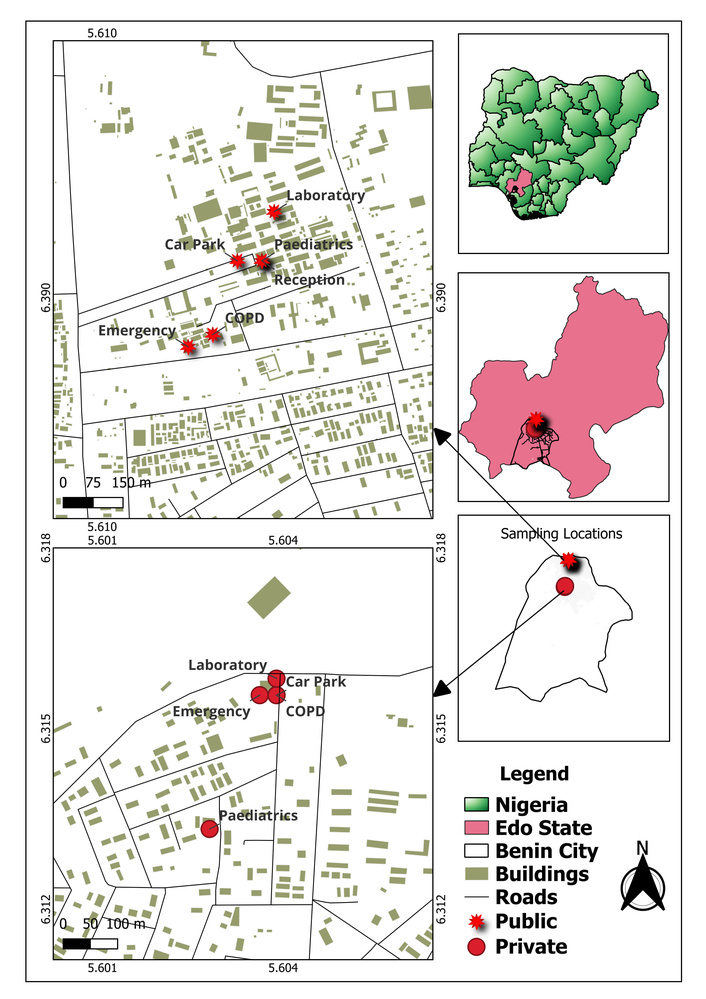
The sampling points were selected on the basis of high occupancy levels, exposure duration, and the presence of localized emission sources. The precise locations of these points were mapped using GPS for spatial accuracy. Sampling points were selected across the following functional areas: emergency wards (EM), antenatal wards (AT), pediatric wards (PE), reception areas (RE), outpatient departments (CO), central laboratories (LB), and car parks (CP) (Figure 1). The selection utilized a randomized approach within these high-occupancy zones to ensure that the data captured reflected the diverse air pollutant profiles typical of a tropical urban clinical environment.
To capture the most representative data regarding human exposure, the sampling campaign was conducted over an eight-week period, spanning from July to September 2025. This timeframe coincides with the peak of the rainy season in Benin City. Sampling occurred on a weekly basis, specifically during peak operational hours (08:00 to 16:00), when patient turnover and clinical activities were at their highest levels. The concentrations of airborne pollutants were quantified using specialized handheld digital monitors, specifically the BR-Smart-126 series for particulate matter and organic vapours. Prior to each monitoring session, the sensors were zeroed in outdoor air away from immediate local sources to establish a baseline and ensure the reliability of subsequent measurements. BR-Smart-126 uses laser scattering sensors to measure PM2.5 and PM10 concentrations within a range of 0–999 μg/m3 (±10% precision), as well as electrochemical and semiconductor sensors for HCHO and TVOCs, both of which feature a resolution of 0.001 µg/m3. To ensure that the data accurately reflected the breathing zone of both healthcare personnel and patients, all the instruments were mounted on stable platforms at a standardized height of 1.5 m above ground level, strategically positioned away from immediate obstructions or direct expiratory breath exhaust. To maintain statistical rigor and account for transient fluctuations, readings at each sampling point were taken in triplicate. The resulting mean concentrations were subsequently calculated and benchmarked against the WHO 24-hour air quality guidelines [6] to determine the level of environmental risk.
To evaluate the potential health impacts of chronic exposure to indoor air pollutants (PM2.5, PM10, and HCHO) on hospital staff and patients, a standard HHRA was performed. The assessment followed the framework established by the U.S. EPA [21], focusing on both non-carcinogenic and carcinogenic risks.
The average daily EC for each pollutant was calculated to determine the dose inhaled by individuals within the hospital microenvironments. The calculation used the following formula:
where:
C: average concentration of the pollutant (μg/m3).
ET: exposure time (hours/day).
EF: exposure frequency (days/year).
ED: exposure duration (years).
AT: averaging time (hours).
For hospital staff, exposure factors were adopted from the U.S. EPA [21], with an 8-hour shift and a 25-year career duration assumed.
The non-carcinogenic health risk for particulate matter and HCHO was determined using the HQ. This is the ratio of the EC to the reference concentration (RfC), which represents the level below which no adverse health effects are expected [22].
According to [23] an HQ > 1 indicates the potential for adverse non-carcinogenic health effects, whereas an HQ < 1 suggests that the risk is negligible. For PM2.5 and PM10, the mean concentrations were also compared against the WHO Global Air Quality Guidelines [6] to assess the degree of exceedance and associated respiratory risks.
HCHO is classified as a known human carcinogen (Group 1) by the IARC. The lifetime cancer risk (LCR) associated with HCHO inhalation was estimated by multiplying the EC by the inhalation unit risk (IUR) factor [23, 24].
The IUR values were sourced from the IRIS Toxicological Review of Formaldehyde [25]. The calculated risk was interpreted on the basis of the following threshold: LCR < 1 × 10⁻⁶: negligible risk. 1 × 10⁻⁶ to 1 × 10⁻⁴: acceptable/tolerant range. LCR > 1 × 10⁻⁴: Unacceptable risk, requiring immediate mitigation [23, 24].
To assess the relationship between environmental air quality and human health, a modified, well-structured, self-administered questionnaire was deployed among hospital personnel. The instrument was designed to capture a comprehensive profile of the study population and was categorized into four distinct modules: demographic profile, occupational exposure and risk factors, respiratory health symptoms and awareness and institutional control measures.
Participants were eligible for the study if they met the following requirements:
Full-time staff members (clinical or non-clinical) were officially deployed to the selected wards for at least six months.
Staff members who were present and active in the facility during the eight-week air quality monitoring period.
Individuals who voluntarily agreed to participate and signed the informed consent form.
Participants were excluded from the study if they met any of the following criteria:
Newly posted staff or interns with less than three months of exposure in the specific facility were consulted to ensure that the reported symptoms were related to the current environment.
Individuals with a self-reported history of heavy tobacco smoking (to avoid confusion between “smoker’s cough” and pollutant-induced irritation).
Individuals with pre-existing chronic pulmonary diseases (such as chronic obstructive pulmonary disease or pre-occupational asthma) or those on immunosuppressive medications were excluded to ensure the integrity of the occupational exposure analysis.
Visiting consultants or outside contractors who do not spend a continuous 6–8-hour shift within the hospital’s indoor microenvironment.
More than 20% of the questionnaires had missing data or contradictory responses.
The target population for this study comprised hospital personnel working across various clinical and administrative departments in the two selected healthcare facilities in Benin City. The total accessible population was identified as comprising 246 staff members (164 from the public healthcare facility and 82 from the private hospital). To ensure that the study was adequately powered while maintaining statistical precision, the sample size was determined using the Yamane formula [26]:
where: n = required sample size; N = total population (246); e = margin of error (0.05 or 5%).
On the basis of this calculation, the minimum required sample size was determined to be 152 respondents.
A stratified random sampling technique was employed to ensure a representative and proportional selection of participants from both the public and private sectors. The two hospitals were treated as distinct strata to account for differences in staff density and institutional characteristics. Proportional allocation was used to distribute the calculated sample size (n = 152) across the two strata, ensuring that each hospital’s contribution to the final sample was reflective of its total population size.
A pilot study (pre-testing) was conducted among a representative sub-sample of hospital workers to ensure the clarity of the questions and the ease of completion before full-scale administration. The reliability of the structured questionnaire was established through measures of internal consistency. While standardized protocols were strictly followed during data collection to minimize bias, the instrument’s internal reliability was statistically verified using Cronbach’s alpha coefficient [27]. The analysis yielded a Cronbach’s alpha value of 0.87, which exceeded the recommended threshold of 0.70.
Data were managed and analysed using IBM SPSS Statistics for Windows, version 22.0. The air quality measurements (pollutant concentrations) were summarized using means and standard deviations. Demographic and awareness data from the questionnaires are expressed as frequencies and percentages. Variations in air pollutant concentrations across different hospital wards and between public and private facilities were determined using ANOVA. The chi-square (χ2) test of independence was employed to compare the prevalence of respiratory symptoms and awareness levels between the two hospital types. Furthermore, a binary logistic regression model was used to determine the odds ratios (ORs) for reported respiratory symptoms between the hospitals after adjusting for cofounders such as age, sex, level of education, smoking status, history of respiratory symptoms and duration of work hours. For all the statistical tests, a two-tailed p value < 0.05 was established as the criterion for statistical significance.
The mean concentrations of indoor air pollutants across various departments in private hospitals are summarized in Table 1, with the corresponding spatial analysis results shown in Table S1. During the morning session, the PM2.5 concentrations remained relatively uniform across departments (p = 0.262), ranging from 13.3 ± 0.7 µg/m3 in the PE to 15.3 ± 0.6 µg/m3 in the CP. However, highly significant spatial variation was observed in the afternoon (p = 0.005), driven primarily by a sharp spike in the AT (56.3 ± 24.1 µg/m3), which significantly exceeded the WHO threshold of 15 µg/m3. Similarly, afternoon PM10 levels significantly differed spatially (p = 0.004), peaking at 74.0 ± 27.7 µg/m3 in the AT. The HCHO concentration exhibited the highest degree of spatial variability in both the morning (p = 0.001) and the afternoon (p = 0.001). The morning levels of the EM (141.7 ± 13.3 µg/m3) and LB (125.1 ± 18.3 µg/m3) were significantly higher than those of other departments and above the WHO limit (100 µg/m3).
Mean concentrations of indoor air pollutants in private hospitals.
| Points | PM2.5 (µg/m3) | PM10 (µg/m3) | HCHO (µg/m3) | TVOC (µg/m3) | ||||
|---|---|---|---|---|---|---|---|---|
| M | A | M | A | M | A | M | A | |
| EM | 15.0 ± 0.4a | 12.7 ± 0.5a | 26.4 ± 0.7b | 23.6 ± 0.7a | 141.7 ± 13.3b | 14.3 ± 1.5a | 2,364.3 ± 488.6a | 1,361.4 ± 438.7a |
| AT | 14.1 ± 0.5a | 56.3 ± 24.1b | 26.3 ± 0.5b | 74.0 ± 27.7b | 105.4 ± 31.0a | 47.6 ± 13.7a | 1,798.3 ± 442.4a | 1,516.6 ± 448.7a |
| PE | 13.3 ± 0.7a | 12.3 ± 0.6a | 24.0 ± 1.2ab | 23.6 ± 1.2a | 10.0 ± 2.0a | 10.8 ± 1.5a | 3,004.8 ± 453.4a | 2,263.6 ± 412.1a |
| RE | 14.1 ± 0.7a | 13.0 ± 0.5a | 23.4 ± 0.8a | 22.9 ± 0.8a | 113.1 ± 38.1a | 59.1 ± 17.9a | 1,937.8 ± 417.4a | 1,594.7 ± 445.0a |
| CP | 15.3 ± 0.6a | 12.3 ± 0.5a | 23.9 ± 0.8ab | 21.8 ± 0.7a | 15.6 ± 5.3a | 61.7 ± 20.4a | 2,015.1 ± 379.4a | 1,132.5 ± 299.7a |
| CO | 15.0 ± 0.7a | 12.8 ± 0.5a | 25.6 ± 0.8ab | 23.5 ± 0.8a | 65.9 ± 10.5a | 56.0 ± 15.2a | 1,857.4 ± 352.8a | 1,880.6 ± 185.0a |
| LB | 14.2 ± 0.6a | 13.5 ± 0.5a | 26.1 ± 1.0b | 27.2 ± 1.3a | 125.1 ± 18.3c | 105.2 ± 6.9b | 2,005.8 ± 299.7a | 954.3 ± 126.3a |
| WHO Std | 15 | 45 | 100 | 300 | ||||
Mean ± standard error (X ± SE). M: morning session; A: afternoon session; EM: emergency wards; AT: antenatal wards; PE: pediatric wards; RE: reception areas; CP: car parks; CO: outpatient departments; LB: central laboratories. Means followed by different superscript letters within the same column are significantly different at p < 0.05 according to Duncan’s Multiple Range Test.
While TVOCs were excessively high across all the sampled points, with values exceeding the 300 µg/m3 limit by nearly ten-fold in some wards, the statistical results confirmed that concentrations did not vary significantly by location during either diurnal period (p > 0.05), with values exceeding the 300 µg/m3 limit by nearly ten-fold in some wards.
Table 2 presents the indoor air pollutant profile for the public hospital. The morning concentrations of PM2.5 were consistently higher than the WHO standards across all departments, and the ANOVA results (Table S1) indicated no significant spatial difference during this period (p = 0.677), suggesting a uniform pollutant load. However, significant spatial variation emerged in the afternoon (p = 0.0024) with the EM (13.8 ± 0.6 µg/m3) and CO (14.7 ± 1.1 µg/m3) maintaining higher levels than the others did. PM10 followed a similar trend, with significant spatial differences occurring only in the afternoon (p = 0.005). In contrast to those in private facilities, the HCHO levels in public hospitals were generally lower and compliant with the WHO standards, yet they exhibited significant spatial heterogeneity (p = 0.001). The highest morning concentration occurred in the CO (46.8 ± 10.9 µg/m3). TVOC levels mirrored the extreme elevations seen in the private facility, with highly significant spatial variation both in the morning (p = 0.002) and in the afternoon (p = 0.001). In the AT, the highest morning TVOC concentration (3,769.9 ± 490.3 µg/m3) was recorded, whereas in the EM, it peaked during the afternoon (3,689.5 ± 405.1 µg/m3).
Mean concentrations of indoor air pollutants in public hospitals.
| Points | PM2.5 (µg/m3) | PM10 (µg/m3) | HCHO (µg/m3) | TVOC (µg/m3) | ||||
|---|---|---|---|---|---|---|---|---|
| M | A | M | A | M | A | M | A | |
| EM | 20.3 ± 0.9a | 13.8 ± 0.6ab | 36.3 ± 2.2a | 22.8 ± 0.7a | 27.3 ± 6.9b | 4.0 ± 0.4a | 1,696.3 ± 471.7a | 3,689.5 ± 405.1b |
| AT | 18.5 ± 1.1a | 11.8 ± 0.4a | 34.1±2.2a | 23.8 ± 0.9a | 12.6 ± 1.7ab | 8.6 ± 1.1ab | 3,769.9 ± 490.3c | 1,800.4 ± 391.7a |
| PE | 19.8 ± 0.9a | 12.8 ± 0.4ab | 35.1 ±1.8a | 24.1 ± 1.1a | 18.3 ± 3.0ab | 22.4 ± 7.2c | 3,107.3 ± 598.1bc | 1,331.5 ± 226.1a |
| RE | 18.0 ± 1.3a | 12.0 ± 0.5a | 30.3 ± 2.5a | 21.7 ± 0.8a | 7.8 ± 1.0a | 6.3 ± 1.0ab | 2,315.3 ± 476.0ab | 1,591.4 ± 281.0a |
| CP | 19.0 ± 1.0a | 13.8 ± 0.7ab | 31.1 ± 1.7a | 23.8 ± 0.8a | 6.9 ± 0.8a | 4.5 ± 0.5a | 1,615.9 ± 340.9a | 2,103.2 ± 467.7a |
| CO | 19.9 ± 0.9a | 14.7 ± 1.1b | 34.5 ± 2.0a | 28.5 ± 2.2b | 46.8 ± 10.9c | 14.1 ± 1.6b | 1,359.6 ± 377.1a | 2,216.3 ± 384.0a |
| LB | 19.7 ± 1.1a | 12.9 ± 0.7ab | 36.5 ± 3.0a | 24.1 ± 1.1a | 15.5 ± 1.5ab | 6.5 ± 1.3ab | 1,921.1 ± 375.2ab | 1,325.9 ± 406.0a |
| WHO Std | 15 | 45 | 100 | 300 | ||||
Mean ± standard error (X ± SE), M: morning session; A: afternoon session; EM: emergency wards; AT: antenatal wards; PE: pediatric wards; RE: reception areas; CP: car parks; CO: outpatient departments; LB: central laboratories. Means followed by different superscript letters within the same column are significantly different at p < 0.05 according to Duncan’s Multiple Range Test.
The results of the paired t test comparing morning (M) and afternoon (A) sessions for both healthcare facilities are presented in Table 3. In the public hospital, significant diurnal variations were observed for particulate matter and HCHO (p < 0.05). Specifically, the mean reductions in PM2.5 and PM10 were 6.19 µg/m3 (t = 19.78) and 9.89 µg/m3 (t = 13.06), respectively, in the afternoon. The HCHO concentration in the public facility also decreased significantly, by a mean of 9.83 µg/m3 in the afternoon (p = 0.001). However, the variations in TVOC in the public facility were not statistically significant (p > 0.05). In the private hospital, the diurnal trend differed notably. PM2.5 and PM10 levels did not significantly differ between the morning and afternoon (p > 0.05). Like those in the public facility, the HCHO concentrations in the private hospital were significantly higher in the morning than in the afternoon (p = 0.001). TVOC variations remained statistically insignificant across both diurnal periods in the private facility (p = 0.329).
Diurnal variation in the IAQ parameters.
| Pair | Parameter(M vs. A) | Mean Diff.(µg/m3) | Std. Dev.(µg/m3) | t value | df | Sig. (2-tailed) |
|---|---|---|---|---|---|---|
| Public hospital | PM2.5 | 6.19 | 4.06 | 19.78 | 167 | 0.001* |
| PM10 | 9.89 | 9.81 | 13.06 | 167 | 0.0001* | |
| HCHO | 9.83 | 30.72 | 4.15 | 167 | 0.001* | |
| TVOC | 246.77 | 3,622.51 | 0.88 | 167 | 0.379 | |
| Private hospital | PM2.5 | –4.58 | 46.36 | –1.28 | 167 | 0.202 |
| PM10 | –5.84 | 53.31 | –1.42 | 167 | 0.158 | |
| HCHO | 42.90 | 45.20 | 3.85 | 167 | 0.001* | |
| TVOC | –259.34 | 344.1 | –0.98 | 167 | 0.329 |
* (p < 0.05): Indicates a difference between the two hospitals is statistically significant at the 95% confidence level.
The independent t test results for comparisons of the air quality parameters between the two hospital types are shown in Table 4. During the morning sessions, significant differences were observed across nearly all the parameters. Compared with private hospitals, public hospitals recorded significantly higher morning concentrations of PM2.5 (t = 11.64; p = 0.001 and PM10 (t = 10.09; p = 0.001). Conversely, the private hospital exhibited significantly higher morning levels of HCHO (mean Diff. = –66.5 µg/m3; p = 0.001). In the afternoon, the significant difference in particulate matter (PM2.5 and PM10) between the two hospitals disappeared (p > 0.10). However, compared with public facilities, private hospitals continued to have significantly higher levels of HCHO (p = 0.001). Interestingly, there were no statistically significant differences in TVOC concentrations between the public and private facilities during either the morning (p = 0.577) or afternoon (p = 0.327) sessions, suggesting that both facilities faced similarly high organic vapour loads.
Comparison of IAQ parameters in public and private hospital facilities.
| Public vs. Private | Mean Diff. (µg/m3) | t value | Sig. (2-tailed) |
|---|---|---|---|
| PM2.5m | 4.88 | 11.64 | 0.001* |
| PM2.5a | –5.89 | –1.63 | 0.106 |
| PM10m | 8.89 | 10.09 | 0.001* |
| PM10a | –6.83 | –1.65 | 0.101 |
| HCHOm | –66.5 | –4.12 | 0.001* |
| HCHOa | –48.4 | –3.95 | 0.001* |
| TVOCm | 114.6 | 0.56 | 0.577 |
| TVOCa | –2,611.5 | –0.98 | 0.327 |
* (p < 0.05): Indicates that the difference between the two hospitals is statistically significant at the 95% confidence level.
The ambient meteorological conditions (temperature and relative humidity (RH)) across all the sampling points are detailed in Table S2. Statistical analysis revealed that these factors significantly influenced the IAQ dynamics. Specifically, morning RH was significantly positively correlated with (PM10, r = 0.481, p < 0.001), while afternoon RH demonstrated a significant positive correlation with morning HCHO levels (r = 0.414, p < 0.001), as detailed in Table 5.
Significant Pearson Correlations between meteorological factors and IAQ parameters.
| Variable 1 | Variable 2 | Pearson Correlation (r) | Sig.(2-tailed) |
|---|---|---|---|
| mP_Temp | mP_PM10 | −0.560** | < 0.001 |
| mP_Temp | mP_PM2.5 | −0.494** | < 0.001 |
| mP_RH | mP_PM10 | 0.481** | < 0.001 |
| mP_RH | mP_PM2.5 | 0.455** | < 0.001 |
| aP_RH | aP_PM10 | 0.456** | < 0.001 |
| mP_Temp | mP_HCHO | 0.336** | < 0.001 |
| aP_Temp | aP_HCHO | −0.268** | < 0.001 |
| mPr_Temp | mPr_PM10 | 0.236** | 0.002 |
| aP_RH | mP_HCHO | 0.414** | < 0.001 |
m: morning; a: afternoon; P_: public facility; Pr_: private facility. ** Correlation is significant at the 0.01 level (2-tailed).
The results of the non-carcinogenic risk (HQ) and LCR are summarized in Figures 2 and 3, respectively. In accordance with the U.S. EPA criteria, an HQ > 1.0 indicates a threshold at which adverse non-carcinogenic health effects, including respiratory irritation and airway hypersensitivity, are likely to occur. A cancer risk (CR) > 1.0 × 10⁻⁴ represents a carcinogenic risk exceeding the acceptable safety range. In the private facility (Figure 2), particulate matter (PM2.5 and PM10) maintained an HQ < 1.0 across all wards and sessions. In contrast, HCHO presented a critical health risk profile. During the morning session, the HCHO HQ values were significantly > 1.0 at 85.7% of the sampled points. The most alarming risks were observed in the EM (HQ = 10.04), LB (HQ = 8.86), and RE (HQ = 8.01), indicating exposure levels eight to ten times higher than the safety limit. The LCR for HCHO in private hospitals mirrored these findings. Most wards recorded a CR > 1.0 × 10⁻⁴, with the EM (4.52 × 10⁻⁴) and LB (3.99 × 10⁻⁴) having the highest values. Notably, the individual peak ILCR reached a maximum value of 1.49 × 10⁻⁴ at the highest exposure point during worst-case peak tracking within the private facility’s EM. Compared with the private facility, the public facility (Figure 3) presented slightly higher particulate HQs, although all remained within safe limits (HQ < 0.30). The HCHO risk profile was more localized but still clinically significant. The number of morning sessions in the CO (HQ = 3.32), EM (HQ = 1.94), and PE (HQ = 1.30) exceeded the unity threshold (HQ > 1.0), suggesting the potential for acute respiratory distress and allergic triggers in these environments. In terms of carcinogenic risk, public hospitals were generally safer than private facilities, with most CR values falling within the target safety range (< 1.0 × 10⁻⁴).
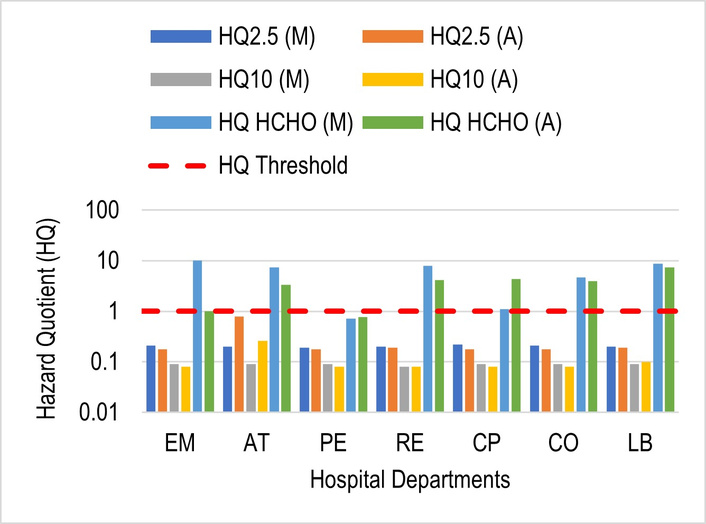
HQ risk across private hospital wards. M: morning; A: afternoon; EM: emergency wards; AT: antenatal wards; PE: pediatric wards; RE: reception areas; CP: car parks; CO: outpatient departments; LB: central laboratories.
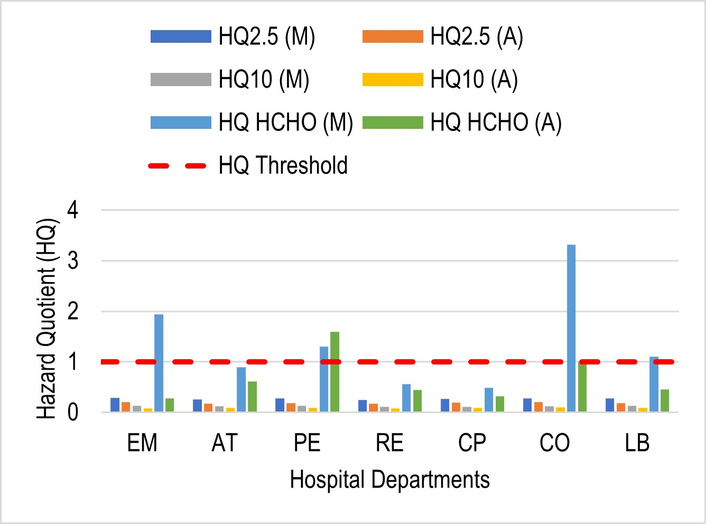
HQ risk across public hospital wards. M: morning; A: afternoon; EM: emergency wards; AT: antenatal wards; PE: pediatric wards; RE: reception areas; CP: car parks; CO: outpatient departments; LB: central laboratories.
The sociodemographic profile of the hospital workers (N = 152) is detailed in Table 6. The study population was predominantly female (62.5%), with a higher concentration of female workers in both the public (60.4%) and private (66.7%) sectors. Statistical analysis revealed no significant difference in sex distribution between the two facilities (p = 0.451). The age distribution was similarly comparable across both hospitals (p = 0.318), with the largest cohort being those aged 18–30 years (39.5%), followed by the 31–40 years group (26.3%). Only a small fraction of the workforce (5.3%) was older than 50 years. Educational attainment was remarkably high, with 88.8% of all respondents possessing tertiary-level education, and no significant variation was observed between the public and private sectors (p = 0.074). Educational attainment was remarkably high, with 88.8% of all respondents possessing tertiary-level education, and no significant variation was observed between the public and private sectors (p = 0.074). A significant disparity was, however, observed regarding occupational role (p = 0.011). Compared with public hospitals, private hospitals had a significantly higher proportion of clinical staff Doctors/Nurses (37.3% in private vs. 21.8% in public). Conversely, public hospitals were characterized by a higher percentage of laboratory personnel (37.6%) and maintenance/security staff (15.8%).
Sociodemographic comparison between hospital workers.
| Variables | Public hospital (n = 101)Frequency (%) | Private hospital (n = 51)Frequency (%) | Total (N = 152)Frequency (%) | p value |
|---|---|---|---|---|
| Age | 0.318 | |||
| < 18 yrs | 17 (16.8) | 11 (21.6) | 28 (18.4) | |
| 18–30 yrs | 43 (42.6) | 17 (33.3) | 60 (39.5) | |
| 31–40 yrs | 26 (25.7) | 14 (27.5) | 40 (26.3) | |
| 41–50 yrs | 12 (11.9) | 4 (7.8) | 16 (10.5) | |
| > 50 yrs | 3 (3.0) | 5 (9.8) | 8 (5.3) | |
| Gender | 0.451 | |||
| Male | 40 (39.6) | 17 (33.3) | 57 (37.5) | |
| Female | 61 (60.4) | 34 (66.7) | 95 (62.5) | |
| Level of education | 0.074 | |||
| Primary | 0 (0.0) | 2 (3.9) | 2 (1.3) | |
| Secondary | 12 (11.9) | 3 (5.9) | 15 (9.9) | |
| Tertiary | 89 (88.1) | 46 (90.2) | 135 (88.8) | |
| Type of role | 0.011* | |||
| Doctor/Nurse | 22 (21.8) | 19 (37.3) | 41 (27.0) | |
| Laboratory/X-ray | 38 (37.6) | 9 (17.6) | 47 (30.9) | |
| Pharmacist | 12 (11.9) | 6 (11.8) | 18 (11.8) | |
| Cleaner | 6 (5.9) | 4 (7.8) | 10 (6.6) | |
| Patient care | 10 (9.9) | 1 (2.0) | 11 (7.2) | |
| Maintenance/Security | 16 (15.8) | 4 (7.8) | 20 (13.2) | |
| Catering services | 6 (5.9) | 6 (11.8) | 12 (7.9) |
* Significant at p < 0.05.
A comparative analysis of self-reported health effects among public and private hospital workers is summarized in Table 7. The results indicate a high baseline prevalence of respiratory irritation across the entire study population (N = 152). Coughing was the most frequently reported symptom, affecting 78.3% of the total workforce. A highly significant difference was observed between facilities (p = 0.004); workers in the public hospital reported a substantially higher prevalence of persistent cough (85.1%) than their counterparts in the private hospital did (64.7%). Similarly, chest pain was significantly different (p = 0.016), with 36.6% of public hospital workers reporting symptoms compared with only 17.6% in private facilities. This suggests a higher burden of thoracic discomfort among personnel in the public sector. While irritation (eyes/skin) was higher in public hospitals (32.7%) than in private hospitals (25.5%), this difference did not reach statistical significance (p = 0.363). Other allergic and asthma indicators were prevalent but did not significantly differ between the two hospital types: sneezing (65.1%, p = 0.536), wheezing (33.6%, p = 0.091), and breathlessness (22.4%, p = 0.752).
Comparison of reported health effects among workers between hospitals.
| Variables | Public hospital (n = 101)Frequency (%) | Private hospital (n = 51)Frequency (%) | Total frequency (%) (N = 152) | p value |
|---|---|---|---|---|
| Cough | 0.004* | |||
| No | 15 (14.9) | 18 (35.3) | 33 (21.7) | |
| Yes | 86 (85.1) | 33 (64.7) | 119 (78.3) | |
| Chest pain | 0.016* | |||
| No | 64 (63.4) | 42 (82.4) | 106 (69.7) | |
| Yes | 37 (36.6) | 9 (17.6) | 46 (30.3) | |
| Irritation (eyes/skin) | 0.363 | |||
| No | 68 (67.3) | 38 (74.5) | 106 (69.7) | |
| Yes | 33 (32.7) | 13 (25.5) | 46 (30.3) | |
| Wheezing | 0.091 | |||
| No | 66 (65.3) | 35 (68.6) | 101 (66.4) | |
| Yes | 35 (34.7) | 16 (31.4) | 51 (33.6) | |
| Sneezing | 0.536 | |||
| No | 33 (32.7) | 20 (39.2) | 53 (34.9) | |
| Yes | 68 (67.3) | 31 (60.8) | 99 (65.1) | |
| Breathlessness | 0.752 | |||
| No | 78 (77.2) | 40 (78.4) | 118 (77.6) | |
| Yes | 23 (22.8) | 11 (21.6) | 34 (22.4) |
* Significant at p < 0.05.
The prevalence of self-reported health symptoms among the various occupational groups is summarized in Table 8. Overall, a high burden of respiratory symptoms was observed across the entire study population (N = 152), with cough (78.3%) and sneezing (65.1%) being the most frequently reported complaints. Subgroup analysis revealed that cleaning staff experienced the highest relative prevalence of several critical symptoms. Specifically, 100% of the cleaners reported experiencing a cough, 90% reported sneezing, and 70% reported chest pain. Although the Pearson chi-square test for chest pain did not reach the traditional threshold for statistical significance (p = 0.105), the high absolute percentage among cleaners suggests a clinically relevant occupational risk. Eye and skin irritation trends toward statistical significance (χ2=11.623; p = 0.071), with the highest rates reported by cleaners (50%) and catering staff (50%) compared with a remarkably low rate among maintenance/work personnel (4.8%). Other symptoms, such as wheezing and shortness of breath, were distributed more evenly across the roles, although catering staff reported the highest frequency of wheezing (66.7%).
Prevalence of reported health symptoms across hospital work roles (N = 152).
| Symptoms (Reported “Yes”) | Doc/Nurse n (%) | Lab Sci. n (%) | Pharm.n (%) | Cleanern (%) | Maint.n (%) | Cateringn (%) | Totaln (%) | χ2 | p value |
|---|---|---|---|---|---|---|---|---|---|
| Cough | 35 (72.9) | 34 (70.8) | 15 (83.3) | 10 (100) | 19 (90.5) | 5 (83.3) | 119 (78.3) | 7.63 | 0.267 |
| Sneezing | 32 (66.7) | 28 (58.3) | 12 (66.7) | 9 (90.0) | 14 (66.7) | 4 (66.7) | 99 (65.1) | 5.664 | 0.462 |
| Wheezing | 11 (22.9) | 13 (27.1) | 7 (38.9) | 3 (30.0) | 7 (33.3) | 4 (66.7) | 46 (30.3) | 8.258 | 0.220 |
| Chest pain | 13 (27.1) | 16 (33.3) | 3 (16.7) | 7 (70.0) | 6 (28.6) | 1 (16.7) | 46 (30.3) | 10.491 | 0.105 |
| Irritation (eyes/skin) | 15 (31.3) | 18 (37.5) | 4 (22.2) | 5 (50.0) | 1 (4.8) | 3 (50.0) | 46 (30.3) | 11.623 | 0.071 |
| Shortness of breath | 9 (18.8) | 11 (22.9) | 4 (22.2) | 4 (40.0) | 5 (23.8) | 2 (33.3) | 35 (23.0) | 2.794 | 0.834 |
n represents the count of “yes” responses; (%) represents the percentage within the specific work role. The “patient” role (n = 1) is included in the total column but omitted from the subgroup columns for clarity. Doc/Nurse: doctor/nurse; Lab Sci.: laboratory scientists; Pharm.: pharmacist; Maint.: maintenance/security.
To further examine the relationship between the workplace environment and respiratory health, a logistic regression analysis was performed (Table 9). The results revealed that compared with workers in private facilities, workers in public hospitals were found to have significantly higher risks for both coughing and chest pain. According to the crude model (COR), public hospital workers were more than three times more likely to report persistent cough (COR = 3.127; 95% CI: 1.413–6.919; p = 0.005). This risk remained robust even after we adjusted for sociodemographic confounders, with an adjusted odds ratio (AOR) of 3.009 (95% CI: 1.277–7.088; p = 0.012). Similarly, the risk for chest pain was significantly higher in the public hospital environment (AOR = 2.681; 95% CI: 1.093–6.578; p = 0.031). These elevated odds ratios suggest that the higher particulate matter levels and localized HCHO “hotspots” in the public facility (as characterized in Tables 2 and 6) correlate with a significantly higher probability of adverse respiratory outcomes among the staff.
Logistic regression analysis of health effects by location.
| Outcome variable | Crude odds ratio (COR) | 95% CI for COR | p value | Adjusted odds ratio (AOR) | 95% CI for AOR | p value |
|---|---|---|---|---|---|---|
| Cough | 3.127 | [1.413–6.919] | 0.005* | 3.009 | [1.277–7.088] | 0.012* |
| Chest pain | 2.698 | [1.181–6.162] | 0.019* | 2.681 | [1.093–6.578] | 0.031* |
* Significant at p < 0.05.
Table 10 summarizes the awareness levels and perceived institutional monitoring practices among the workers (N = 152). General awareness of health effects related to air pollution was exceptionally high (94.1%) and uniform across both hospitals (p = 0.989). Similarly, almost all the respondents reported awareness of personal protective equipment (PPE) (98%). Despite this high level of general awareness, specific technical knowledge and institutional support were significantly lacking. Fewer than half of the respondents (49.3%) were aware of regulatory thresholds for indoor air pollutants. Only 9.2% of the total workforce had any knowledge of government interventions related to IAQ. A mere 20.4% of workers were aware of any ongoing air pollution monitoring within their facilities, with rates as low as 13.7% in the private hospital.
Respiratory health awareness and institutional monitoring practices.
| Variable | Public hospital (n = 101) % | Private hospital (n = 51) % | Total % (N = 152) | p value |
|---|---|---|---|---|
| Awareness of health effects | 94.1 | 94.1 | 94.1 | 0.989 |
| Knowledge of regulatory thresholds | 47.5 | 52.9 | 49.3 | 0.587 |
| PPE awareness | 99.0 | 96.1 | 98.0 | 0.214 |
| Government intervention knowledge | 8.9 | 9.8 | 9.2 | 0.858 |
| Awareness of air pollution monitoring | 23.8 | 13.7 | 20.4 | 0.147 |
* Significant at p < 0.05.
The mean indoor air pollutant concentrations recorded in this study were above the recommended level set by the WHO, with the highest levels of HCHO in the EM and LB units, as well as high particulate matter (PM) in the AT. Unlike ambient air, the increase in indoor air pollutants in the hospital environment is due to specific clinical activities—such as the release of chemical fumes from medical preservatives or the resuspension of bioaerosols in high-traffic wards [28–30]. Notably, PM2.5 concentrations have been shown to increase significantly with human presence and activity, primarily through the resuspension of deposited particles due to movement [31]. Furthermore, indoor PM2.5 levels are heavily influenced by the infiltration of outdoor pollutants, particularly from traffic sources [30, 32]. This is a critical factor for the health facilities studied, many of which were located in residential neighbourhoods near major roads or CP. The cleaning activities in the various studied wards also serve as primary sources for these chemical loads; such as alcohols in hydro-alcoholic solutions and disinfectants are widely used, which serve as a common fragrance in deodorants and cleaning agents [28, 33]. The high ambient humidity levels recorded (frequently > 70%) likely contributed to the elevated particulate matter concentrations through hygroscopic growth. This environmental synergy is critical, as both high humidity and particulate pollution are independent triggers for respiratory distress, such as shortness of breath, among hospital personnel [13]. These elevated concentrations contribute to a complex “hospital exposome,” where pollutants do not exist in isolation but rather interact synergistically. Recent studies in medical university settings have emphasized that indoor PM can act as an adjuvant, facilitating the deep penetration of chemical irritants and biological allergens into the distal airways [34].
Extreme TVOC concentrations—exceeding the recommended limits by nearly ten-fold are of significant public health concern, as hospital IAQ is inextricably linked to building design, geographic location, and operational factors [35]. These levels are potent triggers for neurogenic inflammation, which manifests clinically as chest tightness and dry cough [36]. When the levels of PM are lower than those of VOCs, particulates can act as “adjuvant” carriers for indoor allergens such as mould spores or latex dust, delivering them deeper into the bronchioles [37]. This synergy not only exacerbates asthma but also induces a state of airway hyper-responsiveness (AHR) in previously healthy individuals, characterized by the reported wheezing and breathlessness observed in the study [38]. At the molecular level, these environmental triggers—specifically, house dust and indoor allergens—can activate signalling pathways such as the TNFSF11/TNFRSF11A axis, which has been shown to amplify airway remodelling by strengthening TGFβ1/STAT3 activity [10]. Furthermore, structural proteins such as Syndecan-1 and signalling axes such as TL1A/DR3 are known to augment EMT and TGFβ1/Smad3 signalling [11, 12]. This suggests a mechanistic link between the prolonged inhalation of the hospital’s “combined chemical burden” and permanent structural changes in the lungs of healthcare personnel. These localized concentrations are likely the primary drivers of the reported cough and chest pain in this study, as HCHO and TVOCs act as potent chemical triggers for respiratory symptoms among hospital staff [39–41]. These findings are consistent with studies in urban West African clinical settings, such as research in South–South Nigeria, which reported significantly high levels of indoor air pollutants above safety standards [42]. However, they contradict findings from studies in the Global North, where PM levels are often more tightly controlled through HEPA filtration and advanced HVAC systems, which can significantly reduce indoor concentrations to within safe limits [43]. This difference likely stems from a reliance on natural ventilation and the proximity of wards to external sources such as CP in the current study area.
A critical finding of this study is the morning dominance of pollutant loads in public health facilities. While stagnant night time air and reduced air exchange contribute to initial baseline accumulation, these morning peaks are more explicitly linked to a ‘buildup effect’ driven by the onset of intensive clinical routines. Specifically, the synchronization of morning cleaning activities—often involving the aerosolization of disinfectants—and the sudden influx of patients and staff leads to the significant resuspension of settled particulate matter. This concentrated chemical and particulate loading in the early hours creates a threshold capable of inducing the reported breathlessness and wheezing [30, 34]. Conversely, the afternoon PM spike observed in the private AT suggests that human activity and ward-specific procedures—such as afternoon rounds or increased patient turnover—remain the primary drivers of particulate resuspension in those settings [25, 35].
This study reveals a critical disparity between particulate matter and chemical pollutants in an integrated HRA. The PM-related HQ remained within safe thresholds (HQ < 1.0) across both facilities. These findings are consistent with recent comprehensive PM analyses in Nigerian health centers [43]. HCHO was found to be a severe toxicological threat in the studied health facilities. In the private facility, HCHO exposure reached alarming levels, with HQ values in the EM and LB units exceeding the safety limit by eight to tenfold. In accordance with the U.S. EPA criteria, an HQ > 1.0 signifies a high probability of adverse non-carcinogenic effects, specifically respiratory irritation and airway hypersensitivity [31]. The recorded HQs of 10.04 in the private EM and 8.86 in the LB indicate that the staff are under constant toxicological stress. Recent quantitative risk assessments in healthcare facilities suggest that chronic inhalation of such compounds even at lower concentrations can lead to long-term systemic health issues [3, 44].
Furthermore, the LCR in private facilities (4.52 × 10⁻⁴) exceed the 1.0 × 10⁻⁴ threshold. This is consistent with findings in other global healthcare and elderly care settings where chemical inhalation risks often surpass acceptable limits, necessitating immediate environmental modelling and mitigation [3, 45].
The intensity of HCHO risk varied significantly by ward type, which could be driven by clinical activities and geographic/structural factors. The extreme HCHO levels are likely due to the intensive use of formalin-based fixatives and sterilization agents [29]. The morning HQ spikes (HQ = 3.32) in CO suggest a “buildup effect” of pollutants during stagnant nighttime hours [39, 40]. The variation in risk between the public and private facilities in this study may be influenced by the geographic placement and architectural design of the buildings, as seen in similar studies where facility location relative to outdoor sources significantly altered the indoor risk profiles [45]. However, the low PM-related HQ (< 0.30) in this study is notable, while PM remains a concern in many Nigerian health centers because of outdoor infiltration [46]. Our results suggest that in these specific facilities, chemical VOCs present more immediate carcinogenic and respiratory hazards than particulates do. This underscores the need for localized modelling and risk analysis, as proposed in recent systematic reviews of healthcare air quality [46].
The workforce is predominantly female (62.5%) and young. Young, female healthcare workers may be more susceptible to the immunobiological effects of inhalant-mediated allergies triggered by HCHO [36]. A significant difference in roles was observed (p = 0.011). The higher density of clinical staff in private hospitals (37.3%) places a larger proportion of the medical workforce in high-risk HCHO zones. These findings align with studies conducted by [42, 46] in Porth Harcourt and Akure, Nigeria, where healthcare facilities frequently exhibit air quality profiles that deviate from safety standards.
This study revealed a high baseline prevalence of respiratory irritation among the hospital workforce, with coughing (78.3%) and sneezing (65.1%) being the most pervasive symptoms. This high symptomatic burden is statistically significant when comparing facilities, particularly regarding persistent cough and chest pain, both of which were substantially more prevalent in the public hospital environment. While symptoms such as wheezing (33.6%) and breathlessness (22.4%) were prevalent across both facilities, they did not significantly differ from cough and chest pain. This suggests that while acute irritants (HCHO and TVOCs) drive the immediate coughing response, the underlying state of AHR may be a more generalized risk across the study population because of the synergy between PM and indoor allergens [36, 38].
The logistic regression analysis also revealed a robust association between hospital type and respiratory outcomes. Workers in public hospitals were more than three times more likely to report persistent cough (AOR = 3.009; p = 0.012) and nearly three times more likely to report chest pain (AOR = 2.681; p = 0.031) than those in private facilities were. These elevated odds ratios suggest that higher particulate matter (PM) levels and localized HCHO “hotspots” in public facilities serve as primary drivers of adverse respiratory outcomes [36, 37]. These findings are in tandem with the physiological mechanisms of neurogenic inflammation, where high concentrations of TVOCs and HCHO act as potent triggers for the upper and lower airways, manifesting as the chronic cough and chest discomfort observed in this study [32, 35]. The disparity in symptom prevalence between the public and private sectors in this study is consistent with the findings in other West African clinical settings and South–South Nigeria, where operational factors and building design significantly impact staff health [43, 46].
An important finding of this study is the profound gap between general health awareness and technical institutional knowledge. While 94.1% of workers were aware of the health effects of air pollution, only 20.4% were aware of any ongoing air quality monitoring within their facilities. Furthermore, less than 10% had any knowledge of government interventions. This lack of institutional transparency and regulatory oversight is a known factor in poor IAQ management in healthcare settings [35]. Without active monitoring and a clear understanding of regulatory thresholds, even highly educated staff members are still at risk during brief periods of high pollution [31, 45]. However, the relatively low awareness of institutional monitoring (13.7%–23.8%) is a stark departure from studies in the Global North, where air quality is often strictly regulated and monitored through advanced HVAC and HEPA filtration systems [30, 44]. These results emphasize that when staff awareness is high, the absence of robust institutional monitoring and government intervention represents a significant barrier to mitigating the toxicological and carcinogenic risks identified in the HQ and CR profiles [3, 46].
Despite the significant findings, this study has several limitations. First, the reliance on self-report questionnaires for respiratory symptoms may introduce recall bias among participants. Second, the monitoring campaign was restricted to the rainy season; therefore, the results may not reflect the seasonal fluctuations in the PM and HCHO levels that could have occurred during the drier Harmattan period. Third, the study utilized the BR-Smart-126 series, a low-cost consumer-grade sensor. The electrochemical sensors utilized for HCHO monitoring are subject to cross-sensitivity with alcohol-based disinfectants and sanitizers prevalent in hospital settings. Consequently, the high HCHO readings (HQ > 10) likely reflect a combined chemical burden rather than isolated HCHO exposure. As field calibrations against reference-grade instruments were not performed, these values should be interpreted as indicating high total chemical loading and should be used as a baseline for future high-precision studies. Finally, while the logistic regression was adjusted for age, sex, and smoking status, it did not account for the workers’ home indoor environments. Domestic exposures, such as the use of biomass fuels for cooking or residences near high-traffic areas, are significant confounders. The lack of data on off-duty air quality exposure remains a limitation, as domestic conditions may independently contribute to the high prevalence of respiratory symptoms observed.
In conclusion, the IAQ in the assessed healthcare facilities poses a significant and immediate threat to the respiratory health of hospital personnel. While particulate matter remained within safe thresholds, HCHO and TVOCs emerged as critical toxicological hazards, particularly in private emergency and laboratory units where CR and non-carcinogenic HQ exceeded international safety limits by up to ten-fold. The high prevalence of persistent cough, chest pain, and AHR among the predominantly young, female workforce is directly associated with clinical activities, poor building design, and a “buildup effect” caused by inadequate ventilation. Furthermore, a profound “knowledge-action gap” exists; despite high general health awareness among staff, the lack of institutional monitoring and regulatory oversight leaves workers vulnerable to toxic exposure levels that are largely ignored by current administrative frameworks. To mitigate these risks, hospital management should prioritise the installation of advanced air filtration systems, such as activated carbon filters specifically designed to capture gaseous VOCs and HCHO. Facilities must transition from a reliance on natural ventilation to regulated mechanical systems that prevent the stagnant night time “buildup effect,” alongside the implementation of stricter protocols for the storage and use of formalin-based fixatives. Architecturally, future hospital designs should ensure greater setbacks from high-traffic areas and CP to reduce outdoor pollutant infiltration. Finally, health institutions must bridge the awareness gap by establishing continuous IAQ monitoring programs and transparent reporting systems, ensuring that highly educated medical staff are not only aware of the risks but also actively protected by enforceable institutional safety thresholds and government interventions.
AHR: airway hyper-responsiveness
AT: antenatal wards
CO: outpatient departments
CP: car parks
CR: cancer risk
EC: exposure concentration
EM: emergency wards
EMT: epithelial-mesenchymal transformation
HCHO: formaldehyde
HHRA: human health risk assessment
HQ: hazard quotient
HRA: health risk assessment
IAQ: indoor air quality
IUR: inhalation unit risk
LB: central laboratories
LCR: lifetime cancer risk
PE: pediatric wards
RE: reception areas
TVOCs: total volatile organic compounds
U.S. EPA: United States Environmental Protection Agency
VOCs: volatile organic compounds
WHO: World Health Organization
The supplementary tables for this article are available at: https://www.explorationpub.com/uploads/Article/file/1009129_sup_1.pdf.
The authors acknowledge the medical director and staff of the participating health care facilities used for this study for their cooperation. We also appreciate the final-year students from the Department of Environmental Management and Toxicology, University of Benin, for their technical support during the field monitoring, spatio-temporal data collection, and questionnaire administration phases.
AFE: Conceptualization, Investigation, Writing—original draft, Writing—review & editing. HOO: Investigation, Writing—original draft, Writing—review & editing, Supervision, Validation. Both authors read and approved the submitted version.
The authors declare that they have no conflicts of interest.
The study was approved by the Health Research Ethics Committee of the University of Benin Teaching Hospital (Protocol Number: ADM/E22/A/VOL.VII/1486549125536), and complies with the Declaration of Helsinki.
Informed consent to participate in the study was obtained from all participants.
Informed consent to publication was obtained from relevant participants.
The data of this manuscript could be available from the corresponding authors upon reasonable request.
Not applicable.
© The Author(s) 2026.
Open Exploration maintains a neutral stance on jurisdictional claims in published institutional affiliations and maps. All opinions expressed in this article are the personal views of the author(s) and do not represent the stance of the editorial team or the publisher.
Copyright: © The Author(s) 2026. This is an Open Access article licensed under a Creative Commons Attribution 4.0 International License (https://creativecommons.org/licenses/by/4.0/), which permits unrestricted use, sharing, adaptation, distribution and reproduction in any medium or format, for any purpose, even commercially, as long as you give appropriate credit to the original author(s) and the source, provide a link to the Creative Commons license, and indicate if changes were made.



View: 1035
Download: 37
Times Cited: 0
Aurelia S. Monk ... Adam J. Kimple
Maria Concetta D’Ovidio ... Gennaro D’Amato
Cristiano Caruso ... Stefano Del Giacco