 Review

Affiliation:
1Sorbonne Université, Inserm UMR-S1135, Centre d’Immunologie et des Maladies Infectieuses (CIMI-Paris), 75013 Paris, France
2e-health and artificial intelligence working group, Société Française d’Allergologie, 34000 Montpellier, France
ORCID: https://orcid.org/0000-0001-7465-1920
Affiliation:
2e-health and artificial intelligence working group, Société Française d’Allergologie, 34000 Montpellier, France
3Laboratoire d’Etudes et de Recherches Appliquées en Sciences Sociales (LERASS), Université de Montpellier Paul-Valéry (UMPV), 34000 Montpellier, France
ORCID: https://orcid.org/0000-0001-7436-2846
Affiliation:
2e-health and artificial intelligence working group, Société Française d’Allergologie, 34000 Montpellier, France
4Centre d’Allergologie, 90000 Belfort, France
ORCID: https://orcid.org/0009-0000-2989-1968
Affiliation:
5Immunoconcept CNRS UMR 5164, University of Bordeaux, 33000 Bordeaux, France
6Immunology and Immunogenetic Laboratory, University Hospital of Bordeaux, 33076 Bordeaux, France
ORCID: https://orcid.org/0009-0001-3382-1679
Affiliation:
7Allergy Unit, University Hospital of Bordeaux, 33076 Bordeaux, France
Affiliation:
6Immunology and Immunogenetic Laboratory, University Hospital of Bordeaux, 33076 Bordeaux, France
ORCID: https://orcid.org/0009-0009-7028-0646
Affiliation:
8UMR 8516, Laboratoire avancé de spectroscopie pour les interactions, la réactivité et l’environnement, Université de Lille, 59655 Villeneuve d’Ascq, France
ORCID: https://orcid.org/0000-0001-8843-4660
Affiliation:
2e-health and artificial intelligence working group, Société Française d’Allergologie, 34000 Montpellier, France
9Environmental Risk Assessment (HERA) Team, UMR261 MERIT, IRD, Inserm 1344, Université Paris Cité, 75006 Paris, France
10Department of Biological Immunology, Saint-Antoine Hospital, AP-HP Sorbonne University, 75012 Paris, France
ORCID: https://orcid.org/0000-0002-9778-0044
Affiliation:
11Center of Allergy & Environment (ZAUM), Member of the German Center for Lung Research, Technical University and Helmholtz Center, 80802 Munich, Germany
ORCID: https://orcid.org/0000-0003-3581-5472
Affiliation:
2e-health and artificial intelligence working group, Société Française d’Allergologie, 34000 Montpellier, France
12University Hospital Institute–Immun4Cure (IHU Immun4Cure), Univ Montpellier, INSERM, 34090 Montpellier, France
13EAACI Patient and Public Health Outreach Hub Chief Editor, 8050 Zurich, Switzerland
ORCID: https://orcid.org/0000-0002-6340-9300
Affiliation:
2e-health and artificial intelligence working group, Société Française d’Allergologie, 34000 Montpellier, France
5Immunoconcept CNRS UMR 5164, University of Bordeaux, 33000 Bordeaux, France
6Immunology and Immunogenetic Laboratory, University Hospital of Bordeaux, 33076 Bordeaux, France
7Allergy Unit, University Hospital of Bordeaux, 33076 Bordeaux, France
Email: julien.goret@chu-bordeaux.fr
ORCID: https://orcid.org/0000-0003-0469-169X
Explor Asthma Allergy. 2026;4:1009123 DOI: https://doi.org/10.37349/eaa.2026.1009123
Received: December 31, 2025 Accepted: March 17, 2026 Published: April 21, 2026
Academic Editor: Mario Di Gioacchino, Italian Society of Allergy and Clinical Immunology, G. d’Annunzio University, Italy
The article belongs to the special issue Climate Change, Allergy, and Immunotherapy
Pollen-related allergic diseases, including allergic rhinoconjunctivitis and asthma, affect a growing proportion of the population and have substantial consequences for quality of life and healthcare systems. Conventional pollen forecasts, which rely on fixed pollen traps and meteorological data, are limited in spatial granularity, real-time responsiveness, and individual relevance. Recent advances in artificial intelligence (AI) and machine learning (ML) offer a paradigm shift in the modelling of pollen release, forecast exposure, and alert allergic patients. This article provides a comprehensive overview of ML-based pollen forecasting systems, clarifying their underlying principles in accessible terms for clinicians and presenting practical and published tools that allergologists can integrate into routine practice. By combining aerobiological data, meteorological models, and patient-reported outcomes, ML enables more personalized, precise, and timely allergy management. We review the fundamental mechanisms of pollen release and dispersion and illustrate how ML models can improve predictive accuracy. Key platforms are compared in terms of clinical usability. We present real-world use cases showing how ML-driven alerts can help optimize treatment plans and support patient education. Practical insights are provided on the evaluation, implementation, and limitations of these tools. ML is not a distant technology—it is already transforming pollen forecasting and allergy alerts. This article aims to equip allergologists with the knowledge needed to evaluate and adopt these tools, enabling a more proactive and personalized approach to managing pollen allergies.
Over the past decades, epidemiological data have consistently painted a picture of an escalating prevalence of pollen allergies worldwide, including rhinitis and asthma [1–5]. Globally, allergic rhinitis now affects an estimated 20–30% of the population, with projections from organizations such as the World Health Organization suggesting that over half of the world’s population could be impacted by some form of allergy by 2050 [6], with allergic rhinitis ranking as the most common. In industrialized nations, prevalence rates have sometimes doubled or even tripled within a generation, with adolescents and young adults often exhibiting the highest rates. This rise is not limited to allergic rhinitis alone. Pollen allergy is a major risk factor for asthma, and the increasing rate of pollen sensitization is directly reflected in a growing burden of allergic asthma, particularly among children [7–11]. Moreover, beyond prevalence, many patients report worsening symptom severity and a longer duration of discomfort, turning what was once a seasonal nuisance into a chronic burden that significantly affects quality of life, as well as school and work productivity. The explanation for this resurgence lies in a set of interconnected mechanisms, forming a globally altered allergenic “exposome” that interacts with individual genetic and immunological susceptibility [12]. Taken together, these exposomic factors represent a significant threat, making pollen allergy likely to rise further.
While the early 20th-century “first wave” of the allergy epidemic was primarily fueled by agricultural shifts and improved public hygiene, climate change has undoubtedly emerged as the most powerful and well-documented driver of the rise in pollen allergies during the late 20th and early 21st centuries [13–15]. Its effects are multiple [12, 16, 17]. Climate change extends pollen seasons by enabling earlier springs and later autumns, significantly prolonging allergen exposure. Higher temperatures and increased atmospheric carbon dioxide concentrations boost plant growth, leading to increased pollen production. Furthermore, carbon dioxide and other pollutants can enhance pollen allergenicity by altering pollen biochemistry. Finally, warmer climates facilitate the expansion of allergenic plant ranges, introducing new allergens into previously unaffected regions and fostering new waves of sensitization.
Ambient air pollution significantly worsens both the development and severity of pollen allergies [17, 18]. Increasing evidence suggests that pollutants from traffic, industry, and domestic heating interact with pollen through several synergistic mechanisms. First, irritants such as fine particulate matter, nitrogen oxides, and ozone damage the respiratory epithelial barrier, making the airways more permeable and facilitating deeper penetration of allergens. Second, pollutants can alter the physical and chemical properties of pollen grains by adhering to their surface, increasing their fragility and promoting the release of allergenic proteins [19]. Finally, certain components of air pollution, especially diesel exhaust particles, exert an immunological adjuvant effect by activating immune cells and enhancing pro-allergic inflammation [20]. Together, these mechanisms lead to stronger and more severe allergic responses than exposure to pollen or pollutants alone.
The built environment also plays a significant role in increasing the pollen allergy burden [21, 22]. Urban planning has historically favored certain robust or low-maintenance tree species—such as birch, plane, or cypress—without considering their high allergenic potential. This limited botanical diversity in cities results in concentrated exposure to potent pollen sources. In addition, the urban heat island effect, whereby cities are warmer than surrounding rural areas, amplifies climate-driven increases in pollen production and release [23]. Beyond these environmental factors, shifts in human lifestyle—the so-called “personal exposome”—may further contribute to the rise in pollen allergy by disrupting the airway microbiome and modulating the immune system [24].
In an era defined by escalating pollen allergies and asthma, accurate and timely pollen monitoring becomes an indispensable tool for proactive health management, addressing both patients’ and allergists’ needs. It empowers individuals by providing actionable information and enables medical professionals to deliver more targeted care. For patients, timely information on pollen counts and forecasts is crucial for anticipating symptoms, allowing them to adapt outdoor activities and optimize medication initiation before symptom onset, thereby improving quality of life and reducing anxiety. For allergists, such data are essential for accurate diagnosis, enabling correlations between symptoms and specific pollen types, the tailoring of personalized treatment plans [including allergen immunotherapy (AIT) and medication adjustments], and more precise patient counseling. Ultimately, continuous and accessible pollen monitoring empowers both groups to navigate the increasing prevalence and severity of allergic diseases more effectively, fostering prevention, informed decision-making, and better health outcomes. Reliable pollen monitoring transforms an unpredictable environmental threat into manageable information, supporting proactive self-management for patients and enabling precision medicine for allergologists, in a landscape where allergic diseases are increasingly prevalent and aggressive.
In this context, artificial intelligence (AI) can play a transformative role in addressing the complex challenge of rising pollen allergies and pollen-induced allergic asthma by improving monitoring, prediction, understanding, and management through the integration of massive amounts of high-dimensional data. AI applications span data analysis, predictive modelling, personalized medicine, and even urban planning. This article aims to provide a clear and accessible overview of the current landscape of AI applications in pollen modelling. It will present practical tools such as pollen forecasts, collectors, sensors, and smartphone apps, and illustrate how allergists may use these to improve patient monitoring. The purpose of this article is to equip allergologists with the knowledge needed to assess and adopt these tools, moving toward a more anticipatory and personalized approach to pollen allergy management.
The European Environment Agency defines pollination as “the transfer of pollen from an anther to a stigma in angiosperms, or from a microsporangium to a micropyle in gymnosperms” [25]. This process occurs only in spermatophytes, which include angiosperms (flowering plants) and gymnosperms (seed plants) [26]. The first step in pollen release is anthesis, defined as the period during which a flower is fully open and functional [27].
The mechanisms of anthesis are classified as either active or passive, depending on whether they are self-powered or require energy input from the environment. Active pollen release mechanisms involve programmed cell death and turgor changes in anther tissues that control the timing of dehiscence. Vibrational or mechanical stimuli from pollinators can trigger pollen ejection, enabling precise synchronization between floral function and pollinator behavior. In principle, active release can occur independently of wind speed and turbulence intensity because the mobilizing force is generated internally. However, active release is sometimes triggered by environmental cues indicating favorable conditions for wind dispersal [28]. Pollen release can also occur through passive biomechanical mechanisms, driven by tissue dehydration and hygroscopic movement within the anther wall. This allows dehiscence to occur without active cellular control. These passive processes are highly sensitive to meteorological factors: temperature and relative humidity regulate anther drying dynamics, while wind intensity and rainfall influence the timing and efficiency of pollen liberation and dispersal. Exposure to wind can lead to pollen removal when the forces experienced by pollen grains exceed the resistive forces keeping them attached to the anthers [29].
Meteorological measurements (e.g., relative humidity, solar radiation, temperature, and wind speed) and pollen concentration data indicate a causal relationship; however, determining the relative effects of individual meteorological variables is challenging given their frequent temporal correlation [30]. Environmental conditions favoring wind pollination have been inferred mainly from biogeographic and habitat trends in the occurrence of wind-pollinated species [15]. Habitat complexity and persistent rainfall are generally thought to disfavor wind pollination because both can result in pollen loss from airflows [31].
Both conventional methods and new technologies are used to assess and forecast pollen. Conventional approaches rely on aerobiology and involve capturing airborne pollen, followed by manual identification and quantification. The volumetric trap (e.g., Hirst-type) is considered the gold standard, drawing a known volume of air onto an adhesive surface over time [32]. This surface is then analyzed microscopically by trained personnel to count and identify different pollen types, yielding quantitative data expressed as pollen grains per cubic meter. The Hirst trap operates on the principle of volumetric impact: air is aspirated at a constant flow rate of 10 L/min, accelerating particles that are then projected onto an adhesive surface. A rotating drum equipped with a mechanical clock allows continuous sampling for 7 days without intervention, with a temporal resolution of approximately 2 hours. After this sampling period, the tape is prepared by adding a stain and cutting it into daily slides. Analysis is performed under a microscope by analysts specifically trained in pollen recognition. These analysts are a key asset of the method because they can routinely identify approximately 100 pollen taxa and up to 20 fungal spores. Although it is technically possible to conduct 24-hour sampling, the substantial additional labor required means this option is almost never used by measurement network managers.
The collection efficiency of Hirst traps can be influenced by wind speed and is highly sensitive to accurate mechanical calibration of the aspiration flow rate [33]. The margin of error for sampling with such sensors is estimated to be on the order of 20–30% [34]. Despite these limitations, Hirst traps are widely used, with more than 500 stations worldwide (https://pollenscience.eu/) [35], and some sites provide sampling records spanning several decades. Their broad adoption is largely attributable to relatively low equipment costs (approximately €5,000 per sampler), mechanical robustness, and standardized operating procedures [36]. These traps provide continuous and comparable daily records, along with detailed morphological identification of pollen taxa. However, their operation is labor-intensive, time-consuming (with a 24- to 48-h delay), and costly because of the need for highly specialized personnel. The principal drawback of aerobiological monitoring remains the temporal latency between the start of sampling and the availability of analytical results, which typically occurs 7–8 days later. Historical datasets of pollen and mold measurements collected by the Réseau National de Surveillance Aérobiologique (RNSA) between 1987 and 2024 in France, as well as historical sensor data from across Europe, are available in open access [35, 37].
Pollen assessment through modeling provides broader spatial coverage and forecasting capabilities, complementing physical sampling techniques. These models integrate diverse data sources, with satellite imagery playing a central role in mapping vegetation and monitoring phenology. Satellite data are particularly valuable for characterizing the spatial distribution of allergenic vegetation—thereby improving source term estimates—and for tracking large-scale plant growth cycles, which are essential inputs for both phenological and dispersion models (see Current AI-based tools and platforms in pollen forecasting and patient monitoring).
AI can be defined as the ability of a machine to reproduce human-like behaviors, such as reasoning, planning, and creativity [38]. AI encompasses several branches, among which ML and deep learning (DL) are particularly relevant for predictive modelling.
ML algorithms learn statistical relationships from data in order to perform prediction or classification tasks. Rather than being explicitly programmed, these models identify and learn patterns either from labeled examples (supervised learning) or by autonomously discovering structure in unlabeled data (unsupervised learning) [39, 40]. Common ML techniques include linear and regularized regression models, tree-based methods such as random forests or gradient boosting, support vector machines, and ensemble approaches that combine multiple algorithms to improve accuracy. These methods are especially effective when large, well-curated datasets are available and when relationships between variables remain relatively stable over time.
DL is a specialized subset of ML based on artificial neural networks composed of multiple computational layers. Inspired by the architecture of the human brain, these networks are particularly effective at capturing complex and nonlinear interactions in large datasets [41, 42]. DL is especially relevant for environmental exposure prediction because many key inputs—such as meteorological signals, pollen measurements, and satellite data—are time series or spatially structured. Recurrent neural networks are designed to learn temporal patterns, including daily and seasonal pollen cycles or sudden bursts following thunderstorms [41, 43]. Convolutional neural networks can extract meaningful information from satellite imagery or land use maps [44, 45]. DL models often include millions of parameters that are iteratively optimized during training, allowing them to ingest heterogeneous information (weather, vegetation indices, pollution, sensor data) and fuse it into a coherent predictive signal [41]. Owing to their performance, these models are increasingly used in modern pollen forecasting systems, particularly when high-resolution and short-term predictions (< 72 hours) are required. However, their accuracy depends on the availability of large, high-quality datasets, and their training demands substantial computational resources [41, 44, 45].
In contrast to traditional statistical approaches, AI systems can incorporate a wider variety of information and automatically learn from data, improving over time. These models typically ingest multiple sources of input, including meteorological data (e.g., temperature, humidity, wind speed, rainfall), phenology, land use and vegetation indices (e.g., satellite imagery, land cover), historical pollen measurements (e.g., time series and long-term trends), environmental co-factors (e.g., air pollution), and clinical data from patients (e.g., symptom trackers, clinical scores, mobile health data) [44, 46].
By processing large volumes of information (big data) and identifying interactions that would be impractical to model manually, AI systems can capture the complex, nonlinear dynamics of pollen emission and dispersion. Their predictions can then be integrated into decision-support tools, whose outputs must be clinically interpreted before being applied in practice.
By integrating heterogeneous data sources—such as meteorological variables, satellite-derived phenology, air pollution levels, symptom diaries, and real-time sensor measurements—into a coherent predictive signal, AI models using multimodal approaches can generate forecasts that are more closely aligned with actual exposure and its clinical consequences (Figure 1). When combined with individual symptom patterns, AI can also support personalized allergy forecasting, enable the development of risk scores, and inform patient-specific clinical decision-making to tailor preventive and therapeutic strategies, including preventive recommendations, treatment optimization, seasonal AIT, and avoidance measures. These data-driven approaches represent a paradigm shift from population-based pollen calendars toward individualized exposure assessment in modern allergology and precision medicine [47, 48].
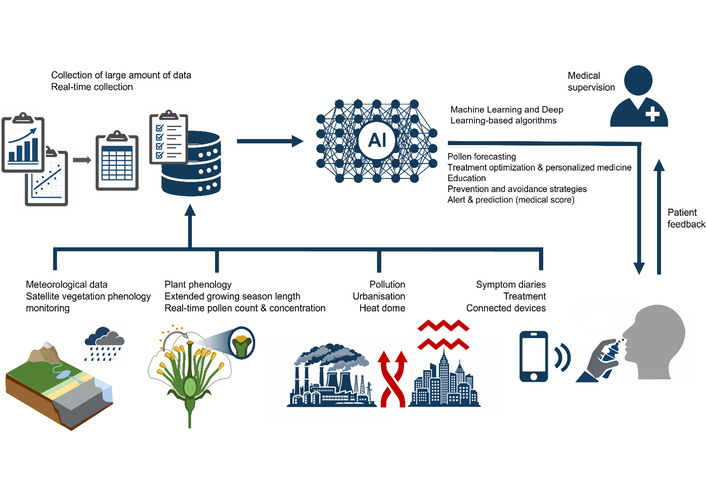
Integration of heterogeneous data sources into a coherent predictive AI signal aligned with actual exposure and its clinical consequences.
AI-enabled pollen services become clinically meaningful only when they are linked to symptoms, treatments, and decisions at the individual patient level. For allergologists, the key question is no longer how accurate a city-level forecast may be, but rather how this information can be integrated into consultations to improve the management of rhinitis and asthma. AI can be used to generate pollen forecasts, feed automated alert systems, integrate patient feedback (e.g., symptoms and behavior) to refine iterative models, and support clinical decision-making in routine practice.
Phenological models predict the timing of pollen seasons using historical meteorological and ground-based data, while dispersion models simulate atmospheric pollen transport by combining source estimates (often derived from vegetation maps), meteorological data (e.g., wind, precipitation), and pollen-specific characteristics. Hybrid statistical–empirical models integrate multiple data sources, including satellite-derived land-use and land-cover information, to generate spatially resolved pollen forecasts. Although powerful in terms of prediction and spatial coverage, these models still require validation against ground-based pollen counts, making them complementary tools rather than replacements for physical traps.
In France, until March 2025, pollen assessment relied on classical counting performed at 72 stations covering the most relevant pollen species, coordinated by the RNSA until 2024 [37]. Since then, ATMO France, through the network of Approved Air Quality Monitoring Associations (AASQA), has been providing pollen monitoring using an original AI-based methodology. This approach is built on statistical models integrating historical pollen measurements, weather forecasts, and data from the European Copernicus platform [Copernicus Atmosphere Monitoring Service (CAMS)], and currently covers six taxa based on 56 stations. The CAMS acts as a public data hub, being freely accessible to researchers, developers, and pollen alert service providers. However, this model has not been independently evaluated, and the performance described to date appears poor and remains sparsely discussed in the literature [49].
The most common forecasting approaches can be broadly divided into two categories: long-range dispersion models and local-scale statistical models. Dispersion models enable the prediction of pollen distribution over large geographical areas, but their accuracy varies considerably across space and depends strongly on the quality of information available on plant distribution [50–52]. These models simulate the physical characteristics of the dispersion environment, including species distribution, phenology, meteorology, and topography, and require detailed input data as well as substantial computational resources [53]. Dispersion models offer several advantages: they can be used to forecast future pollen concentrations, do not require a dense network of monitoring stations, and are adaptable to new regions and multiple temporal scales [53]. Statistical models, by contrast, are most often observation-based and exploit empirical relationships between pollen concentrations and a set of independent variables, typically meteorological parameters [50, 51].
A major challenge for all modelling approaches is maintaining predictive performance in a rapidly changing environment, particularly by accounting for plant adaptation to new climatic conditions [54, 55]. The widespread use of satellite imagery as model output has the potential to improve understanding of both plant distribution and phenological variability. In parallel, the integration of data from real-time measurement networks will be essential to adjust model predictions, especially during extreme events or peaks in pollen concentration [45]. Moreover, the incorporation of DL and ML techniques into numerical models holds strong promise for improving performance compared with classical approaches, notably by capturing complex nonlinear relationships and enabling more flexible regressions between input variables and model outputs [56, 57].
Traditional pollen forecasts typically provide a generic alert at the city or regional level. AI-enabled systems aim to move beyond these population-level messages toward personalized forecasts that better reflect individual exposure and susceptibility.
PollenSense provides a real-time, portable identification sensor designed to collect and analyze airborne particles, including pollen and spores, in both outdoor and indoor environments. It delivers local alerts in near real time and enables continuous monitoring across settings [58, 59]. Sensors such as the PollenSense APS-300/400 rely on digital microscopy and Particle Hunter™ ML algorithms to image and classify airborne particles—including multiple pollen taxa—with minute-level temporal resolution. When combined with meteorological models and satellite data, these signals can be used to generate high-resolution forecasts at spatial scales of a few hundred meters through services such as BreezoMeter (Table 1).
AI-enabled tools and platforms for pollen forecasting and patient monitoring.
| Tool/Platform | Data sources | Spatial/Temporal resolution | Type of signal | Patient interaction | Level of personalization |
|---|---|---|---|---|---|
| MASK-air | Patient-reported symptoms and environmental/pollen data (CAMS, EAN, meteorology) | User level (via geolocation, daily logging) | Personalized symptom forecasts and alerts for high-risk days | Mobile app with daily symptom diary and notifications | High (individual symptom-based adaptation) |
| PollenSense | Local AI-powered sensor detecting airborne particles (pollen, spores) | Point location, near real-time | Real-time alerts with species-level discrimination | Mobile app linked to sensor device | Very high (personalized to the user’s immediate environment) |
| BreezoMeter | CAMS, local monitoring stations, traffic, satellite, and meteorology | High local resolution (street to city level), hourly updates | Multi-species pollen risk index and health recommendations | Mobile app + API for integration | Medium to high (location-based; limited direct symptom integration) |
| Airly | Dense network of low-cost sensors + meteorological/satellite data | Street/city scale, hourly updates | Air quality and pollen alerts | Mobile app, web dashboard, API | Medium (location-based, limited individual adaptation) |
| Tomorrow.io | Weather models + environmental data + ML | City/regional forecasts, hourly/daily | Hyperlocal pollen and weather-related risk alerts | Mobile app and API (for health providers and enterprises) | Medium (location-based personalization) |
| CAMS | European-scale atmospheric models + ground observations | Approximately 10-km grid, forecasts up to 3–4 days ahead | Regional pollen forecasts (general risk levels) | Via third-party apps (e.g., PASYFO) | Low to medium (region-based, indirect personalization via downstream apps) |
| Airmine | Satellite imagery (Sentinel-2), meteorology, local sensors, and user symptom diaries | Local maps, high resolution, daily | Pollen risk maps and push notifications | Mobile app with personal symptom tracking | High (adapted to individual symptom history) |
| PASYFO | CAMS pollen forecasts and personal symptom data | Local area, daily forecasts | Personalized allergy symptom forecasts | Mobile app with an interactive diary | High (individualized forecasts based on personal symptom data) |
| APOLLO | Electronic pollen monitoring network and self-reported symptoms of allergic rhinitis and asthma | Local area, up to a 60-day period | Indices visualizing individual symptom burden and daily pollen concentrations | Mobile app with an interactive diary | High (individual-level symptom and exposure data) |
CAMS: Copernicus Atmosphere Monitoring Service; EAN: European Aeroallergen Network; ML: machine learning; API: application programming interface; PASYFO: Personal Allergy Symptom Forecasting.
The CAMS provides pollen forecasts across Europe. A notable advance is the collaboration between the CAMS and the European Aeroallergen Network (EAN) to develop automated measurements of pollen concentrations for near real-time validation of forecasts, within the AutoPollen project. These measurements allow daily comparisons between forecasts and observations, ultimately improving model performance through data assimilation [60]. The CAMS also feeds data into downstream applications such as Personal Allergy Symptom Forecasting (PASYFO), which uses this information to generate personalized allergy symptom forecasts based on users’ symptom histories [61]. APOLLO similarly links daily symptom and impairment indices with regional electronic pollen monitoring, offering feedback on how day-to-day behavior and environmental exposure influence symptoms [62]. From a methodological perspective, these systems typically rely on time-series analyses and ML models trained on large volumes of paired “exposure–symptom” data. Other mobile research platforms have also demonstrated the feasibility of building predictive models for environmental allergy symptoms using user-collected data [63].
AI-powered alert systems can be linked to electronic symptom logs (apps and websites) to create personalized response models. For example, cross-referencing pollen concentration curves (by pollen type) with reported symptom severity allows algorithms to estimate individual symptom trigger thresholds. Digital diaries combined with AI models thus pave the way for tailored, dynamic action plans that go beyond static stepwise recommendations. When longitudinal symptom–medication indices are systematically integrated with forecast environmental data (pollen, pollution, weather), supervised ML algorithms can estimate the short-term probability of symptom worsening for a given individual. This concept has been explored in mobile research platforms using real-world symptom and risk factor data to build models that predict the occurrence and severity of environmental allergy symptoms at the individual level. Such tools can support dosage adjustments for antihistamine or corticosteroid treatments or trigger prophylactic measures, such as early treatment initiation or limitation of outdoor activities. Several mobile health platforms now provide daily symptom diaries explicitly linked to environmental data [64]. For example, the Mobile Airways Sentinel network (MASK-air®) is an application designed for patients with allergic rhinitis (Table 1). Patients record nasal, ocular, and asthma symptoms, medication intake, and impact on work using visual analogue scales. These data can be aggregated into validated and structured digital biomarkers, such as the Combined Symptom-Medication Score and electronic asthma control indices [65, 66]. AI-based tools can then support patients by advising on the most appropriate strategy and optimal treatment when needed for allergic rhinitis. MASK-air® integrates data from environmental sensors, air quality monitoring stations, and other pollen sources, and also computes an air quality index using an algorithm based on international standards.
The MeteoPollen app has compared simulated pollen models with measured data and demonstrated good correlation, suggesting that these predictions could form a basis for patient advice [66]. The platform also compared modelled and measured allergic risk estimates using CAMS data, with risk information derived from the RNSA pollen network [55]. AllergyMonitor® offers a similar diary-based approach, focusing on pollen-related rhinitis and asthma, with Conformité Européenne (CE)-marked data capture and graphical visualization of relationships between symptoms, medication use, and local pollen counts.
More recent systems extend this paradigm further. The APOLLO web and mobile application was designed specifically for patients with pollen-related allergic rhinitis and asthma, combining daily complaint and impairment scores with electronic pollen monitoring in Bavaria [62]. Other applications—such as klarify®, AirRater, Husteblume, AllerSearch, the Pollen App, and Galenus Health—also combine symptom logging with location-specific information on pollen, weather, and air quality, although with more heterogeneous levels of clinical validation.
In the consultation setting, such models could be used to define patient-specific thresholds that trigger predefined actions. For example:
If a composite daily symptom index and predicted grass pollen index exceed a defined threshold for several consecutive days, the written action plan may instruct the patient to intensify intranasal corticosteroids and antihistamines.
Recurrent high-risk periods despite optimal pharmacotherapy may prompt consideration of AIT or reassessment of comorbid asthma.
These tools allow allergists to discuss with patients which pollen species, pollution peaks, or behaviors are most plausibly associated with loss of disease control. Applications such as AllergyMonitor, MASK-air®, AirRater, and others can also be combined with connected peak flow meters or spirometers, smart inhalers that log usage, and wearable devices measuring activity, heart rate, and sleep. Together, these technologies provide a multimodal and integrated picture of disease control and environmental exposure [67, 68]. Although most of these systems remain in the research or pilot phase, they point toward a model in which allergologists supervise, interpret, and adjust care using a continuous stream of ML-processed data rather than isolated clinical snapshots.
AI-enhanced environmental platforms make it possible to move from retrospective assessments toward truly anticipatory counseling. In clinical practice, this shift translates into several concrete scenarios:
Travel planning. During pre-season consultations, patients with severe seasonal rhinitis or poorly controlled pollen-induced asthma can be advised to select holiday destinations and travel periods associated with lower predicted exposure to their relevant allergens, rather than relying on generic guidance such as “coastal versus inland” locations.
Sports and occupational exposure. Hyper-local forecasts can help tailor recommendations for outdoor physical activity or work schedules during anticipated peaks of grass or weed pollen, particularly in sensitized athletes or outdoor workers.
Therapeutic windows. Initiation or dose escalation of AIT can be scheduled outside major peaks of the relevant pollen season, thereby reducing the risk of adverse reactions. Similarly, short-term intensification of treatment can be planned in advance of high-risk periods in patients with pollen-driven asthma.
Therapeutic education. Patients with allergic diseases can improve their understanding of symptom triggers, adherence to avoidance measures (e.g., masks, closed windows, air purifiers), and acceptance of medication strategies by visualizing their actual pollen exposure over time. Access to daily local “pollen risk maps”—including personalized alerts delivered via text messages or app notifications—and seasonal forecasts can further support anticipation and self-management [61, 64].
These educational approaches, reinforced by visual evidence and personal statistics, may enhance engagement and long-term disease control. Looking ahead, digital twin engines—in which a virtual representation of the patient continuously integrates live environmental data, physiological signals, and historical responses—could enable highly personalized predictions and adaptive interventions. Such tools, fully incorporating exposomic data, do not yet exist.
While tools based on AI techniques offer substantial promise for pollen forecasting and patient alert systems—benefiting allergists, patients, and public health more broadly [5, 69, 70]—their widespread adoption in clinical practice remains constrained by several important challenges.
A first barrier relates to trust and clinical reasoning when decisions are supported by automated systems. Many clinicians perceive AI tools as complex or insufficiently transparent, particularly when forecasts or alerts are generated by “black-box” models that offer little insight into why specific predictions or recommendations are produced. Limited training in AI literacy and data science, together with the absence of standardized evaluation frameworks, may further amplify this hesitancy [63]. Another concern is the potential dehumanization of the doctor–patient relationship, along with the risk of “de-skilling” when routine cognitive tasks are delegated to AI systems [70]. AI-based tools should therefore be regarded as complementary: clinicians are encouraged to maintain a patient-centered approach and to use these systems to enhance—rather than replace—their clinical expertise [69, 71].
Data heterogeneity represents an additional major obstacle. Pollen monitoring networks, environmental and geographical factors, agricultural practices (e.g., irrigation), allergen panels, and classification methods vary widely across countries and regions. These discrepancies lead to inconsistent input data, which may compromise model performance, hinder cross-regional comparability, and limit generalizability [47, 71, 72]. Furthermore, population-representation biases persist: many AI models are developed primarily using adult datasets, reducing the reliability of predictions when applied to children or adolescents [69, 72].
Beyond cognitive, contextual, and adoption-related issues, the implementation of AI-enabled systems raises critical questions regarding privacy, ethics, and cybersecurity. Many applications rely on sensitive patient data—including personal information, geolocation, symptom and medication diaries, and detailed environmental exposure histories—to generate personalized alerts [47, 70, 71, 73–77]. If not properly secured or anonymized, such data pose clear privacy risks. Robust privacy-preserving strategies—including de-identification protocols, encrypted data storage, and differentiated access rights—are therefore essential. Synthetic data generation offers a particularly promising avenue for protecting individual privacy while still supporting model training and validation [71]. In parallel, adherence to regulatory frameworks such as the General Data Protection Regulation remains crucial to ensure responsible data governance. In addition, AI-based forecasting systems may underperform in heterogeneous populations and produce biased outputs related to gender or ethnicity, thereby potentially exacerbating inequities in healthcare delivery [69, 70, 73, 75].
To date, AI-based forecasting and patient alert tools have been evaluated predominantly by engineering and technical experts. Assessments have focused mainly on technological maturity and feasibility [47, 73, 78], forecasting accuracy [47, 57, 79, 80], predictive performance [76], and content-related features such as mapping, risk scale design, and system-generated health recommendations [81]. However, these metrics do not necessarily reflect clinical relevance or real-world benefit for patients and allergists.
Fostering synergy between technological innovation and clinical practice is therefore essential [69]. From a clinical perspective, a rigorous and critical appraisal of AI-based pollen tools is indispensable to ensure human-centered care [74]. Key evaluation criteria include clinical purpose and effectiveness, data quality, model transparency and explainability, ethical and security safeguards, and user-centered design and usability [71, 73, 75, 82]. Randomized trials, prospective studies, and real-world observational research—combined with systematic patient feedback—remain the gold standard for determining clinical utility [71, 77, 83]. Insights from everyday users, both patients and clinicians, may be particularly valuable for understanding adherence, perceived benefits, and real-world usability.
The future of pollen allergy management lies in precision forecasting and the seamless integration of technology into clinical practice. Precision forecasting will increasingly rely on the incorporation of individual immunological data and patient phenotypes into predictive models, supported by adaptive AI systems capable of learning from each patient’s unique patterns and responses. This evolution is likely to extend to “embedded AI” within smart medical devices such as inhalers and wearables, delivering highly personalized, real-time insights in support of precision medicine (Table 2).
Future avenues of AI in personalized pollen monitoring for allergic patients.
| Strategic area | Emerging opportunities | Expected impact on personalized care | Next steps |
|---|---|---|---|
| Explainable & trustworthy AI | Develop interpretable ML models that show why a forecast was generated (e.g., “high grass pollen due to yesterday’s wind + your location”).Clinician dashboards with confidence scores and data sources. | Builds trust among allergists; enables shared decision-making with patients; reduces “black-box” resistance. | Co-design interfaces with clinicians and patients. |
| Patient-centric data fusion | Combine symptom diaries, medication logs, smart inhaler data, wearables, and environmental sensors.Use federated learning to train models without centralizing sensitive data. | Enables individualized risk thresholds (e.g., “you react when grass pollen > 50 grains/m3 + ozone > 80 µg/m3”) | Standardize integrations between apps and clinical EHRs. |
| Real-time, hyperlocal sensing | Deploy low-cost, AI-powered sensors at home, work, or school.Integrate with street-level CAMS + weather + traffic data for < 100 m resolution forecasts.AI suggests optimal travel dates/destinations based on pollen forecasts. Recommends activity schedules (e.g., “run at 7 AM, not 5 PM, during grass peak”). | Shifts from city-level alerts to micro-environmental exposure mapping (e.g., “your garden vs. your office”). Integrates with smart home (air purifiers, window alerts). | Scale sensor networks via public-private partnerships.Embed ML on edge devices for real-time classification. Use geofencing + calendar synchronization for personalized alerts.Partner with travel, sports, and urban planning sectors. |
| Dynamic adaptation to climate change | Use DL models to learn evolving phenology (e.g., earlier birch bloom due to warming).Predict “surprise peaks” via anomaly detection (e.g., thunderstorm asthma triggers). | Forecasts remain accurate despite shifting seasons and extreme events; proactive care for high-risk patients. | Feed models with real-time satellite + ground sensor feedback loops.Integrate climate projections (IPCC, Copernicus) |
| Digital twins for allergy patients | Create virtual patient avatars that simulate responses to pollen + pollution + medication based on historical data.Simulate “what-if” scenarios (e.g., “What if you start AIT next month?”). | Enables predictive, adaptive treatment plansPersonalized timing for AIT, medication, or avoidance. | Integrate multi-omics (if available) + exposome data.Develop lightweight simulation engines for mobile use. |
| AI-augmented clinical consultations | AI pre-analyzes patient data before visit: highlights triggers, medication gaps, symptom patterns.Generates visual “pollen exposure timelines” for patient education. | Reduces consultation time; improves patient understanding and adherence; supports therapeutic education. | Integrate with EHRs.Train AI on clinical notes + structured symptom scores. |
| Equity & inclusivity in AI models | Train models on diverse populations (children, elderly, ethnic minorities, low-income areas).Offer multilingual, low-bandwidth, offline-capable apps. | Ensures personalized care for all patients, not just tech-savvy or urban users; reduces health disparities. | Partner with global allergology networks.Audit models for bias using fairness metrics. |
ML: machine learning; CAMS: Copernicus Atmosphere Monitoring Service; DL: deep learning; AIT: allergen immunotherapy.
Bridging the gap between technological innovation and real-world clinical practice will require strengthened collaboration among allergists, immunologists, engineers, data scientists, and epidemiologists, along with continuous training to ensure responsible and informed use of these tools. AI enables a proactive and personalized approach to pollen allergy management, and many of the necessary tools already exist. Their clinical adoption is now a key step to promote uptake by patients and to enable subsequent evaluation and refinement within a virtuous cycle of medical and scientific assessment [84–86]. Allergists are well-positioned to play a central role in guiding this technological transition, ensuring that AI-based solutions remain clinically relevant and useful, ethically aligned, and firmly centered on patient needs.
AASQA: approved air quality monitoring associations
AI: artificial intelligence
AIT: allergen immunotherapy
CAMS: Copernicus Atmosphere Monitoring Service
DL: deep learning
ML: machine learning
RNSA: Réseau National de Surveillance Aérobiologique
JG: Conceptualization, Methodology, Supervision, Validation. J Corriger, MT, PA, J Charpy, JB, NV, and IAM: Investigation, Data curation, Writing—original draft. J Charpy, J Corriger, JG, PA, MT, YC, NDM, and JTB: Writing—review & editing. All authors read and approved the submitted version.
JG reports speaker and travel support in the past 5 years from ALK, Stallergenes-Greer, Thermo Fisher Scientific, and Menarini outside the submitted work. J Corriger reports speaker and travel support in the past 5 years from ALK, Stallergenes-Greer, Thermo Fisher Scientific, and Menarini outside the submitted work. NV leads ongoing research projects involving Stallergenes-Greer and Pollensense. NV received remuneration from ALK, Stallergenes Greer, and Sanofi for expert services, conferences, or participation in symposiums. The other authors declare that they have no conflicts of interest relevant to this work.
Not applicable.
Not applicable.
Not applicable.
Not applicable.
Not applicable.
© The Author(s) 2026.
Open Exploration maintains a neutral stance on jurisdictional claims in published institutional affiliations and maps. All opinions expressed in this article are the personal views of the author(s) and do not represent the stance of the editorial team or the publisher.
Copyright: © The Author(s) 2026. This is an Open Access article licensed under a Creative Commons Attribution 4.0 International License (https://creativecommons.org/licenses/by/4.0/), which permits unrestricted use, sharing, adaptation, distribution and reproduction in any medium or format, for any purpose, even commercially, as long as you give appropriate credit to the original author(s) and the source, provide a link to the Creative Commons license, and indicate if changes were made.

Nhan Pham-Thi, Pascal Demoly
Alessandro Cinquantasei ... Marcello Albanesi
Jean-Pierre Besancenot, Laurent Mascarell
Nicolas Visez ... Romain Courault
Matthew C. Bell ... Allison J. Burbank
Natalia Rodríguez-Otero
