 Original Article

Affiliation:
1Laboratoire de Spectroscopie pour les Interactions, la Réactivité et l’Environnement (LASIRE), University of Lille, CNRS, UMR 8516, 59000 Lille, France
Email: nicolas.visez@univ-lille.fr
ORCID: https://orcid.org/0000-0001-8843-4660
Affiliation:
2Santé publique France (French National Public Health Agency), 59000 Lille, France
Affiliation:
3Santé publique France (French National Public Health Agency), 93200 Saint-Denis, France
Affiliation:
3Santé publique France (French National Public Health Agency), 93200 Saint-Denis, France
ORCID: https://orcid.org/0000-0003-1691-2357
Affiliation:
4Service des Urgences, Hôpital Saint-Antoine, Assistance Publique-Hôpitaux de Paris (AP-HP), 75012 Paris, France
5Faculté de Médecine, Sorbonne Universités, 75013 Paris, France
Affiliation:
6Association des Pollinariums Sentinelles de France, Nantes 44000, France
Affiliation:
1Laboratoire de Spectroscopie pour les Interactions, la Réactivité et l’Environnement (LASIRE), University of Lille, CNRS, UMR 8516, 59000 Lille, France
Affiliation:
1Laboratoire de Spectroscopie pour les Interactions, la Réactivité et l’Environnement (LASIRE), University of Lille, CNRS, UMR 8516, 59000 Lille, France
ORCID: https://orcid.org/0000-0001-9160-9919
Affiliation:
7Department of Mechanical Engineering, College of Engineering, Embry-Riddle Aeronautical University, Prescott, AZ 86301, USA
ORCID: https://orcid.org/0000-0003-1978-0484
Affiliation:
8INRAE, UR 546 BioSP, Site Agroparc, Avignon 84914, France
ORCID: https://orcid.org/0000-0002-0882-6013
Affiliation:
9UFR de Géographie, Université Paris 1 Panthéon-Sorbonne, CNRS, UMR 7533 LADYSS, 93322 Aubervilliers, France
ORCID: https://orcid.org/0000-0002-8796-2071
Explor Asthma Allergy. 2026;4:1009114 DOI: https://doi.org/10.37349/eaa.2026.1009114
Received: December 15, 2025 Accepted: January 27, 2026 Published: March 02, 2026
Academic Editor: Ignacio J. Ansotegui, Hospital Quironsalud Bizkaia, Spain
The article belongs to the special issue Climate Change, Allergy, and Immunotherapy
Aim: To describe the first major epidemic thunderstorm asthma (ETSA) event detected in France in June 2023.
Methods: Data on local meteorology, visits to the emergency room (ER) for asthma and hospitalization after a visit, aerobiological composition of the atmosphere (pollens and spores), phenological information on the flowering of grasses, and regional air pollution were collected, aggregated, and analyzed.
Results: The ETSA was centered on the Paris region. An excess of 1,900 emergency visits for asthma was recorded over the period 10, 11, and 12 June. The people most affected were men aged 14 to 44. The hospitalization rate following a visit to the ER for asthma increased to 13%. ER visits for asthma began at around 6 pm on 10 June, just after an intense gust (15 m/s) triggering a PM10 resuspension episode, and peaked at around 10 pm on 11 June. Concentrations of mold spores (Cladosporium and Ascosporium) rose sharply during the night of 10–11 June, at the same time as the intake peak. The ETSA occurred during the grass and Urticaceae pollen season, with pollen concentrations lower (< 100 pollen grains/m3) compared to the days preceding the event (> 200 pollen grains/m3). A fraction of the pollen was observed without cytoplasm, but there was no apparent link with the ETSA. Phenological observations in the Paris pollinarium showed that the ETSA coincided with the start of the Lolium perenne (ryegrass) pollen season.
Conclusions: Although the data collected did not allow the identification of a single cause for the occurrence of the ETSA, they pointed to multifactorial causes such as the occurrence of an ozone pollution episode, strong winds before the storm, an episode of resuspension of PM10 particles, the presence of broken pollen, and the significant increase in mold spores just after the stormy episode.
Since 1983, 26 epidemic thunderstorm asthma (ETSA) events have been recorded in the scientific literature [1]. Melbourne is the city most affected, with a total of 7 episodes recorded [2], and the 2016 episode was the most dramatic ever recorded in the world, resulting in 3,365 excess emergency room (ER) visits and 10 deaths attributed to the ETSA [1–3]. Other, less significant episodes may occur more frequently and have only been reported locally, without being widely disseminated to the international scientific community. This is the case for the only episode recorded in France so far that has been described in a national publication: a 560% increase in ER visits for asthma recorded from 7 to 10 June 2013 in Nantes during the grass pollination season [4].
ETSAs have been associated mainly with pollen grain breakage and allergen dispersion in the fine (respirable) fraction of atmospheric aerosol [5–8]. The role of mold spores remains a subject of debate in the scientific literature [9–11]; the same applies to the potential role that the electromagnetic situation could play in thunderstorm conditions [12] and the possible influence of atmospheric pollution [6, 13]. The appearance of asthma symptoms and bronchospasm implies that allergens can penetrate deep into the respiratory system [14]. This deep penetration requires aeroallergens to be dispersed in the fine fraction of atmospheric aerosol. The primary mechanisms by which pollen grains break up and cause allergens to be dispersed include breakage following pollen hydration, exposure to high levels of relative humidity, or mechanical impact through impaction on hard surfaces during air transport [12, 15, 16].
Part of the international scientific community is concerned about the possibility of an increase in the frequency or amplitude of ETSA over the coming decades. The rapid worldwide increase in the prevalence of allergic rhinitis over the last few decades could lead to an increase in the number of ETSA [17], as the population potentially at risk increases. Climate change has also been associated with an increase in the occurrence of ETSA [18]. In our deregulated climate, atmospheric concentrations of allergens are increased for certain allergenic plant species such as grasses and ragweed [18, 19]. Climate change is also leading to an increase in intense weather events, including thunderstorms [20].
Setting up a system to monitor conditions conducive to an ETSA is a public health issue. The large influx of people suffering from asthma into the ER contributes to delays in treatment and exacerbation of cases, which can lead to a serious condition or even death [13, 21]. An early warning of at least 24 hours before an ETSA can, at the very least, enable pharmaceutical stocks for treating bronchospasm to be checked and healthcare workers to be prepared. Australia is a leader in this field, having established the first forecasting system [8, 15, 22]. There are still many unknowns about the conditions that favor the occurrence of an ETSA. Local differences likely exist between different regions of the world, and even that different causes of ETSA co-exist [10, 23, 24]. Setting up an ETSA alert system requires as much information as possible to be recorded when an ETSA occurs.
This study aimed to provide information related to an ETSA that occurred in the Paris region on 10 and 11 June 2023. This major episode affected more than 1,900 patients and was the first reported in France with such a significant impact. The event is described in terms of local meteorological information, admissions to the ER for asthma, the aerobiological composition of the atmosphere (pollen and spores), phenological information on the flowering of grasses, and regional air pollution.
There are 229 hospitals in the Paris region (including 122 ERs), managing more than 10,000 ER visits every day. The admissions in ER are part of an emergency department surveillance system (OSCOUR®) used for health monitoring and epidemiological surveillance purposes and managed by Santé publique France (https://www.santepubliquefrance.fr/surveillance-syndromique-sursaud-R/reseau-oscour-R). The OSCOUR network covers around 85% of ER visits in the Paris region. The causes of ER visits are subject to a standard classification with coding of the diagnostic elements. For this study, the syndromic group (SG) “asthma”—which includes the following International Classification of Diseases, 10th revision (ICD-10, https://www.cdc.gov/nchs/icd/icd-10-cm/index.html) diagnostic codes: J45, J450, J451, J458, J459, J46—was used, and ER admissions for this SG were aggregated by day, for three age groups (< 15, 15–44, and > 44 years) and for all ERs in the region. Admissions to the hospital after a visit to the ER for asthma were aggregated for all age groups for the entire region. All health data collected for this study were anonymous.
At the time of the ETSA, the national aerobiological monitoring network (https://www.pollens.fr/) had three Hirst-type samplers in operation in the Paris region. The three samplers are located at altitudes between 8 and 21 m and comply with good installation and operating practices (Norme NF EN 16 868). In brief, these samplers have an air suction rate of 10 L/min, which enables the collection and acceleration of pollen grains, followed by sedimentation on a cellophane strip [25]. After staining with fuchsin, the pollen grains were identified and counted on the strips taken from the 3 samplers (3 vertical transects). Spores were identified and counted on 2 samplers (1 vertical transect). Some slides were reanalyzed to look for signs of pollen grain rupture or pollen emptied of its cytoplasmic content using light microscopy. Pollen grains without their cytoplasmic content were counted on the Hirst slides (Paris station) collected during the ETSA event and the week before.
The city of Paris has a garden (pollinarium) for observing the phenological stages of allergenic plants, managed by the Association des Pollinariums Sentinelles de France (https://web.alertepollens.org/) and located in Paris intramuros. In particular, this garden features a collection of six grasses (Anthoxanthum odoratum, Arrhenatherum elatius, Dactylis glomerata, Holcus lanatus, Lolium perenne, Phleum pratense), with approximately twenty plants of each species collected in the Paris region. Daily observations were made to record the start and end dates of pollination for each plant.
Measurement data for ozone, nitrogen oxides, and particulate matter with aerodynamic diameters less than 10 µm (PM10) were obtained from Airparif, a non-profit organization accredited by the Ministry of Environment to monitor the air quality in the Paris region (https://data-airparif-asso.opendata.arcgis.com/). Hourly data were averaged for ozone (n = 24 sensors), nitrogen oxides (n = 34), and PM10 (n = 19).
Weather variables (temperatures, precipitation, winds) are provided by the French Weather Monitoring Network (Météo France; https://meteo.data.gouv.fr/). Three weather stations were chosen:
The Eiffel Tower station, to monitor high altitude variability of temperatures, precipitation, and winds (330 m altitude, latitude: 48°51'30" North, longitude: 2°17'40" East);
The Longchamp station at 27 m altitude (latitude: 48°51'17" North, longitude: 2°14'01" East);
The Montsouris station at 75 m altitude (latitude: 48°49'18" North, longitude: 2°20'16" East).
All time-series data are provided in UTC (Coordinated Universal Time), with a temporal resolution of one hour. Explored atmospheric variables include:
Temperature (°C) under shelter (averaged over one hour, min recorded within the hour, max recorded within the hour);
Total of rainfall in one hour (mm);
10 meters wind speed (m/s) averaged over 10 minutes;
10 meters max wind speed (m/s) averaged over 10 minutes;
Relative humidity (%), averaged in one hour, min, and max.
Saturday, 10 June 2023, was characterized by barometric doldrums over France with an area of low pressure over the near Atlantic and a weak ridge of high pressure over Scandinavia. The surface wind was weak, coming from the east. The atmosphere became more unstable in the afternoon because of daytime heating (minimum temperatures of 19°C and maximum temperatures of 31°C). At the end of the day, temperatures fell by 7°C between 4 and 6 pm, and there were thundery showers during the night (rainfall < 1 mm). A few gusts of wind occurred in Paris, reaching a maximum speed of 16.9 m/s between 6 and 7 pm (Eiffel Tower station, Figure 1). Similarly, the end of Sunday was marked by showers (total 10 mm, Longchamp station, Figure 1) and gusty winds with a maximum speed of 16.9 m/s around 7 pm (Figure 1). Relative humidity peaked on the night from Saturday to Sunday at around 5 am at 95% and on the night from Sunday to Monday at around 1 am at 97% for 3 hours (Figure 1).
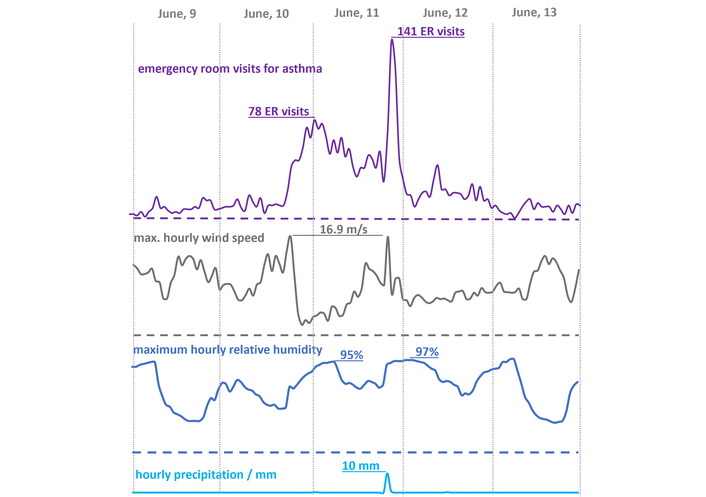
ER visits and weather conditions on 9 to 13 June 2023. A maximum hourly wind speed in m/s (Météo-France Tour Eiffel station) and rainfall in mm/h on 10 and 11 June 2023 (Longchamp station). ER: emergency room.
Admissions to the ER for the asthma SG started to increase on Saturday, 10 June 2023, at 6 pm (Figure 1). Activity in the ER gradually decreased during Sunday, 11 June, but remained at a high level with the highest peak at the end of the day (around 10–11 pm). The number of admissions for asthma SG on 10, 11, and 12 June were 400, 1,461, and 522 patients, respectively, giving a total of 2,383 ER visits for asthma on the three days of the ETSA (Figures 1 and 2). This corresponds to an average of 794 visits per day during the ETSA, whereas the 3-day moving average in 2023 for asthma was 155 visits per day (Figure 2). If we subtract the 2023 3-day moving average of asthma visits (155 patients per day) from the total of visits during the 3 days of the ETSA, the number of asthma visits to the ER is 1,918 patients in excess in the Paris region.
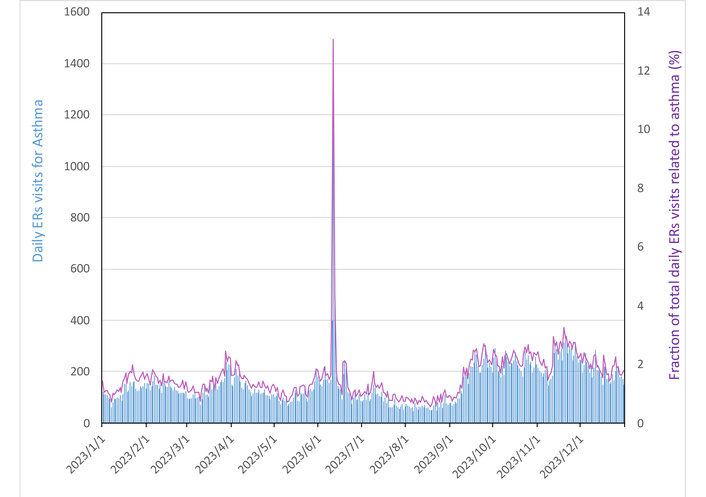
Daily number of admissions to hospital ER with a diagnosis of asthma, all ages combined (blue) and fraction of total admissions for asthma (purple), for the Paris region over the whole of 2023 (OSCOUR data, Santé Publique France). ER: emergency room.
During the 3 days of the ETSA, a sharp increase in hospital admissions was also observed following visits to the ER for asthma. Indeed, of the 2,383 ER visits for asthma, 320 (13.4%) were followed by hospitalization, representing a more than 300% increase in daily hospitalizations for asthma compared to the previous four weekends.
Male patients represented 63% of asthma visits during the ETSA, while female patients accounted for 37% (compared to 55% and 45%, respectively, for the whole of 2023). Young adults (15–44 years) were the largest age group, accounting for 56.4% of the total, compared with 22.5% for those aged 2–14 years and 21% for those aged 45 and above. The average age of patients admitted to the ER was 32 for men and 28 for women.
The annual pollen integral (APIn) of grass pollen fluctuates from year to year (Figure 3). The APIn for 2023 was 2,268 pollen grains/day/m3, slightly lower than the average for the last 20 years (2,695 pollen grains/day/m3).
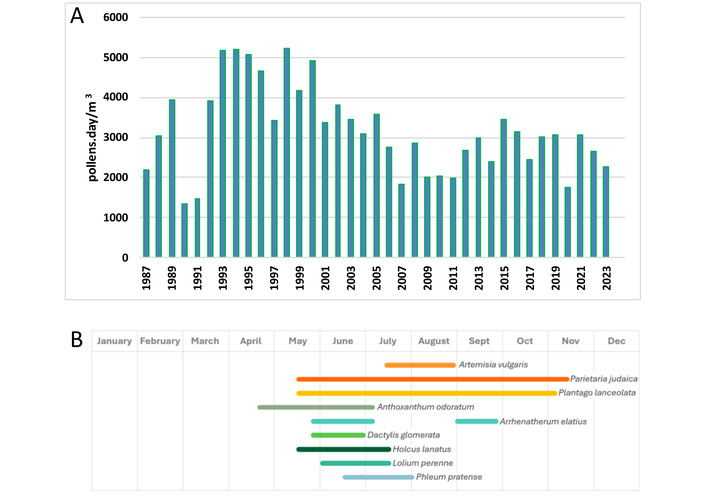
Annual pollen count of Poaceae in Paris from 1987 to 2023. (A) Data from Réseau National de Surveillance Aérobiologique and phenological observations carried out in Paris in 2023 for grasses; (B) data from the Association des Pollinariums Sentinelles de France.
In 2023, the ETSA occurred at the height of the Poaceae and Urticaceae pollen season (Figure 4). Saturday 10th and Sunday 11th June correspond to a relative minimum in pollen concentrations. Higher concentrations of Poaceae and Urticaceae pollen were observed for several days before the ETSA, particularly at the Antony sampler, with daily concentrations sometimes exceeding 200 pollen/m3 for each family.
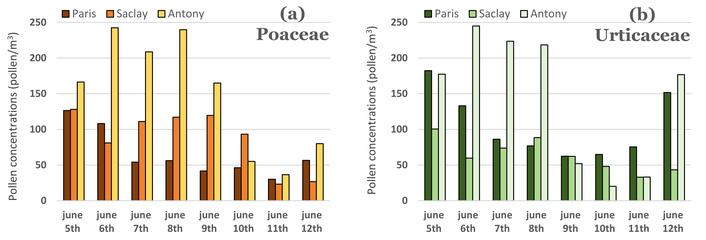
Changes in daily pollen concentrations of Poaceae (a) and Urticaceae (b) for the three samplers evaluated (Paris, Saclay, Antony).
Observations using light microscopy can only be used to determine whether the pollen belongs to the grass family, but cannot be used to identify the species. Phenological observations made it possible to eliminate pollen from Phleum pratense, which was not pollinating at the time of the ETSA. The five other grasses monitored were in flower (Anthoxanthum odoratum, Arrhenatherum elatius, Dactylis glomerata, Holcus lanatus, Lolium perenne). It should be noted that the ETSA corresponds to the start of the Lolium perenne pollen season.
Before the ETSA, a large proportion of pollen was empty of its cytoplasmic content (estimated at a maximum of 30%); however, the ETSA days show fewer empty pollen grains (estimated to be less than 10%).
On 11 June, there was a sharp increase in the concentration of Ascosporium spores compared with previous days (Figure 5A and 5B). This peak began at Saclay at the end of the day on 10 June and reached its peak in the middle of the day on 11 June. The two measurement sites (Paris and Saclay) gave very contrasting ascospore concentrations despite their proximity (19 km). The concentration of Cladosporium spores increased gradually from 9 to 12 June (Figure 5C).
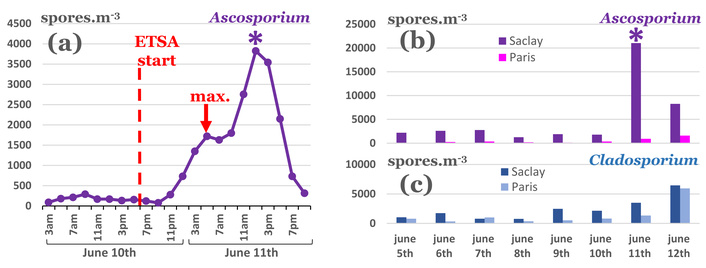
Spore concentrations during the ETSA. (a) Changes in Ascosporium concentrations at the Saclay site (sliding average over 6 hours). (b) Changes in daily concentrations of Ascosporium spores. (c) Changes in daily concentrations of Cladosporium spores. ETSA: epidemic thunderstorm asthma.
On Saturday (the 10th), ozone reached a maximum concentration of 99–105 µg/m3 (average over 24 sensors) during the afternoon between 12 am and 5 pm (Figure 6). Similarly, on Sunday (the 11th), ozone peaked at 90–95 µg/m3 between 1 pm and 7 pm. Ozone concentrations of 130 µg/m3 were recorded locally. NOx concentration rose throughout 10 June, reaching a maximum of 54 µg/m3 at 11 pm (hourly average for 34 sites). PM10 concentrations had a first rise from 15 to 22 µg/m3 on Saturday between 4 and 7 pm, followed by a worsening of this pollutant concentration on Sunday, with peaks in the afternoon reaching 28 µg/m3 at 2–3 pm and 25 µg/m3 at 8 pm (Figure 6).
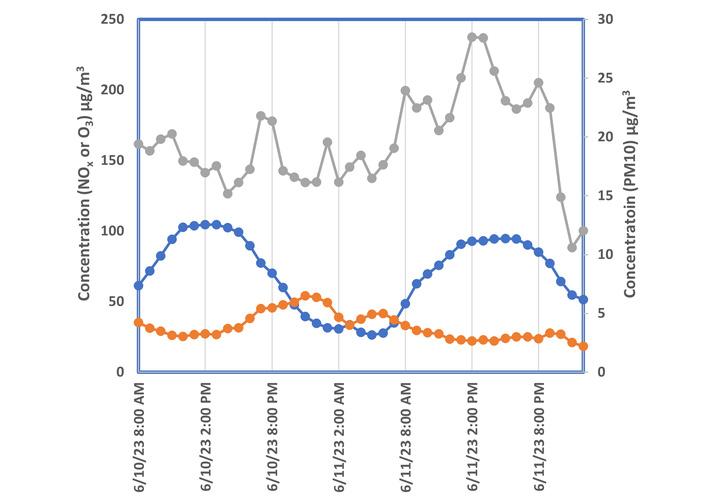
Air pollution trends in the Paris region during the ETSA: ozone O3 (blue), nitrogen oxides NOx (orange), and PM10 (gray) (AIRPARIF data). ETSA: epidemic thunderstorm asthma; PM10: particulate matter with aerodynamic diameters less than 10 µm.
In June 2023, the Paris region was affected by an unprecedented ETSA in France, with an excess of 1,900 patients admitted to the ER for asthma over three days. This ETSA corresponds to the start of the Lolium perenne pollen season. The ETSA in Nantes (France) in 2013 also coincided with the start of the pollen season for this grass [4]. All seven ETSAs in Melbourne occurred when ryegrass (Lolium perenne) pollination was at its peak [26].
We can roughly estimate that this ETSA affected 1.5 grass allergy sufferers out of 1,000 in the Paris region (1,900 patients admitted to ER for 1.3 million allergy sufferers). This estimate was done considering that the prevalence of allergic rhinitis in France is ~33% and 50% of cases are for pollen allergy (i.e., a prevalence of pollen allergy is ~16% in the general French population) [17], and that, according to recent data for France, 63% of pollen allergy sufferers have a grass allergy [27], the Paris region (population of 12.2 million, https://www.insee.fr/fr/statistiques/1893198#), would have ~2 million grass pollen allergy sufferers, including ~1.3 million grass allergy sufferers.
This estimate would necessarily be a default estimate because only ER asthma admissions were considered, whereas data from Melbourne suggest that the population affected with mild symptoms is probably much larger [28, 29]. It should be noted that generally the characteristics and outcomes of patients with ETSA are poorly documented, and long-term consequences are suspected, particularly on asthma control [30]. The profile of the population most affected in Paris (male 18–44) has already been observed, for example, in Minneapolis-St. Paul (USA) [31], and at the ETSA in Melbourne in 2016 [3].
The atmospheric conditions in the Paris region were not exceptional at the time of the ETSA. It is therefore legitimate to ask why this episode is the first of this magnitude. The occurrence of an ETSA in Paris is not directly correlated with an increase in APIn of grasses. Indeed, the pollen integral for Poaceae in Paris has shown a decreasing trend over the long term (1987–2023) and has remained fairly constant, despite interannual fluctuations, since 2006 (Figure 3A). However, the prevalence of allergic rhinitis has risen sharply in France, from 4% of the general population in 1968 to 33% in 2021 (Table 1) [32–34]. Considering our calculation that the ETSA in June 2023 affected 1.5 allergic individuals out of 1,000, it is possible to roughly estimate the number of visits for an ETSA by knowing the number of individuals with grass pollen allergy (Table 1). For example, in the 70’s, when the number of people allergic to grass pollen was estimated at 110,000 (Table 1), an ETSA would result in around 172 admissions to the ER in the Paris region as a whole. An episode on such a small scale can go unnoticed, especially as these visits are spread across dozens of ERs throughout the region. This calculation provides a fairly simple explanation of why reports of ETSA worldwide only began to appear in the early 1980s: the scale of an ETSA would be proportional to the population allergic to grass pollen. The increase in the population at risk, combined with the effects of climate change on the occurrence and violence of storms, means that ETSA are probably an emerging public health threat [1].
Historical trends in the population of the Ile-de-France region and in the prevalence of allergic rhinitis and grass pollinosis in the general population in France, estimated burden on ER services for an ETSA episode of the same magnitude as that of June 2023 [32–34].
| Year | Population of Paris region (× 106) | AR prevalence | Grass pollen-induced AR prevalence | Patients with grass pollen allergy (× 106) | Estimated ER visits for asthma per ETSA |
|---|---|---|---|---|---|
| 1968 | 9.2 | 4% | 1% | 0.11 | 164* |
| 1982 | 10.1 | 10% | 3% | 0.32 | 480* |
| 2006 | 11.5 | 31% | 10% | 1.13 | 1,671* |
| 2023 | 12.3 | 33%** | 10% | 1.28 | 1,900 |
*: Extrapolation from prevalence on 11 June 2023 ETSA; **: prevalence data for year 2021. AR: allergic rhinitis; ER: emergency room; ETSA: epidemic thunderstorm asthma.
The data from our study show that the meteorological, physical-chemical, and aerobiological characteristics of the atmosphere in the Paris region underwent profound changes before and during the ETSA. These sometimes very rapid fluctuations make it difficult to understand the causes of the rise in ER attendance. The first ER influx of patients at 6 pm on Saturday afternoon (June 10) does not appear to be linked to mold spores, as their concentrations in the air are similar to those of the previous days. The first intake peak occurred immediately after three notable events: a rapid and sharp increase in wind speed (gusts reaching 16.9 m/s), an increase in PM10, and a moderately elevated concentration of ozone in the afternoon. The peak in particles is most likely an episode of resuspension of sedimented particles following wind gusts. The second influx of patients peaked around 4 am on the night of 10 to 11 June. It coincided with a sharp rise in the atmospheric concentration of ascospores, from a mean value of 160 spores/m3 on 10th June before 10 pm to 1,721 spores/m3 at 5 am on 11th June morning and 3,825 spores/m3 on 11th June afternoon. It should be noted that, for unknown reasons, the two pollen samplers gave very different concentrations of spores in the atmosphere (an average difference of a factor of 20); the two sensors were run with the same protocols but had different altitudes (Paris at 21 m and Saclay at 8 m). A second major PM10 peak also occurred at around 11 pm, but this occurred 5 hours before the second influx of patients. A doubling of the daily concentration of Cladosporium spores, from 1,259 to 2,419 spores/m3, was associated with an increase in ER admissions for asthma in Ontario [9]. In the study by Dales et al. (2003) [9], the increase in asthma visits was only 15% at most, well below the increase observed in the Paris region in 2023, which is nevertheless characterized by much higher levels of Ascosporium spores (20,000 spores/m3). The third peak occurred at 8 pm on 11 Sunday, concomitantly with a second gust of wind occurring 26 hours after the first one. Pollen of Urticaceae was higher on the 12th (Figure 4), while that of Poaceae remained low, and spores were on a sharp decrease.
The three peaks in ER activity (one at 6 pm on 10 June and the others at 4 am and 8 pm on 11 June) could have different causes. Peaks occurred at times when the atmosphere was in very different conditions and with rapidly changing aerobiological conditions. Another explanation could be that some patients reacted to the same stimuli but with a delay, and that the high number of spikes reflects a different susceptibility in patients. The data presented in this article are insufficient to definitively determine the causes of the ETSA episode in Paris. We can only support the recommendation that further studies are needed to better understand the role of mold spores in ETSA [10]. In particular, gaining information from patients’ records who attended the ER during the ETSA could provide valuable insights regarding their allergies, health conditions, and locations at the time of the storm.
The observation during the Paris episode of two sudden increases in wind speed, up to 16.9 m/s, is a feature shared with the Melbourne episode, where the wind reached 25 m/s [3]. These gusts were followed in the Paris region by an increase in PM10. The resuspension of sedimented particles in an urban environment depends on the nature of the particles (in particular their size), the speed of the wind gusts, and the urban layout, which can modulate resuspension locally [35]. Modeling work has shown that resuspension begins for winds of around 7 m/s, and for winds exceeding 14 m/s, resuspension occurs almost throughout the entire city [35]. During the ETSA in Melbourne in 2016, the maximum wind speed reached 25 m/s, and PM10 concentrations exceeded very high values of between 590 and 943 µg/m3 [3].
Short-term exposure to PM10 and PM2.5 particles can increase the risk of severe asthma attacks requiring ER care or even hospitalization [36, 37], and PM can also exacerbate symptoms of allergic reaction to pollen [38, 39]. It is also certain that pollen is deposited on the ground in cities, since a large proportion of the pollen emitted can only be transferred to the atmosphere within a few tens of meters [40, 41]. The resuspension of pollen is largely undocumented, and recent computational fluid dynamics (CFD) modeling efforts in this area have been conducted [35, 42–44].
Depending on wind speed, during a resuspension episode, certain areas of the city may experience high concentrations of particles and pollen [35]. The existence of areas at risk (high concentrations) for pollen has been demonstrated through modeling based on the configuration of buildings, their position, and distance from pollen sources [44, 45]. We propose a new mechanism to explain the occurrence of an ETSA, in addition to the hypotheses currently predominant in the literature [12]. This new mechanism focuses on the deposition and resuspension of pollen in urban environments. An ETSA could therefore be the result of a prior warm period during which the deposition of particles and pollen is favored by atmospheric stability. After this deposition stage, a thunderstorm episode preceded by gusts reaching at least 7 m/s [35, 42] would trigger an episode of strong resuspension of pollen and particles, causing aggravation of asthma and bronchospasm in some people allergic to pollen and/or spores. If the ETSA occurs during a period when sporulation is imminent, the favorable conditions of the storm (e.g., particularly warm rain for ascospores [46]) can trigger sporulation and increase the number of people in respiratory distress. The strength of an ETSA (i.e., the number of people affected) would ultimately depend on several parameters, including the duration of the pre-deposition period, the speed of the gusts before the storm, and the presence of conditions conducive to sporulation. A role for an ozone episode before the storm cannot be ruled out, either through its effect on allergens and pollen, or its irritating effect on the respiratory tract [1, 47]. In the 2023 event in Paris, ozone concentrations of 130 µg/m3 were recorded locally, and a similar episode of ozone pollution was observed in Melbourne in 2016 (~90 µg/m3) [1].
In summary, the multiplicity of parameters presented here may explain both the rarity of ETSA and the difficulty in modeling and predicting these events. It is also possible that this mechanism of a sudden resuspension episode combines with the pollen rupture mechanisms well documented in the literature [6].
The quantities of pollen in the Parisian atmosphere were lower at the time of the ETSA than on previous days. This drop can be easily explained for 11 June by pollen washing and less favorable conditions for pollination following the storm. The drop observed on 9–10 June is more enigmatic. We did not observe a pollen peak during the resuspension episode of 10 June between 5 and 6 pm, indicating that if pollen is resuspended, it does not reach the samplers located at an altitude of 25 m on the roofs of buildings. 2D CFD modeling of resuspension in an urban environment reveals that the majority of PM10 remains in the street canyon, where they are resuspended, with a small proportion reaching the height of building roofs (approximately 10 m) [42]. The maximum speed (12.5 m/s) used in the work of Linda et al. [42] is close to the wind speed observed in the Paris region during the ETSA, so the absence of pollen measurements at the height of the samples is compatible with a strong episode of pollen resuspension. In future studies, it is essential to better characterize pollen resuspension. Not only are the conditions poorly understood experimentally, but the resuspended pollen may also have suffered mechanical stress through crushing or particulate contamination of its surface [48].
A large proportion of pollen was empty of its cytoplasmic content on the days before the ETSA (estimated at a maximum of 30%), but the ETSA days show less empty pollen (10%). These pollen grains can be emptied of their content at the time of slide preparation and are therefore an unreliable indicator of pollen grain rupture under storm conditions. Ruptured pollen grains were observed on the Hirst-type samplers’ slides of 10 and 11 June. However, the number of pollen grains observed was too low to give a quantitative idea of the presence of these broken pollen grains compared with intact pollen. In contrast with our data, a 250% increase in ruptured grass pollen grains was observed at the 2016 Melbourne ETSA [1].
The environmental data (aerobiology, pollution, meteorological conditions) collected in this study do not provide a precise explanation of the causes of the Paris ETSA, which saw 1,900 patients flock to the ER for asthma over a three-day period. However, certain observations, such as a sudden increase in wind speed observed just before the surge in ER visits, suggest that this event could be the trigger. This is why we suggest that the resuspension of pollen and PM in an urban environment just before a thunderstorm may create conditions that expose individuals to a mixture of allergens and fine particles, which play a role in triggering bronchospasm. The occurrence of a major sporulation episode during the night, when ER attendance was high, is consistent with an exacerbation of the observed pathologies and suggests a role for mold spores in the ETSA.
This study highlights the challenges of aerobiology in explaining the occurrence of ETSA following the event. ER physicians are currently conducting a detailed clinical study of the profiles of the 2,383 patients who visited the ER during the Paris ETSA in June 2023, and will provide additional findings crucial to understanding this ETSA. Environmental data play a major role in predicting these events. For the Paris region, the warning criteria would be the presence of grasses in the air (including at concentrations far from seasonal maxima), a period of hot, dry weather followed by a thunderstorm episode. A gust of wind and a sudden increase in PM10 levels in the late afternoon are major warning criteria, but they are too late to issue an effective alert to the ER influx. ERs require at least 24 hours to prepare, and in particular, to check and, if necessary, replenish stocks of consumables and medication for treating bronchospasm.
APIn: annual pollen integral
CFD: computational fluid dynamic
ER: emergency room
ETSA: epidemic thunderstorm asthma
PM10: particulate matter with aerodynamic diameters less than 10 µm
SG: syndromic group
NV thanks Cloé Mandon (RNSA) for the microscopic analyses. NV would like to thank the Service Parisien de Santé Environnement and the Association pour la Prévention de la Pollution Atmosphérique for their logistical assistance in recovering the slides. NV would like to thank CEA Saclay for operating the Hirst-type sampler.
NV: Investigation, Conceptualization, Supervision, Formal analysis, Visualization, Writing—original draft, Writing—review & editing. VP: Supervision, Investigation, Visualization, Writing—review & editing. ACP: Investigation, Conceptualization, Writing—review & editing. M Conte: Investigation. CLG: Investigation, Supervision. SP: Investigation. NA: Investigation. M Choël: Investigation, Writing—review & editing. PR: Investigation, Writing—review & editing. AS: Investigation, Supervision. RC: Investigation, Supervision, Writing—original draft, Writing—review & editing. All authors read and approved the submitted version.
NV benefited from financial support from Stallergenes Greer (medical writing, scientific research project, and conference), ALK (conference), and Opella (Scientific expertise). Other authors declare that they have no conflicts of interest.
Not applicable.
Not applicable.
Not applicable.
The data analyzed in this study were obtained from AIRPARIF directly from https://www.airparif.fr/airparif/nos-donnees. Health data can be obtained on demand from https://www.health-data-hub.fr/catalogue-de-donnees/oscour-organisation-de-la-surveillance-coordonnee-des-urgences. Meteorological data are publicly available https://donneespubliques.meteofrance.fr/. Aerial biological data are available publicly https://www.data.gouv.fr/datasets/donnees-historiques-de-surveillance-des-pollens-et-des-moisissures.
The APSF would like to thank the city of Paris for its financial support. NA, MCh, and NV thank the Région Hauts-de-France, the Ministère de l’Enseignement Supérieur et de la Recherche, and the European Fund for Regional Economic Development for their financial support to the CPER ECRIN. MCh and NV thank the Institut de Recherches Pluridisciplinaires en Sciences de l’Environnement (IREPSE Fed 4129) for financial support. The CaPPA project (Chemical and Physical Properties of the Atmosphere) is funded by the French National Research Agency (ANR) through the PIA (Programme d’Investissement d’Avenir) under contract ANR-11-LABX-005-01. The funders had no role in study design, data collection and analysis, decision to publish, or preparation of the manuscript.
© The Author(s) 2026.
Open Exploration maintains a neutral stance on jurisdictional claims in published institutional affiliations and maps. All opinions expressed in this article are the personal views of the author(s) and do not represent the stance of the editorial team or the publisher.
Copyright: © The Author(s) 2026. This is an Open Access article licensed under a Creative Commons Attribution 4.0 International License (https://creativecommons.org/licenses/by/4.0/), which permits unrestricted use, sharing, adaptation, distribution and reproduction in any medium or format, for any purpose, even commercially, as long as you give appropriate credit to the original author(s) and the source, provide a link to the Creative Commons license, and indicate if changes were made.

View: 2115
Download: 34
Times Cited: 0
Nhan Pham-Thi, Pascal Demoly
Alessandro Cinquantasei ... Marcello Albanesi
Jean-Pierre Besancenot, Laurent Mascarell
Matthew C. Bell ... Allison J. Burbank
Jeremy Corriger ... Julien Goret
