 Review

Affiliation:
1Former Réseau National de Surveillance Aérobiologique (RNSA), 83470 Saint-Maximin la Sainte-Baume, France
ORCID: https://orcid.org/0000-0001-6019-401X
Affiliation:
2Innovation & Science Department, Stallergenes Greer, 92160 Antony, France
Email: laurent.mascarell@stallergenesgreer.com
ORCID: https://orcid.org/0000-0001-7199-0345
Explor Asthma Allergy. 2026;4:1009107 DOI: https://doi.org/10.37349/eaa.2026.1009107
Received: November 14, 2025 Accepted: December 25, 2025 Published: January 29, 2026
Academic Editor: Ignacio J. Ansotegui, Hospital Quironsalud Bizkaia, Spain
The article belongs to the special issue Climate Change, Allergy, and Immunotherapy
There is unequivocal evidence that the climate is changing, and it is generally accepted that the trend will continue. Climate change is relevant to public health, as it can lead to alterations in the distribution and flowering phenology of plants and to changes in pollen exposure, with subsequent impacts on human health. The primary objective of this paper was to provide a quantitative synthesis of the available literature on the evolution of pollen season intensity and timing in plants with a higher allergenic potential. Six botanical families have been studied: Betulaceae (birch, hazel, alder), Cupressaceae, Oleaceae (olive, ash), Poaceae, Urticaceae, and Asteraceae (mugwort, ragweed). Three main indicators of the potential impact of climate change on pollination have been retained: the pollen integral, the start date of the pollen season, and the duration of the pollen season. The outcome is a dominant trend toward earlier and more abundant pollen seasons, particularly for trees that flower in winter and spring. In contrast, trends for grass or weeds that pollinate later are less consistent and often region-specific. The variations recorded are taxon-, site-, and period-dependent, with some species even showing opposing trends within the same botanical family, illustrating the complex interactions between biological adaptation and climatic variability. While the current influence of climate change on pollen production and phenology is well established, the magnitude of its future impact remains uncertain, and the diversity of methodologies and study durations limits the comparability of available data. Nevertheless, most projections support a continued, though possibly attenuated, increase in pollen intensity and season advancement. In any case, when combined with likely qualitative and quantitative changes in the concentration of allergens in pollen grains, the identified trends may already have, and will very likely continue to have, an impact on both allergic sensitizations, the prevalence of seasonal symptoms, and their severity, thus affecting their diagnosis, prevention, and treatment.
“The effect of climate change on pollen is not simple”—Buters JTM. Impacts of climate change on allergenicity. In: Impacts of Climate Change on Allergens and Allergic Diseases. 2016. p. 76.
“…because the influence of climate change is complex, there is no predictable quantitative assessment of how climate change may affect the levels of pollen allergy in humans in the future”—Choi YJ et al. The Impact of Climate Change on Pollen Season and Allergic Sensitization to Pollens. Immunol Allergy Clin North Am. 2021. p. 98.
Although there remain substantial unknowns regarding its exact mechanisms and scale, there is practically no longer any doubt about the reality of climate change, nor about its origin at least partly anthropogenic [1]. This complex phenomenon began slowly during the Industrial Revolution in the mid-19th century, accelerated worldwide from the 1990s onwards, and is expected to further escalate in the future, making it one of the greatest challenges facing humanity in the 21st century [2]. Its main symptoms are rising average temperatures, stronger and longer heat waves, as well as changes in precipitation patterns, with fluctuations both upward and downward in their frequency, abundance, duration, and spatial extent depending on geographical area, but also with an increase in the intensity of different extreme weather events such as thunderstorms, torrential rains, and episodes of severe drought [3]. The decade from 2011 to 2020 was the hottest on record, and the trend has continued to strengthen in the early 2020s, with global surface temperatures breaking records year after year. Under such conditions, the most pessimistic scenarios predict an average global warming of approximately 5°C by the end of the 21st century compared to the reference period of 1850–1900.
Since Wilkinson’s landmark paper in 1989 [4], a growing number of peer-reviewed research papers have emphasized that the combined effects of elevated temperatures and increased carbon dioxide levels stimulate plant growth and reproduction, while disrupting the life cycle of vegetation with usually earlier, prolonged, and more robust flowering seasons [5–7]. To date, apart from a few Korean studies, the majority of publications and those based on the most reliable methodologies have focused on Europe and North America. Their interest is not limited to naturalistic aspects, but also pertains equally to the health sector. Indeed, for trees, grasses, and weeds that release allergenic pollen, changes in the characteristics of pollination, both in its abundance and timing, may already have, and will continue to have, significant consequences on the prevalence and severity of allergies [8, 9]. Two other potential impacts of climate change have been described as likely to either worsen or reduce allergies, depending on the context. One relates to an increase or, in other cases, a decrease in the allergen content of pollen grains [10]; however, unlike pollen concentrations, there is still no routine detection and quantification of the allergens in pollen grains, nor of the allergen content of the air. The other refers to the frequent shift towards higher latitudes and elevations in the spatial distribution of at least some wind-pollinated species, whether they are wild or cultivated [11]. For instance, simulations have shown that, by 2085, changes in temperature and precipitation could lead to modifications in vegetation types across 31 to 42% of Europe [12], with the obvious implication that when the range of an allergenic species expands or contracts, the risk of allergy is profoundly altered.
Without claiming to be exhaustive, which would far exceed the scope of an article, this work will provide an objective overview and a quantitative synthesis of the available literature on the evolution of the pollen season intensity and timing of plants with a higher allergenic potential. The focus will primarily be on the last few decades, but attention will also be given to projections concerning the most foreseeable future, roughly until the years 2040–2060.
The three bibliographical databases Medline®, PubMed®, and Google Scholar® were searched from inception until August 15, 2025, to identify studies published in peer-reviewed journals, conference proceedings, or books that have investigated the impact of ongoing and future climate change on allergenic pollen. The following search string was used, with some modification as necessary (e.g., ~ instead of * in Google Scholar®): (climat* change OR warming OR carbon dioxide OR trend) AND (pollen OR flower* OR sensitization). Additional articles or book chapters were also retained when they were cited in the previously selected publications.
After removing duplicates, the full texts of all studies deemed potentially relevant based on their titles were assessed to determine their eligibility. Four inclusion criteria were used for this purpose:
Studies were required to be available online in the English language. A subsequent query of the databases led to the inclusion of five more references published in French and one in Spanish, because they provided important data for which, to our knowledge, there is no equivalent in any English-language publication. All of them contained an abstract in English.
They had to relate to one or more European or North American sites and provide quantitative data on changes over time in the intensity and/or seasonality of pollen counts.
The data sets analyzed should not show too many missing values (in any case, less than 10%), and cover a period of at least 15 years, to smooth out the influence of inter-annual and decadal variability of pollen data. The collection of airborne biological particles would be performed using a volumetric spore trap of the Hirst design, which is the most used method for air sampling in all European countries and is gradually becoming so in the United States [13, 14]. Nevertheless, some exceptions were made for an outstanding Georgian publication that utilized the Rotorod® rotary impact sampler, as well as four others that used both types of devices. Furthermore, for projections into the future, seven articles based on numerical modelling, three on phenology, two on laboratory simulations, and two involving several of these methods simultaneously were considered eligible.
Finally, the taxa selected had to belong to one of the six botanical families recognized as the most relevant for allergies in the considered areas, according to item (2), (Betulaceae, Cupressaceae, Oleaceae, Urticaceae, Poaceae, and Asteraceae) or to specific genera within these families (birch, hazel, alder, olive, ash, mugwort, and ragweed).
Although other potential indicators of the impact of climate change on pollination can be found in the literature, such as the end date of the pollen season or the date and intensity of the annual peak, only the three most studied parameters have been retained here, for which the terminology recommended by European and international aerobiology authorities [15] has been adopted. These three parameters are (1) the pollen integral (PIn), which, expressed in number of grains per cubic meter of air, is obtained by summing the daily pollen counts for the entire year or the main pollen season; (2) the pollen season start date (PSS, calculated based on the number of days elapsed since January 1st); and (3) the pollen season duration (PSD, corresponding to the number of days that separate the beginning and end of the season).
For each eligible study, the following data were extracted and compiled, taxon by taxon, in large tables: reference in brackets and year of publication, location of the study and number of monitoring stations involved, study period, investigation method, trend identification technique, temporal trends observed successively for PIn, for PSS, and for PSD. Long-term trends were presented in a standardized form (increase or decrease in the number of grains or the number of days per decade), and their statistical significance was noted as calculated by the authors (p < 0.05, p < 0.01, or p < 0.001). When boxes are left empty in the tables, it means that the parameter in question has not been studied in the article analyzed, without the authors specifying the reasons; this applies especially to the statistical significance of the results presented. Simple linear regression was by far the most used statistical method for trend analysis in the reviewed publications. It has been quite often supplemented by the non-parametric Mann-Kendall test with the Theil-Sen slope estimator for detecting the presence of monotonic upward or downward temporal trends, as these tools are considered the most robust for heterogeneous time series data. Spearman’s rank correlation analysis was also regularly performed to determine possible relationships between the meteorological data recorded before and during the main pollen season and the aerobiological variables described for each taxon. Bayesian statistics have sometimes also been used to highlight discontinuities within the series and quantify the direction and speed of changes. However, many other statistical methods have been applied (e.g., reduced major axis linear regression, seasonal-trend decomposition procedure based on LOESS technique, canonical correlation analysis, etc.), so that it was not possible to differentiate the trends based on the method used, which varies too much from one study to another.
In the temperate regions of the Northern Hemisphere, pollen from the Betulaceae family is almost always both the most abundant and the primary cause of respiratory allergies that occur in late winter or early spring. However, given that this pollen can be easily identified at the genus level under optical microscopy, only three studies [16–18], which are moreover incomplete, have focused on the family level. They report (Table 1 and Figure 1) a pollen production that is strengthening over time (up to +1,400 grains/m3 per decade in Emilia-Romagna [16]) and beginning increasingly earlier, although these trends are not predominantly significant and no clear conclusions can be drawn about the PSD.
Temporal trends in pollination of the Betulaceae family.
| Reference (publication date) | Region (number of sites) | Study period | Methodology | Trend identification technique | PIn (grains per cubic meter of air per decade and significance) | PSS (days per decade and significance) | PSD (days per decade and significance) |
|---|---|---|---|---|---|---|---|
| Betulaceae | |||||||
| [16] (2016) | N Italy (1) | 1990–2004 | Hirst-type | Linear regression | + (~1,400) | No trend | |
| [17] (2023) | Central Europe | 1951–2015 | Phenological observations | Linear regression | – | ||
| [18] (2014) | Europe (13) | 1990–2009 | Hirst-type | Linear regression | + (* in 2 out of 13 sites, ns in the other 11) | – (** in 3 of 8 sites, ns in the other 5) | + or – (* in 2 of 8 sites, ns in the other 5) |
| Betula | |||||||
| [16] (2016) | N Italy (1) | 1990–2004 | Hirst-type | Linear regression | + | – | Slightly + (1.3) |
| [17] (2023) | Central Europe | 1951–2015 | Phenological observations | Linear regression | – (1.9) | ||
| [19] (2022) | United Kingdom (6) | 1995–2020 | Hirst-type | Linear regression | + (*) | – (ns) at 5 of the 6 sites | |
| [20] (2010) | NW Italy (1) | 1981–2007 | Hirst-type | Linear regression | + (*) | – (10.0) | No trend |
| [21] (2020) | S Germany (1) | 1988–2018 | Hirst-type | Linear regression & least squares fit | Slightly + | – (~2) | – (0.7) |
| [22] (2019) | France (7) | 1987–2018 | Hirst-type | Linear & polynomial regression | + (209 to 1,263) | – until 2002, + thereafter | – almost everywhere (2.4 to 5.7) |
| [23] (2021) | Central Germany (4) | 1998–2017 | Hirst-type | Cochran-Armitage test for trend | Slightly + (ns) | ||
| [24] (2005) | Austria (2) | 1980–2001 | Hirst-type | Linear regression | + (~125 in valley area, ~350 at higher altitude) | – (4.0 in valley area, 7.3 at higher altitude) | |
| [25] (2018) | Brussels (1) | 1982–2015 | Hirst-type | Local regression method (LOESS) | + | ||
| [26] (2003) | Switzerland (1) | 1979–1999 | Hirst-type | Linear regression | Very slightly + (ns) | – (9.5; *) | No trend |
| [27] (2025) | Texas, USA (1) | 2009–2023 | Hirst-type | Least square regression | + (0.7; **) | ||
| [28] (2021) | Benelux (5) | 1981–2020 | Hirst-type | Linear regression | + in 4 sites of 5, but * in only 2 | – in all sites, but * in only 1 | – but variable and ns |
| [29] (1993) | London | 1961–1990 | Hirst-type | Linear regression | + (especially after 1975) | – | No trend (very strong inter-annual variation) |
| [30] (2014) | Catalonia (8) | 1994–2011 | Hirst-type | Linear regression + non-parametric test | Very slightly + (ns) | ||
| [31] (1998) | Basel (1) | 1969–1996 | Hirst-type | Linear regression | + (*) | No trend | |
| [32] (2000) | Basel (1) | 1969–1998 | Hirst-type | Linear regression | + (~1,700; *) | ||
| [33] (2008) | Basel (1) | 1969–2006 | Hirst-type | Linear regression | + (978; *) | – (~3.9, especially since the end of the 1970s; *) | – |
| [34] (2008) | Switzerland (3) | 1969–2007 | Hirst-type | Linear regression | + (from 1969 to 1990), then – in Basel | – (1.7 to 3.6) | |
| [35] (2021) | Basel (1) | 1969–2020 | Hirst-type | Linear regression | + (~190) | – (~1.9) | |
| [36] (2016) | Spain (12) | 1994–2013 | Hirst-type | Linear regression | + (ns, but ** in Ourense) | ||
| [37] (2021) | Basel (1) | 1969–2018 | Hirst-type | Linear regression | + (ns) | – (~2; *) | – (~0.74; ns) |
| [38] (2021) | Switzerland (14) | 1990–2020 | Hirst-type | Linear regression + LOESS | + (*) | No trend | |
| [39] (2024) | NW Spain (3) | 1995–2023 | Hirst-type | Linear regression + non-parametric test | + (*) | Slightly – | |
| [40] (2018) | Brussels (1) | 1982–2015 | Hirst-type | Linear regression + Mann-Kendall test | + (ns) | – (ns) | |
| [41] (2019) | Switzerland (6) | 1985–2014 | Hirst-type | Bayesian statistics | + but – in recent years in 4 of 6 sites | ||
| [42] (2011) | Germany (10) | 1988–2009 | Hirst-type | Linear regression + Mann-Kendall test | + in NE and S | Slightly + in S | |
| [43] (2024) | United Kingdom (2) | 1970–2021 | Hirst-type | Generalized additive model for time series | + | No trend | |
| [44] (2016) | Stockholm (1) | 1973–2013 | Hirst-type | Linear regression | + (~1,000; ns) | – (~3.7; ***) | No trend |
| [45] (2011) | S Poland (1) | 1991–2008 | Hirst-type | Linear regression | + (*) | No trend | |
| [46] (2002) | Denmark (2) | 1977–2000 | Hirst-type | Linear regression | + (~1,150 to ~2,000) | – (6.2, ** in Copenhagen; 5.2, ns in Viborg) | + (2.3, ns in Copenhagen; 6.1, ** in Viborg) |
| [47] (2021) | Bavaria (8) | 1989–2018 | Hirst-type | Linear regression | + (ns, but * in Munich) | – (*) | |
| [48] (2021) | Bavaria (28) | 1975–2100 | Hirst-type & modelling | Linear regression | + initially, then – in lowlands (< 800 m) and + in highlands | ||
| [49] (1995) | Europe (5) | 1976–1993 | Hirst-type | Linear regression | + (*** in Basel, London, and Leiden; ns in Vienna and Stockholm) | ||
| [50] (2003) | W Europe (5) | 1968–2001 (partly) | Hirst-type | Linear regression | + in the 5 sites (* in Leiden, ** in Derby) | ||
| [51] (2024) | NE Italy (20) | 2006–2022 | Hirst-type | Theil-Sen estimator | Very slightly + | No trend | + (4.3) |
| [52] (2021) | France (6) | 1987–2021 | Hirst-type | Variable | + (~440) | – until 2002, + thereafter | |
| [53] (2009) | Finland (1) | 1974–2004 | Hirst-type | Linear regression & smoothing | + (*) | – (4; *), especially during later years | No trend |
| [54] (2014) | USA (6) | 1994–2011 | Growing degree hour model | Linear regression | + in 3 sites, – in 2 sites; ns everywhere | – in 4 out of 6 sites, slightly + in the other 2; but in all cases ns | Generally – (up to ~10), but * only in Newark |
| [55] (2015) | USA (50) | 1994–2010 | Unspecified | Linear regression | + in 5 of the 9 regions (54.6 in the W); – in the S (47.2) | – in 59% of the 50 studied sites and in 7 of the 9 climate regions (1.5 to 8.8, * in all cases) | – (up to 8.1 in 4 of the 9 regions; * in S, SE, NE and NW) |
| [56] (2012) | Europe (97) | 1977–2009 (partially) | Hirst-type | Linear regression | + (***) | ||
| [57] (2020) | N & Central Italy (9) | 2000–2016 | Hirst-type | Non-parametric Mann-Kendall test | No trend | No trend | – |
| [58] (2020) | Basel (1) | 1969–2018 | Hirst-type | Linear regression | No trend | – (~2) | |
| [59] (2021) | Georgia, USA (1) | 1992–2018 | Rotorod | Linear regression | No trend | – (4.8) | + (3.5) |
| [60] (2025) | Lithuania (3) | 2005–2023 | Hirst-type | Linear regression + Mann-Kendall test | No trend | – (0.5 to 6; ns) | Slightly + (ns) |
| [61] (2021) | Austria (1) | 1993–2017 | Hirst-type | Linear regression | No trend | ||
| [62] (2025) | N Italy (1) | 1997–2023 | Hirst-type | Linear regression | – (ns) | + (13.5; ***) | – (9.3; **) |
| [63] (2024) | Switzerland | 1990–2023 | Hirst-type | Unspecified | – from 1990 to 2000, + from 2000 to 2015, then – again | No trend | |
| [64] (2016) | USA (9 regions) | 2000–2050 | Modelling | Unspecified | – in most climate regions in 2047–2050 compared to 2001–2004 | – in the NW, NE, & W | – in 8 of the 9 regions |
| [65] (2013) | Europe + USA (5) | 2000–2040 | Modelling | Bayesian analysis | + (~2,450 to 3,320) | – (~4.75 to 5) | |
| 2000–2060 | Modelling | Bayesian analysis | + (~2,570 to 3,920) | – (~3.3 to 3.5) | |||
| 2000s–2090s | Modelling | Unspecified | – (1.3) | ||||
| [66] (2001)[67] (2002) | Europe | 1969–1998 | Phenological observations | Unspecified | – (2.7; *) | ||
| [68] (2001) | Switzerland (1) | 1980–1997 | Hirst-type | Linear regression | – (10.6; *) | ||
| [69] (1997) | United Kingdom (3) | 1954–1995 | Hirst-type | Linear regression | – (~5) | ||
| [70] (2002) | Europe (6) | 1970–2000 | Hirst-type | Linear regression | – in Belgium (6.3, *), in Switzerland (~10 after 1986, *), in UK (8.4 after 1982); no trend in Turku; + in Kevo (~15); + in Vienna until 1984, – thereafter (~11) | ||
| [71] (2007) | Europe (10) | 1970–2004 | Hirst-type | Linear regression | Significantly – in Turku, Zürich, London, Vienna, and Brussels; slightly – in France; no trend in Poland; + in Kevo | ||
| [72] (2010) | Lithuania (3) | 1970–1999 | Hirst-type | Linear regression | – (~3 to 5; *) | ||
| [73] (2002) | W of the NL (1) | 1969–2000 | Hirst-type | Linear regression | – (3.1; *) | ||
| 2000s–2090s | Modelling | Unspecified | – (1.3) | ||||
| [74] (2025) | Iberian Peninsula (12) | 1994–2023 | Hirst-type | Linear regression | + (3.3) | ||
| [75] (2013) | Central and S United Kingdom (3) | 1970–2010 | Hirst-type | Linear regression + distance weighted smoothing technique | – in the 1980s and early 1990s, then + | ||
| [76] (2014) | Ireland | 1990s–2030s | Process-based phenological model | Linear regression | – (on average, 0.75, more in the NE than in the SW) | ||
| Corylus | |||||||
| [16] (2016) | N Italy (1) | 1990–2004 | Hirst-type | Linear regression | – | No trend | – (~14 to 15) |
| [17] (2023) | Central Europe | 1951–2015 | Phenological observations | Linear regression | – (3.1) | ||
| [23] (2021) | Central Germany (4) | 1998–2017 | Hirst-type | Cochran-Armitage test for trend | Sightly + (ns) | ||
| [24] (2005) | Austria, in valley area (1) | 1980–2001 | Hirst-type | Linear regression | + (~850) | – (8.1) | |
| [25] (2018) | Brussels (1) | 1982–2015 | Hirst-type | Local regression method (LOESS) | + | ||
| [26] (2003) | Switzerland (1) | 1979–1999 | Hirst-type | Linear regression | + (ns) | No trend | No trend |
| [28] (2021) | Benelux (5) | 1981–2020 | Hirst-type | Linear regression | + (* in 2 sites of 5) | – (* in 4 sites of 5) | No trend |
| [30] (2014) | Catalonia (8) | 1994–2011 | Hirst-type | Linear regression + non-parametric test | No trend | ||
| [31] (1998) | Basel (1) | 1969–1996 | Hirst-type | Linear regression | + (**) | – | |
| [32] (2000) | Basel (1) | 1969–1998 | Hirst-type | Linear regression | + (~450; *) | ||
| [35] (2021) | Basel (1) | 1969–2020 | Hirst-type | Linear regression | + (~240) | ||
| [37] (2021) | Basel (1) | 1969–2018 | Hirst-type | Linear regression | + (248; ***) | – (4.5; *) | + (3.5; *) |
| [38] (2021) | Switzerland (14) | 1990–2020 | Hirst-type | Linear regression + LOESS | + (985 to ~1,093; *) | – (*) | – (*) |
| [40] (2018) | Brussels (1) | 1982–2015 | Hirst-type | Linear regression + Mann-Kendall test | + (*) | – (ns) | |
| [41] (2019) | Switzerland (6) | 1985–2014 | Hirst-type | Bayesian statistics | + | ||
| [42] (2011) | Germany (10) | 1988–2009 | Hirst-type | Linear regression + Mann-Kendall test | + | Slightly + in S | |
| [44] (2016) | Stockholm (1) | 1973–2013 | Hirst-type | Linear regression | + (~24; **) | – (~5.1; ns) | – (2.1; ns) |
| [45] (2011) | S Poland (1) | 1991–2008 | Hirst-type | Linear regression | + (***) | No trend | |
| [51] (2024) | NE Italy (20) | 2001–2022 | Hirst-type | Theil-Sen estimator | + (1,089) | – (7.3) | No trend |
| [56] (2012) | Europe (97) | 1977–2009 (partially) | Hirst-type | Linear regression | + (***) | ||
| [57] (2020) | N & Central Italy (9) | 2000–2016 | Hirst-type | Non-parametric Mann-Kendall test | No trend | – | No trend |
| [58] (2020) | Basel (1) | 1969–2018 | Hirst-type | Linear regression | + (~300) | – (~5) | |
| [61] (2021) | Austria (1) | 1993–2017 | Hirst-type | Linear regression | No trend | ||
| [62] (2025) | N Italy (1) | 1997–2023 | Hirst-type | Linear regression | + (331; *) | – (4.7; *) | + 0.6 (*) |
| [63] (2024) | Switzerland | 1990–2023 | Hirst-type | Unspecified | + (~412) | – (~5) | |
| [81] (2007) | Thessaloniki (1) | 1987–2005 | Hirst-type | Linear regression | + (~120) | No trend | No trend |
| [82] (2024) | Rome (1) | 1997–2016 | Hirst-type | Linear regression | No trend | ||
| [83] (2002) | Central Italy (1) | 1982–2001 | Hirst-type | Linear regression | + (1.0; ns) | No trend | |
| Alnus | |||||||
| [16] (2016) | N Italy (1) | 1990–2004 | Hirst-type | Linear regression | – | Slightly – | – |
| [17] (2023) | Central Europe | 1951–2015 | Phenological observations | Linear regression | – (3.6) | ||
| [23] (2021) | Central Germany (4) | 1998–2017 | Hirst-type | Cochran-Armitage test for trend | No trend | ||
| [24] (2005) | Austria (2) | 1980–2001 | Hirst-type | Linear regression | + (~1,100 in valley area, ~3,000 at higher altitude) | – (4.7 in valley area, 6.0 at higher altitude) | |
| [25] (2018) | Brussels (1) | 1982–2015 | Hirst-type | Local regression method (LOESS) | + | ||
| [26] (2003) | Switzerland (1) | 1979–1999 | Hirst-type | Linear regression | + (*) | No trend | No trend |
| [28] (2021) | Benelux (5) | 1981–2020 | Hirst-type | Linear regression | + (*) in 4 sites of 5 | – in 3 sites of 5, but * in only 2 | + in 4 sites of 5, but * in only 1 |
| [32] (2000) | Basel (1) | 1969–1998 | Hirst-type | Linear regression | + (~1,100; *) | ||
| [37] (2021) | Basel (1) | 1969–2018 | Hirst-type | Linear regression | + (~480; **) | – (ns) | – (ns) |
| [38] (2021) | Switzerland (14) | 1990–2020 | Hirst-type | Linear regression + LOESS | – | ||
| [40] (2018) | Brussels (1) | 1982–2015 | Hirst-type | Linear regression + Mann-Kendall test | + (*) | – (ns) | |
| [42] (2011) | Germany (10) | 1988–2009 | Hirst-type | Linear regression + Mann-Kendall test | + in NE and S | – in NW (1.4) | + in NW |
| [44] (2016) | Stockholm (1) | 1973–2013 | Hirst-type | Linear regression | + (~30.5; ns) | – (~2.4; ns) | – (~1.1; ns) |
| [45] (2011) | S Poland (1) | 1991–2008 | Hirst-type | Linear regression | No trend | No trend | |
| [47] (2021) | Bavaria (8) | 1989–2018 | Hirst-type | Linear regression | + | – | |
| [51] (2024) | NE Italy (20) | 2006–2022 | Hirst-type | Theil-Sen estimator | + (326) | – (4.4) | No trend |
| [56] (2012) | Europe (97) | 1977–2009 (partially) | Hirst-type | Linear regression | + (***) | ||
| [57] (2020) | N & Central Italy (9) | 2000–2016 | Hirst-type | Linear regression + non-parametric Mann-Kendall test | + (*) | – (*) | |
| [60] (2025) | Lithuania (3) | 2005–2023 | Hirst-type | Linear regression + Mann-Kendall test | No trend | – (6.5 to 17; *) | No trend in Siauliai and Klaipeda, + (> 5.0) in Vilnius |
| [61] (2021) | Austria (1) | 1993–2017 | Hirst-type | Linear regression | No trend | ||
| [81] (2007) | Thessaloniki (1) | 1987–2005 | Hirst-type | Linear regression | + | No trend | No trend |
| [83] (2002) | Central Italy (1) | 1982–2001 | Hirst-type | Linear regression | + (2.0; ns) | No trend | |
| [84] (2023) | NW Spain (1) | 1993–2018 | Hirst-type | Linear regression | + (1,120; **) | + (ns) | + (ns) |
| [85] (2021) | Slovakia (1) | 2002–2019 | Hirst-type | Linear regression + Mann-Kendall test | + | – | |
| [86] (2020) | Andalusia (3) | 1994–2017 | Hirst-type | Linear regression | + (* in Granada, ns elsewhere) | + in Córdoba (*) and Málaga (**), ns in Granada | |
The grey backgrounds correspond to studies that have made projections about the future. +: trend towards increased pollen concentration (PIn), earlier onset of pollination (PSS), or longer pollen season (PSD); –: trend towards decreased pollen concentration (PIn), later onset of pollination (PSS), or shorter pollen season (PSD); *: p < 0.05; **: p < 0.01; ***: p < 0.001. PIn: pollen integral; PSS: pollen season start date; PSD: pollen season duration; N: north; ns: non-significant; NW: northwest; S: south; LOESS: locally estimated scatterplot smoothing; NE: northeast; W: west; SE: southeast; SW: southwest; NL: Netherlands.
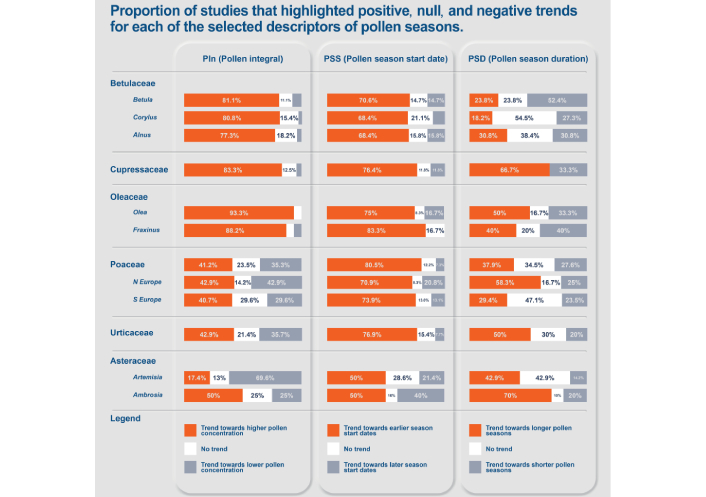
Proportion of studies that highlighted positive, null, and negative trends for each of the selected descriptors of pollen seasons. N: north; S: south.
However, there is strong evidence that pollination of all trees in this family has not always evolved in the same way over recent decades.
The genus that has been most studied for its sensitivity to climate change is Betula (birch). More than 80% of publications devoted to Betula report a trend towards increasing airborne pollen concentrations, and this rise has proven to be statistically significant in approximately two-thirds of cases [16, 19–56]. The trend often remains weak, not exceeding, for example, 50 grains per cubic meter of air over ten years in the Veneto region [51], but it sometimes reaches much higher levels (+1,263 grains/m3 per decade in Picardy [22], or even +1,700 in Basel, but based on a series that ends in 1998 [32]). The rare exceptions, whether they consist of an absence of trend [57–61] or a downward trend [47, 54, 55, 62], are almost never significant and pertain to regions where the density of birch trees is low, such as North Dakota [54], often at the meridional boundary of the Betula forest distribution (in Parma for example [62] or in the Southern United States [55]).
It should be emphasized, however, that the trends highlighted here are often of statistical value only, as they depend heavily on local conditions. Thus, while the combined analysis of six sites in the United Kingdom suggests a clear increase in annual birch pollen production (p < 0.01), the situation is different when considering these same sites separately: the trend is then only significant for two of them, in the Midlands, and Wales even records a marked decline [19]. A similar observation was made in Switzerland, where, in recent years, four of the six studied sites experienced notable decreases and the other two equally large increases [41]. It must also be noted that, in a given location, the trend is not always monotonous, i.e., constant in magnitude and even in sign throughout the period under consideration; the example of Switzerland is again very illustrative, with a decline in PIn until 2000, an increase from 2000 to 2015, and then a further decrease [63].
The potential change in birch pollen production over the coming decades has been little investigated, to the extent that only three publications meeting the above-defined inclusion criteria could be identified [48, 64, 65]. Moreover, their conflicting results call for caution. Indeed, a modelling system incorporating a meteorology model, a pollutant emission model, a pollen emission model, and an air quality model, used to simulate the spatiotemporal distributions of Betula pollen in the Continental United States, predicted concentrations for the years 2047–2050 almost everywhere lower than those of the years 2001–2004 [64]. On the contrary, Bayesian models developed to describe the effects of climate change on birch pollen in the Northeastern US suggested that annual production under different scenarios would be 2.2 to 2.6 times higher in 2040 than the mean values for 2000 (and 2.8 to 3.9 times higher in 2060) [65]. Finally, a study conducted in Bavaria showed that the question has to be addressed on a smaller scale: if climate change is likely to initially lead to an increase in airborne pollen, trees located at low altitudes will then suffer heat stress that will reduce their pollen emission, while those at higher altitudes should benefit from the warming and produce more pollen [48].
Consensus is much greater on the seasonality of birch pollination, and particularly on its start date, which is occurring increasingly earlier, with an advance of less than one day to more than ten days per decade [16, 19–22, 24, 26, 28, 29, 33, 35, 37, 40, 47, 51, 53–55, 58–60, 66–73]. The two cases of Parma (Italy) and Kevo (Finland) should be set apart: in the first [62], the pollen season showed a highly significant delay (p = 0.002) of more than one month (exactly 36.5 days) over the last 27 years, but in an area where this tree is not very common, as evidenced by a PIn not exceeding 747 grains/m3; in the second [70, 71], the delay was 15 days in ten years, but at a very high latitude (over 67°N) where the trend is towards increasingly cold springs. Other exceptions [31, 38, 42–44, 51, 57, 63, 74] are rare, of small magnitude, and non-significant.
Several studies, however, note that the trend towards earlier birch pollination, which was undeniably evident at the beginning of the analyzed series, often at the end of the 20th century, has since slowed down, been reversed, or even annulled. This is particularly evident in Paris, where the 16-day delay observed between 2003 and 2018 more than offset the 11-day advance that characterized the period from 1987 to 2002 [22, 52]. The phenomenon has also been described, for example, in Central and Southern England [75]. The suggested explanation is that, to break their dormancy and subsequently initiate flowering, catkin-bearing trees must sequentially fulfil their requirements for cold (vernalization) and then for warmth (forcing). Excessive mild weather at the end of autumn or during winter can thus extend the vernalization period, prolong dormancy, delay the forcing phase, and consequently lead to a delay (or reduced advancement) in pollination [5, 17, 76–80]. This is presumably the reason that led one of the very few authors to have addressed the subject [73] to predict, at least, a slowdown in the trend towards an earlier birch pollen season: this trend, which was 3.1 days per decade from the 1970s to the 1990s, is expected to fall to an average of 1.3 days in the 21st century. Other simulations consulted [64, 65, 76] confirm that Betula would continue to begin pollination progressively earlier, though at a slower rate than in recent decades.
We will refrain from making any definitive statements regarding the PSD of the birch. Out of 21 studies that have determined its evolution, 11 concluded that it was shortening (often slightly and insignificantly, but by up to 9.3 days in ten years—again in Parma), 5 concluded that it was lengthening, and the other 5 were unable to identify any trend.
Much less research has been devoted to studying changes in the pollen seasons for other trees belonging to the Betulaceae family, particularly hazel and alder, even though they contain allergens that cross-react with those of birch and can therefore exert a priming effect whereby repeated exposure to different pollen taxa may trigger explosive allergic symptoms, even at very low doses.
A preliminary remark is necessary about Corylus (hazel tree), which pollinates very early, in some places as early as December of the previous year. Pollen counts for this species are therefore somewhat questionable due to the date, which varies greatly from year to year, when the pollen samplers are activated, even for the same site. As a result, one misses an uneven part of the pollen season for this Betulaceae, which could skew any detection of trend. However, the results presented by the various publications reviewed are sufficiently consistent for the risk to be minimal.
Thus, out of 26 publications addressing this point, 21 report an upward trend in hazel pollen concentrations [23–26, 28, 31, 32, 35, 37, 38, 40–42, 44, 45, 51, 56, 58, 62, 63, 81], at a rate that sometimes exceeds 1,000 grains/m3 over ten years [38, 51]. Among the exceptions [16, 30, 57, 61, 82], only one [16] reports a decline. Similarly, the trend towards earlier pollen release is clearly predominant (in 13 out of 19 papers [17, 24, 28, 31, 37, 38, 40, 44, 51, 57, 58, 62, 63], while only 2 mention a delay [42, 83] and 4 detect no trend [16, 26, 45, 81]). Conversely, one should refrain from drawing any conclusions regarding the length of the pollen season, with only 2 studies reporting an increase [37, 62], 3 reporting a decrease [16, 38, 44], and 6 detecting no trend [26, 28, 51, 57, 81, 83].
The marked shift towards higher pollen counts in the air observed for birch and hazel is confirmed for Alnus (alder), with 17 publications pointing in this direction [24–26, 28, 32, 37, 40, 42, 44, 47, 51, 56, 57, 81, 84–86], compared with one reporting declining pollen concentrations [16] and four finding no clear trend [23, 45, 60, 61]. The increasing precocity of the pollen season is also found in 13 out of 19 articles [16, 17, 24, 28, 37, 38, 40, 42, 44, 47, 51, 60, 85], with the three cases of delayed season onset all occurring in Mediterranean climates [83, 84, 86]. And, once again, no trend emerges regarding the PSD, which remained at least partially stable in five studies [26, 51, 60, 81, 83], prolonged at least partially in four [28, 42, 60, 84] and diminished in four others [16, 37, 44, 57].
The Cupressaceae family includes a significant number of species that are cultivated as ornamental plants in urban environments; other species occur naturally. Although pollen allergy from this family was considered a rarity until around 1975, especially in Europe, it is now recognized as an indisputable clinical entity in many regions, such as the Mediterranean basin, Texas, or New Mexico [87]. However, one should be cautious about the fact that the various studies analyzed here are not strictly comparable. Indeed, the pollen grains from Cupressaceae are difficult to differentiate under the light microscope at the species or genus level, and also difficult to distinguish from those of the Taxaceae or Taxodiaceae because of their close morphological similarity. In routine pollen counts, all these taxa are usually grouped under the name Cupressaceae-Taxaceae but, while some authors do use this designation, others refer to a specific genus, Cupressus (cypress), for instance, [20] or Juniperus (juniper) [27], without specifying how it has been identified, or remain vague concerning the content they ascribe to the term Cupressaceae.
Despite the diversity of species classified as Cupressaceae, most of the pollen collected in the aerobiological traps comes from one or another variety of cypress: other ornamental species are less abundant, and their periodical pruning eliminates many of their flowers, while wild species pollinate with less intensity, and usually grow far away from sampling sites. Furthermore, the general trends (Table 2 and Figure 1) are sufficiently strong to leave virtually no room for doubt. Thus, the PIn is oriented upwards in 83.3% of the 24 publications dealing with this point [20, 26, 27, 36, 37, 47, 51, 56, 62, 74, 81, 86, 88–95], often with a highly significant progression exceeding 2,000 grains/m3 per decade in Basel [37], as well as in Milan [88] and in Oklahoma [92], or even 5,000 in Southern Spain [91] and 8,500 in Granada [74]. It is sometimes noted that the trend has accelerated after 2001 [88] or after 2012 [89]. While three studies concluded that there was no clear trend [57, 78, 96], only one reported a significant local decline in Málaga [86].
Temporal trends in pollination of the Cupressaceae family.
| Reference (publication date) | Region (number of sites) | Study period | Methodology | Trend identification technique | PIn (grains per cubic meter of air per decade and significance) | PSS (days per decade and significance) | PSD (days per decade and significance) |
|---|---|---|---|---|---|---|---|
| [20] (2010) | NW Italy (1) | 1981–2007 | Hirst-type | Linear regression | + (*) | – (3.3) | + (6.7) |
| [26] (2003) | Switzerland (1) | 1979–1999 | Hirst-type | Linear regression | + (*) | – (12.9; *) | No trend |
| [27] (2025) | Texas, USA (1) | 2009–2023 | Hirst-type | Least square regression | + (20.5; *) for Juniperus | ||
| [36] (2016) | Spain (12) | 1994–2013 | Hirst-type | Linear regression | + at 7 sites out of 12 | ||
| [37] (2021) | Basel, Switzerland (1) | 1969–2018 | Hirst-type | Linear regression | + (~2,050; ***) | – (~5.5; **) | + (~4.4; **) |
| [47] (2021) | Bavaria (8) | 1989–2018 | Hirst-type | Linear regression | + | – | |
| [51] (2024) | NE Italy (20) | 2001–2022 | Hirst-type | Theil-Sen estimator | + (916) | – (8.8) | + (8) |
| [56] (2012) | Europe (97) | 1977–2009 (partially) | Hirst-type | Linear regression | + (***) | ||
| [57] (2020) | N & Central Italy (9) | 2000–2016 | Hirst-type | Non-parametric Mann-Kendall test | No trend | – | No trend |
| [62] (2025) | N Italy (1) | 1997–2023 | Hirst-type | Linear regression | + ns | – ns | + ns |
| [73] (2002) | W of the NL (1) | 1969–2000 | Hirst-type | Linear regression | – (6.25, **) for Juniperus | ||
| 2000s–2090s | Modelling | Unspecified | – (0.8) | ||||
| [74] (2025) | Iberian Peninsula (12) | 1994–2023 | Hirst-type | Linear regression | + (1,745 on average, but up to 8,535 in Granada) | Slightly + (1.6) | |
| [81] (2007) | Thessaloniki (1) | 1987–2005 | Hirst-type | Linear regression | + (~1,435) | No trend | No trend |
| [82] (2024) | Rome (1) | 1997–2016 | Hirst-type | Linear regression | No trend | ||
| [86] (2020) | Andalusia, Spain (3) | 1994–2017 | Hirst-type | Linear regression | – in Málaga, + in Granada (***), ns elsewhere | – in Granada (***) and Málaga (*), ns in Córdoba | |
| [88] (2021) | Milan, Italy | 1995–2017 | Hirst-type | Unspecified | + (2,100, especially after 2001) | ||
| [89] (2024) | Madrid region (10) | 1994–2022 | Hirst-type | Linear regression | + (especially after 2012) | ||
| [90] (2024) | N Italy (1) | 1989–2018 | Hirst-type | Linear regression + Mann-Kendall test | + (***) | + (**) | |
| [91] (2016) | S Spain (1) | 1996–2010 | Hirst-type | Linear regression + local regression method (LOESS) | + (5,670; ***) | ||
| [92] (2021) | Oklahoma, USA (1) | 1996–2020 | Hirst-type | Linear regression | + (~2,200; ***) | – (ns) | + (***) |
| [93] (2023) | Andalusia (1) | 1998–2020 | Hirst-type | Linear regression + Mann-Kendall test + Sen’s slope estimation | + (19; *) | – (1.3; ns) | |
| [94] (2018) | S Spain (1) | 1994–2016 | Hirst-type | Z coefficient estimation + Mann-Kendall test | + (~2,000; **) | – (ns) | + (~17; ***) |
| [95] (2022) | Madrid (1) | 1979–2018 | Hirst-type | Linear regression | + (~3,000 gr/m3 per 1°C annual mean increases in temperature; *) | – (~7.75) | + (~3.25; ns) |
| [96] (2025) | SW Spain (1) | 1993–2022 | Hirst-type | Linear regression + Mann-Kendall test + Theil-Sen estimator | No trend | No trend | No trend |
| [97] (2016) | SW Spain (1) | 1993–2013 | Hirst-type | Linear regression | + (ns) | ||
| [98] (2007) | Central Italy (5) | 2006–2036 vs. 1990–2005 | Phenological model | – (4.2) | – (0.8) | ||
| 2037–2068 vs. 2006–2036 | Phenological model | – (4.2) | – (0.1) | ||||
| 2069–2100 vs. 2037–2068 | Phenological model | – (4.7) | – (0.1) |
The grey backgrounds correspond to studies that have made projections about the future. +: trend towards increased pollen concentration (PIn), earlier onset of pollination (PSS), or longer pollen season (PSD); –: trend towards decreased pollen concentration (PIn), later onset of pollination (PSS), or shorter pollen season (PSD); *: p < 0.05; **: p < 0.01; ***: p < 0.001. PIn: pollen integral; PSS: pollen season start date; PSD: pollen season duration; NW: northwest; NE: northeast; N: north; ns: non-significant; W: west; NL: Netherlands; S: south; LOESS: locally estimated scatterplot smoothing; SW: southwest.
Slightly fewer, reduced to 17, are the publications that have focused on the pollen calendar of Cupressaceae. It is true that the successive flowering of the different species means that this taxon is present in the atmosphere for an extended period (generally from Autumn to Spring, and even into Summer for certain junipers), to the point that it becomes difficult to delineate a main pollen release season. But here again a broad consensus emerges, with 76.4% of studies in favor of an increasing precocity of the onset of pollination [20, 26, 37, 47, 51, 57, 62, 73, 86, 92–95], the record coming from Neuchâtel with an advance of 12.9 days every ten years [26]. Only two papers report a diametrically opposite trend; the first [74] mentions an average delay of 1.6 days per decade in the Iberian Peninsula from 1994 to 2023, while the other [97] largely aligns with this observation regarding the specific case of Badajoz between 1993 and 2013.
Twelve publications address the PSD of the Cupressaceae. Four of these do not highlight any trend [26, 57, 81, 92], while the remaining eight [20, 37, 51, 62, 90, 92, 94, 95] indicate a lengthening of between 3.25 and 17 days per decade, with the record coming from Madrid.
Finally, two studies have focused on simulating the effects of various climate warming scenarios on the start date and, incidentally, on the PSS and, partly, on the PSD of Cupressaceae. The first one [73], referred to the juniper in the Western part of the Netherlands and without providing much explanation about the method used, anticipates a very sharp slowdown in the advance of the onset of pollination which, after being 6.25 days every ten years between the 1970s and the 1990s, would decrease to 0.8 days per decade in the 21st century, somewhat abusively regarded as a homogeneous whole. The second study [98] relied on a phenological model capable of simulating the development of the male flower of Cupressus sempervirens (Mediterranean cypress) as a function of the average daily temperature from October 1st to the end of the flowering period. The results indicate for the Florence region, in Central Italy, that the pollen season would become increasingly earlier (from mid-February today to early January in the middle of the century and to mid-December by the end of the century). The duration of this season, on the contrary, would remain virtually unchanged.
Typically, within the Oleaceae family, only Olea (olive tree) pollen is considered a significant aeroallergen. However, there is at least one other species, namely Fraxinus (ash), which can constitute a significant source of airborne allergens, especially since cross-reactivity between various species in this family is now a proven fact. The two publications dealing with the Oleaceae family (Table 3 and Figure 1), without delving into the genus level [18, 51], thus also including Ligustrum (privet), conclude that pollen seasons are gradually becoming more productive and starting earlier. However, they do not allow for a determination regarding the duration of these seasons, which are sometimes shortened (in seven out of ten studied European sites) and sometimes lengthened (in the Veneto region, Northern Italy).
Temporal trends in pollination of the Oleaceae family.
| Reference (publication date) | Region (number of sites) | Study period | Methodology | Trend identification technique | PIn (grains per cubic meter of air per decade and significance) | PSS (days per decade and significance) | PSD (days per decade and significance) | |
|---|---|---|---|---|---|---|---|---|
| [18] (2014) | Europe (13) | 1990–2009 | Hirst-type | Linear regression | + in 7 sites of 10 (ns), + in Madrid (**) | – or + (ns) | – in 7 sites of 10 (ns, except Derby **) | |
| [51] (2024) | NE Italy (20) | 2001–2022 | Hirst-type | Theil-Sen estimator | + (646) | – (13.5) | + (13.3) | |
| Olea | ||||||||
| [20] (2010) | NW Italy (1) | 1981–2007 | Hirst-type | Linear regression | + (*) | – (17.0; *) | + (6.7) | |
| [36] (2016) | Spain (12) | 1994–2013 | Hirst-type | Linear regression | + at 6 sites out of 9 (~12,900 in Córdoba) | |||
| [52] (2021) | France (2) | 1995–2019 | Hirst-type | Variable | + (~350) at Aix-en-Provence; no trend at Toulon | |||
| [56] (2012) | Europe (97) | 1977–2009 (partially) | Hirst-type | Linear regression | + (ns) | |||
| [74] (2025) | Iberian Peninsula (12) | 1994–2023 | Hirst-type | Linear regression | + (3,778 on average, but up to 11,940 in Jaén) | Slightly + (1.6) | ||
| [82] (2024) | Rome (1) | 1997–2016 | Hirst-type | Reduced major axis linear regression | + (ns) | |||
| [83] (2002) | Central Italy (1) | 1982–2001 | Hirst-type | Linear regression | – (4.0; *) | – (5.0; *) | ||
| [89] (2024) | Madrid region (10) | 1994–2022 | Hirst-type | Linear regression | + (at least locally) | |||
| [90] (2024) | N Italy (1) | 1989–2018 | Hirst-type | Linear regression + Mann-Kendall test | + (**) | |||
| [91] (2016) | S Spain (1) | 1996–2010 | Hirst-type | Linear regression + local regression method (LOESS) | + (~190,000; ***) | |||
| [93] (2023) | Andalusia (1) | 1998–2020 | Hirst-type | Linear regression + Mann-Kendall test + Sen’s slope estimation | + (3,830; ns) | – (0.8; ns) | ||
| [94] (2018) | S Spain (1) | 1994–2016 | Hirst-type | Z coefficient estimation + Mann-Kendall test | + (~14,500; **) | – (ns) | + (~13.0; *) | |
| [95] (2022) | Madrid (1) | 1979–2018 | Hirst-type | Linear regression | No trend | – (~1.75) | ||
| [96] (2025) | SW Spain (1) | 1993–2022 | Hirst-type | Linear regression + Mann-Kendall test + Theil-Sen estimator | + (1,668 to 1,808; **) | – (1.6; ns) | – (1.9; **) | |
| [99] (2014) | S Spain (1) | 1982–2011 | Hirst-type | Linear regression + seasonal-trend decomposition procedure based on LOESS + ARIMA model | + (~7,000; ***) | – (~3.6; ns) | + (~11.9; ***) | |
| [100] (2011) | NW Italy (1) | 1981–2010 | Hirst-type | Linear regression | + (***) | No trend | No trend | |
| [102] (2013) | Spain (4) & Italy (6) | 1992–2011 | Hirst-type | Unspecified | – (especially 2004–2011, and in Italy more than in Spain) | |||
| 2046–2065 | Thermal time model | – | ||||||
| [103] (2005) | Andalusia (5) | 1982–2001 | Hirst-type | – (4; *), but + in Cordoba (4) | ||||
| 2000s–2099 | Growing degree-days | – (0.3 to 2.4) | ||||||
| [104] (2024) | Barcelona (1) | 2000–2019 | Hirst-type | + (1.2; ns) | ||||
| 2024–2100 | Forecast model of the PSS + climate scenarios | – (depending on the climate scenario) | ||||||
| [105] (2015) | Spain (4) & Italy (6) | 2081–2100 vs. 1993–2011 | Pheno-meteorological models | – (~0.9 to 1.1) | ||||
| [106] (2012) | Calabria (3) | 21st century | Phenological model | – (1.0 to 3.4) | ||||
| [107] (2013) | Central and S Italy (16) | 2050 | Model | – (2 to 19, mean 8, with 1°C of warming) | ||||
| [108] (2000) | W Mediterranean | 1990s–2030s | Phenological model | – (0.6 to 1.6) | ||||
| Fraxinus | ||||||||
| [24] (2005) | Austria in valley area (1) | 1980–2001 | Hirst-type | Linear regression | + (~950) | – (3.2) | ||
| [25] (2018) | Brussels (1) | 1982–2015 | Hirst-type | Local regression method (LOESS) | + | |||
| [26] (2003) | Switzerland (1) | 1979–1999 | Hirst-type | Linear regression | No trend | – (14.3; *) | No trend | |
| [27] (2025) | Texas, USA (1) | 2009–2023 | Hirst-type | Least square regression | + (ns) | |||
| [28] (2021) | Benelux (5) | 1981–2020 | Hirst-type | Linear regression | + in all sites; * in 4 of 5 | – in 4 sites of 5; * in only 1 | + (* at just 1 site out of 5); – (* at another site) | |
| [36] (2016) | Spain (12) | 1994–2013 | Hirst-type | Linear regression | + at 7 sites out of 8; – in Madrid (ns) | |||
| [37] (2021) | Basel (1) | 1969–2018 | Hirst-type | Linear regression | + (~588; **) | – (~3.7; **) | – (~3; **) | |
| [38] (2021) | Switzerland (14) | 1990–2020 | Hirst-type | Linear regression + LOESS | + (ns) | No trend | – (*) | |
| [40] (2018) | Brussels (1) | 1982–2015 | Hirst-type | Linear regression + Mann-Kendall test | + (*) | – (ns) | ||
| [45] (2011) | S Poland (1) | 1991–2008 | Hirst-type | Linear regression | + (*) | No trend | ||
| [47] (2021) | Bavaria (8) | 1989–2018 | Hirst-type | Linear regression | + | |||
| [56] (2012) | Europe (97) | 1977–2009 (partially) | Hirst-type | Linear regression | + (***) | |||
| [73] (2002) | W of the NL (1) | 1969–2000 | Hirst-type | Linear regression | – (1, ns) | |||
| 2000s–2090s | Modelling | Unspecified | – (1.9) | |||||
| [82] (2024) | Rome (1) | 1997–2016 | Hirst-type | Reduced major axis linear regression | + (ns) | |||
| [86] (2020) | Andalusia (3) | 1994–2017 | Hirst-type | Linear regression | + (especially in Granada; ns) | – (* in Córdoba, ns elsewhere) | ||
| [89] (2024) | Madrid region (10) | 1994–2022 | Hirst-type | Linear regression | + (at least locally) | |||
| [94] (2018) | S Spain (1) | 1994–2016 | Hirst-type | Z coefficient estimation + Mann-Kendall test | + (~30; **) | – (ns) | + (~20; *) | |
| [109] (2019) | NW Spain (1) | 1997–2016 | Hirst-type | Mann-Kendall test + Theil-Sen estimator | + (~100; **) | |||
| [110] (2024) | Slovakia (2) | 2002–2022 | Hirst-type | Linear regression + Mann-Kendall test + Theil-Sen estimator | + (ns) | – (ns) | ||
| [111] (2002) | Switzerland | 1951–2000 | Hirst-type + phenology | – (~6) | ||||
The grey backgrounds correspond to studies that have made projections about the future. +: trend towards increased pollen concentration (Pin), earlier onset of pollination (PSS), or longer pollen season (PSD); –: trend towards decreased pollen concentration (PIn), later onset of pollination (PSS), or shorter pollen season (PSD); *: p < 0.05; **: p < 0.01; ***: p < 0.001. PIn: pollen integral; PSS: pollen season start date; PSD: pollen season duration; ns: non-significant; NE: northeast; NW: northwest; N: north; S: south; LOESS: locally estimated scatterplot smoothing; SW: southwest; ARIMA: autoregressive integrated moving average; W: west; NL: Netherlands.
Beyond inevitable nuances, the studies dedicated separately to Olea and Fraxinus agree with these trends.
Within the geographical area under consideration, Olea is predominantly found in the Mediterranean climate regions of Southern Europe, but it has also been introduced into North America, particularly in California and Arizona. This time, 93.3% of the publications that analyzed the PIn noted an upward trend in the total pollen load, most often across all the sites considered [20, 56, 74, 82, 90, 91, 93, 94, 96, 99, 100], or at least in most locations [36, 52, 89]. Only one publication [95] did not identify any trend, and none indicated a negative trend (unless one includes the study [101] that, with a certain misuse of language, mentions a “sharp decrease in olive pollen emissions” since 2000 in Central Italy as in Andalusia, while relying solely on the pollen counts from the four days preceding the annual peak, a concept probably useful in agronomy but of negligible interest in allergology). Furthermore, although the progression over time remains moderate in many instances, it can, in certain cases, take on considerable proportions, particularly in Southern Spain (around +14,500 grains per decade in Jaen [94]). It should be added that, due to the very high interannual variability, the ten-year rate of progression can vary enormously, at the same location, depending on the series analyzed, increasing in Córdoba from +7,000 grains/m3 over the years 1982–2011 [99] to approximately +190,000 over the years 1996–2010, even if this substantial increase is partly due to the expansion of the area devoted to olive cultivation [91].
A broad consensus is also observed, albeit slightly diminished, regarding the onset of the olive tree pollen season. In 75.0% of cases where the past trend of PIn was considered [20, 83, 93–96, 99, 102, 103], the authors reported a gradual advance in pollination over time, although at a very uneven pace, ranging from less than one to 17 days every ten years, depending on the locations. The only exceptions, which are not significant, pertain to a few sites in the Iberian Peninsula [74, 104]. But as with the taxa considered previously, it remains risky to comment on the length of the olive tree pollen season, which appears to have extended by 6.7 to 13.0 days per decade in half of the studies [20, 94, 99] and contracted in one third [83, 96], while only one study [100] did not discern a clear trend.
In addition, probably due to the implications of such projections for the future of Mediterranean olive cultivation, Olea is by far the tree whose susceptibility to the coming climate change has prompted the most numerous and, in many respects, the most thorough investigations. No fewer than seven studies meeting all the inclusion criteria outlined above were retained [102–108]. While none of these studies examined the intensity or duration of pollination, all agree that in the future, specifically within time horizons ranging from 2030 to 2100, the pollen season of Olea will continue to begin progressively earlier. It is true that several authors note that the simulations vary by nearly a factor of two depending on the climate scenario considered [104, 107], yet almost all identify the olive as one of the pollen taxa whose advancement is likely to be most pronounced in the 21st century. The advance is estimated to range from 0.4 or 0.6 [103, 108] to 3.4 days per decade [106]. It has also been calculated, in Montpellier [108] as well as in Central and Southern Italy [106, 107], that this advance would average 8 or 9 days over ten years for each additional degree of average annual temperature, but with significant spatial variability, evidenced over short distances by extremes ranging from 2 to 19 days [107].
Unlike the olive tree, which is strictly dependent on a Mediterranean or Mediterranean-like climate, the ash tree is widely distributed in all temperate and subtropical areas of the Northern Hemisphere. The review of 20 publications addressing the evolution of its pollination leads to observations very similar to those reported for Olea, with nearly 90% of cases showing a trend towards the intensifying of the pollen season [24, 25, 27, 28, 36–38, 40, 45, 47, 56, 82, 86, 89, 94, 109, 110]. Local progression can reach 950 grains/m3 over a ten-year period in Innsbruck, where pollen amounts increased 6.5-fold between 1980 and 2001 [24]. The only two exceptions, which are minor, come from Madrid [36] and Neuchâtel [26]. Similarly, an advance in the pollen season is found in more than 80% of cases where PSS was studied [24, 26, 28, 37, 40, 73, 86, 94, 110, 111] and sometimes reaches spectacular levels (14.3 days per decade in Neuchâtel [26]); only two publications report unchanged dates [38, 45], and none report delayed dates. The trend towards increasing precocity is expected to continue, at an average rate of 1.9 days per decade, until the 2090s, according to the only study that has addressed the issue [73]. As for the length of the pollen season, it remains equally difficult to interpret, with 40% of the durations decreasing [37, 38], 20% of durations increasing [94], and 40% showing no change [26] or evolving inconsistently between the different sites studied [28].
While the arboreal taxa with winter- or spring-flowering that we have just examined exhibit clear trends, the same cannot always be said for herbaceous taxa that are blooming later in the year, particularly relating to the intensity of the pollen seasons.
The Poaceae or Gramineae family (grasses), found worldwide, occurs in all terrestrial biomes. It is probably its near-ubiquity that makes it the most common source of pollen allergies worldwide, affecting around 80% of allergy sufferers [112]. Within this family, pollen grain determination at the genus level, and even more so at the species level, proves to be very difficult, if not impossible, using conventional aerobiological methods. It would therefore be unrealistic to claim to assess the partial contribution of each species to the airborne pollen spectrum, which constitutes a significant drawback given that not all species have the same allergenic potential or sensitivity to climate change.
The prevailing trend in the annual PIn (Table 4 and Figure 1), documented in 41.2% of publications [16, 20, 22, 25, 27, 28, 30, 37, 40, 41, 47, 52, 56, 61, 74, 85, 92, 113–116], is a decline, without a marked difference between the North and South of Europe, although the pollen spectrum of grasses differs notably between these two geographical areas. Most often, the decline remains fairly moderate and not statistically significant (averaging about –119 grains/m3 per decade across twelve stations in the Iberian Peninsula [74]), but there are notable exceptions (–1,588 grains/m3 every ten years in Badajoz [74], –1,620 in Perugia, Central Italy [116]; consequently, in the latter case, the annual amount of pollen collected in recent years has decreased by half compared to the end of the 20th century). The opposite trend is slightly less frequent, as an increase in concentrations was observed in only 35.3% of studies [24, 31, 36, 38, 44, 45, 51, 55, 62, 63, 81, 90, 91, 93, 94, 100, 117, 118], but it is sometimes very pronounced, reaching over +15,500 grains/m3 in ten years in Córdoba, albeit based on a relatively short series [91]. No trend was identified in 23.5% of publications [19, 23, 26, 57, 59, 82, 95, 96, 109, 119–121]. It should also be noted that in several studies, the authors report contradictory trends depending on the site considered [18, 42, 50, 122] and/or reversals in trends from one decade to the next [22, 34, 43, 122]. Thus, since the late 1980s, the annual pollen count for grasses has approximately doubled in North-Eastern and Southern Germany, while it has sharply declined (–2,180 grains/m3 per decade) in the North-West of the country [42]. Similarly, at the East Midland locations of Derby and Leicester in the United Kingdom, where a 52-year series could be utilized, PIn initially decreased from the late 1970’s to the early 1990’s, before entering a phase of vigorous growth [43].
Temporal trends in pollination of the Poaceae family.
| Reference (publication date) | Region (number of sites) | Study period | Methodology | Trend identification technique | PIn (grains per cubic meter of air per decade and significance) | PSS (days per decade and significance) | PSD (days per decade and significance) |
|---|---|---|---|---|---|---|---|
| [16] (2016) | N Italy (1) | 1990–2004 | Hirst-type | Linear regression | – | Slightly + | No trend |
| [18] (2014) | Europe (13) | 1990–2009 | Hirst-type | Linear regression | + or – (ns, except Leiden and Legnano) | – in 7 of 10 sites (ns, except Reykjavik and Strasbourg) | + or – (* in 3 sites of 13, ns at the other 7) |
| [19] (2022) | United Kingdom (6) | 1995–2020 | Hirst-type | Linear regression | No trend | Locally – (* to **) | |
| [20] (2010) | NW Italy (1) | 1981–2007 | Hirst-type | Linear regression | – ns | – (9.6; ns) | No trend |
| [22] (2019) | France (7) | 1987–2018 | Hirst-type | Linear & polynomial regression | – overall, except in Lyon, often with a phase of increase until 1999–2002 | +, stationary, or –, depending on the site | –, stationary, or +, depending on the site |
| [23] (2021) | Central Germany (4) | 1998–2017 | Hirst-type | Cochran-Armitage test for trend | No trend | ||
| [24] (2005) | Austria (2) | 1980–2001 | Hirst-type | Linear regression | + (~2,400 in valley area, ~700 at higher altitude) | – (4.5 in valley area, 2.6 at higher altitude) | |
| [25] (2018) | Brussels (1) | 1982–2015 | Hirst-type | Local regression method (LOESS) | – | ||
| [26] (2003) | Switzerland (1) | 1979–1999 | Hirst-type | Linear regression | No trend | – (6.7; *) | No trend |
| [27] (2025) | Texas, USA (1) | 2009–2023 | Hirst-type | Least square regression | – (0.4; ns) | ||
| [28] (2021) | Benelux (5) | 1981–2020 | Hirst-type | Linear regression | – in all sites; * in 4 of 5 | – in the 5 sites; * in 4 of 5 | + at the 5 sites; * at only 1 |
| [30] (2014) | Catalonia (8) | 1994–2011 | Hirst-type | Linear regression + non-parametric test | – | ||
| [31] (1998) | Basel (1) | 1969–1996 | Hirst-type | Linear regression | + (**) | No trend | |
| [34] (2008) | Switzerland (3) | 1969–2007 | Hirst-type | Linear regression | + (1969–1990; **), then – (1991–2007; * in Basel) | – (1.8 to 3.2), but + (11) in Locarno | |
| [35] (2021) | Basel (1) | 1969–2020 | Hirst-type | Linear regression | – (~1.5) | ||
| [36] (2016) | Spain (12) | 1994–2013 | Hirst-type | Linear regression | + at 8 out of 12 sites | ||
| [37] (2021) | Basel (1) | 1969–2018 | Hirst-type | Linear regression | – (ns) | No trend | – (~3.7; **) |
| [38] (2021) | Switzerland (14) | 1990–2020 | Hirst-type | Linear regression + LOESS | + (ns) | ||
| [40] (2018) | Brussels (1) | 1982–2015 | Hirst-type | Linear regression + Mann-Kendall test | – (*) | – (*) | |
| [41] (2019) | Switzerland (6) | 1985–2014 | Hirst-type | Bayesian statistics | – in recent years in 3 of the sites | ||
| [42] (2011) | Germany (10) | 1988–2009 | Hirst-type | Linear regression + Mann-Kendall test | + in NE (~700) and S (~635), – in NW (~2,180) | – in S (9) | + in S (~11) |
| [43] (2024) | United Kingdom (2) | 1970–2021 | Hirst-type | Generalized additive model for time series | – from the late 1970’s to early 1990’s; + thereafter | – prior to 1990, + thereafter | |
| [44] (2016) | Stockholm (1) | 1973–2013 | Hirst-type | Linear regression | + (~35; ns) | – (~0.6; ns) | + (3; **) |
| [45] (2011) | S Poland (1) | 1991–2008 | Hirst-type | Linear regression | + (*) | – (**) | |
| [47] (2021) | Bavaria (8) | 1989–2018 | Hirst-type | Linear regression | – (*; ** in Munich) | – (** in Munich) | + |
| [50] (2003) | W Europe (5) | 1968–2001 (partly) | Hirst-type | Linear regression | + in 2 sites, – in 3 others; ns everywhere | ||
| [51] (2024) | NE Italy (20) | 2001–2022 | Hirst-type | Theil-Sen estimator | + (685) | – (6.3) | + (12.5) |
| [52] (2021) | France (6) | 1987–2021 | Hirst-type | Variable | – (~530) | ||
| [55] (2015) | USA (50) | 1994–2010 | Unspecified | Linear regression | + everywhere (2.75 to 79.6; ns except in the Central region) | – in 5 of 9 regions (1.8 to 5.3); + in 3 regions; ns except in the Central region | – in 7 regions out of 9 (1.2 to 11.5); + in the NE (5.9; *) |
| [56] (2012) | Europe (97) | 1977–2009 (partially) | Hirst-type | Linear regression | – (ns) | ||
| [57] (2020) | N & Central Italy (9) | 2000–2016 | Hirst-type | Non-parametric Mann-Kendall test | No trend | – | – |
| [58] (2020) | Basel (1) | 1969–2018 | Hirst-type | Linear regression | – (~1.2) | ||
| [59] (2021) | Georgia, USA (1) | 1992–2018 | Rotorod | Linear regression | No trend | – (14.2) | – (4.0) |
| [61] (2021) | Austria (1) | 1993–2017 | Hirst-type | Linear regression | – (~1,000) | – | No trend |
| [62] (2025) | N Italy (1) | 1997–2023 | Hirst-type | Linear regression | + ns | – (3.6; *) | + (12.1; **) |
| [63] (2024) | Switzerland | 1990–2023 | Hirst-type | Unspecified | + (~588) | – (~2) | |
| [73] (2002) | W of the NL (1) | 1969–2000 | Hirst-type | Linear regression | – (~2) | ||
| 2000s–2090s | Modelling | Unspecified | – (1.1) | ||||
| [74] (2025) | Iberian Peninsula (12) | 1994–2023 | Hirst-type | Linear regression | – (119 on average, but up to 1,588 in Badajoz) | – (1.3) | |
| [81] (2007) | Thessaloniki (1) | 1987–2005 | Hirst-type | Linear regression | + (~600) | No trend | No trend |
| [82] (2024) | Rome (1) | 1997–2016 | Hirst-type | Linear regression | No trend | ||
| [83] (2002) | Central Italy (1) | 1982–2001 | Hirst-type | Linear regression | – (3.0; *) | – (6.0; *) | |
| [85] (2021) | Slovakia (1) | 2002–2019 | Hirst-type | Linear regression + Mann-Kendall test | – | ||
| [90] (2024) | N Italy (1) | 1989–2018 | Hirst-type | Linear regression + Mann-Kendall test | + (*) | – (***) | No trend |
| [91] (2016) | S Spain (1) | 1996–2010 | Hirst-type | Linear regression + local regression method (LOESS) | + (~15,500; ***) | ||
| [92] (2021) | Oklahoma, USA (1) | 1996–2020 | Hirst-type | Linear regression | – (ns) | – (*) | + |
| [93] (2023) | Andalusia (1) | 1998–2020 | Hirst-type | Linear regression + Mann-Kendall test + Sen’s slope estimation | + (1,027; ns) | – (2; ns) | |
| [94] (2018) | S Spain (1) | 1994–2016 | Hirst-type | Z coefficient estimation + Mann-Kendall test | + (~750; ns) | – (ns) | + (ns) |
| [95] (2022) | Madrid (1) | 1979–2018 | Hirst-type | Linear regression | No trend | – (~1; ns) | – (~0.75; ns) |
| [96] (2025) | SW Spain (1) | 1993–2022 | Hirst-type | Linear regression + Mann-Kendall test + Theil-Sen estimator | No trend | + (*) | – (***) |
| [100] (2011) | NW Italy (1) | 1981–2010 | Hirst-type | Linear regression | + (**) | No trend | No trend |
| [109] (2019) | NW Spain (1) | 1997–2016 | Hirst-type | Mann-Kendall test + Theil-Sen estimator | No trend | ||
| [113] (1993) | London (1) | 1961–1990 | Hirst-type | Unspecified | – from the early 1960s to the mid-1980s | +, especially in the 1980s–1990s | – (4.3) |
| [114] (2017) | Central Italy (1) | 1982–2014 | Hirst-type | Linear regression | – (~1,450; ***) | – (~4.1; ***) | No trend |
| [115] (2009) | NW Spain | 1993–2007 | Hirst-type | Linear regression | – (**) | – but varies according to the site and the method used to define the season | Generally – |
| [116] (2017) | Central Italy (1) | 1982–2014 | Hirst-type | Linear regression | – (1,620; ***) | – (4.0; ***) | No trend |
| [117] (2014) | Experiment | + 50% with elevated CO2 | |||||
| [118] (2010) | Andalusia (8) | 1982–2008 | Hirst-type | Linear regression | + (** at 2 of 8 sites) | – (more or less, * or ns) | + (more or less, * or ns) |
| [119] (2014) | W Poland (1) | 1996–2011 | Hirst-type | Mann-Kendall test + Sen’s slope estimator | No trend | – (10.3; *) | + (30.0; **) |
| [120] (2024) | Portugal (1) | 2001–2021 | Hirst-type | Linear regression + Kruskal–Wallis test | No trend | No trend | No trend |
| [121] (2000) | NW Italy (1) | 1981–1997 | Hirst-type | Linear regression | No trend | ||
| [122] (1999) | United Kingdom (3) | 1961–1993 | Hirst-type | Unspecified (linear regression) | Contrasting schemes depending on the site and the decade | – in Cardiff and Derby, + in London | |
| [123] (2023) | Denmark (2) | 1825–2014 | Herbaria | Linear regression | – but varies according to species | + but varies according to species | |
| 1977–2019 | Hirst-type | Linear regression | – (2.5; ***) | + (4.4; **) | |||
| [124] (2000) | W Europe (4) | 1976–1997 | Hirst-type | Unspecified (linear regression) | – in Austria and the NL, + in S Finland virtually stable in London |
The grey backgrounds correspond to studies that have made projections about the future. +: trend towards increased pollen concentration (PIn), earlier onset of pollination (PSS), or longer pollen season (PSD); –: trend towards decreased pollen concentration (PIn), later onset of pollination (PSS), or shorter pollen season (PSD); *: p < 0.05; **: p < 0.01; ***: p < 0.001. PIn: pollen integral; PSS: pollen season start date; PSD: pollen season duration; N: north; ns: non-significant; NW: northwest; LOESS: locally estimated scatterplot smoothing; NE: northeast; S: south; W: west; SW: southwest; NL: Netherlands.
The PSS brings us back to a pattern close to that described for trees. Indeed, 80.5% of publications addressing the subject conclude that pollination is occurring increasingly earlier [18–20, 24, 26, 28, 35, 40, 42, 44, 45, 47, 51, 57–59, 61–63, 73, 74, 83, 90, 92–95, 114–116, 118, 119, 123], while only 7.3% report a postponed onset [16, 96, 113]. There are still very few differences between Northern Europe and Southern Europe. Once again, the trend may be positive, negative, or neutral depending on the site, whether in France [22], in the United Kingdom [122], throughout Western Europe [124] or in the United States [55], and some trend reversals over time can be detected, for instance in Central England where grass shows a U-shaped trend with the earliest start of season near 1990 [43]. Lastly, and notwithstanding the reservations already expressed about this work, the sole article that attempted to look ahead predicted for the Netherlands a potential continuation of the trend toward increasing earliness, at an average rate of 1.1 days per decade until the 2090s [73].
Because the numerous species of the family bloom at different times, the grass pollen season almost always lasts longer than that of other taxa, particularly in Southern Europe. It is therefore more difficult to propose a simple scheme to characterize the evolution of the duration of this season. In fact, 37.9% of cases show an extension [28, 42, 44, 47, 51, 62, 92, 94, 118, 119, 123], 27.6% show a decrease in length [37, 57, 59, 83, 95, 96, 113, 115] and 34.5% show unchanged duration [16, 20, 26, 61, 81, 90, 100, 114, 116, 120]. Furthermore, it is not uncommon for trends to change in magnitude, and sometimes even in direction [18, 22, 34, 55] over short distances. But this time, a significant difference emerges between Northern Europe (where the pollen season is prolonged in 58.3% of studies) and Southern Europe (where it is prolonged in only 29.4%). Given that the start dates of this season are relatively stable, it can be inferred that the end dates are often earlier or remain unchanged in the South, likely due to the combined effect of higher temperatures and greater water stress.
At least in Europe, the Urticaceae family includes two main genera, Urtica (nettle) and Parietaria (pellitory). Both are widely cosmopolitan, but in practice, only Parietaria plays a significant role in triggering allergic diseases. Regrettably, genus differentiation based on pollen morphology remains difficult, even though the two genera have very slight differences in size (only U. membranacea is easily identified). In aerobiological databases, the name Urticaceae is therefore systematically used to group together many species. Nevertheless, pellitory (at least P. officinalis) is more abundant in the South than in the North of Europe, whereas the opposite is true for nettle. This has led us, albeit as a makeshift solution, to consider only the studies conducted in the Mediterranean region, thereby increasing our certainty that most allergenic pollen is labelled under Urticaceae.
Hence, unlike grasses, a slight predominance of the tendency toward increased pollen concentrations (Table 5 and Figure 1) is observed for the Urticaceae, present in 42.9% of cases [20, 81, 82, 93, 100, 121] compared to 35.7% for the opposite trend [36, 91, 94, 96, 125] and 21.4% for no trend [51, 57, 59]. A special mention is warranted for Córdoba, where PIn recorded a considerable drop estimated at 41,500 grains/m3 over ten years [91], broadly corroborated by another study [36].
Temporal trends in pollination of the Urticaceae family in regions where Parietaria dominates.
| Reference (publication date) | Region (number of sites) | Study period | Methodology | Trend identification technique | PIn (grains per cubic meter of air per decade and significance) | PSS (days per decade and significance) | PSD (days per decade and significance) |
|---|---|---|---|---|---|---|---|
| [20] (2010) | NW Italy (1) | 1981–2007 | Hirst-type | Linear regression | + (*) | – (30.7) | + (31.5) |
| [36] (2016) | Spain (12) | 1994–2013 | Hirst-type | Linear regression | – at 8 sites out of 12 | ||
| [51] (2024) | NE Italy (20) | 2001–2022 | Hirst-type | Theil-Sen estimator | No trend | – (4.7) | + (10) |
| [57] (2020) | N & Central Italy (9) | 2000–2016 | Hirst-type | Non-parametric Mann-Kendall test | No trend | – | No trend |
| [59] (2021) | Georgia, USA (1) | 1992–2018 | Rotorod | Linear regression | No trend | – (2) | + (1) |
| [74] (2025) | Iberian Peninsula (12) | 1994–2023 | Hirst-type | Linear regression | – (4.2) | ||
| [81] (2007) | Thessaloniki (1) | 1987–2005 | Hirst-type | Linear regression | + (~100) | No trend | No trend |
| [82] (2024) | Rome (1) | 1997–2016 | Hirst-type | Reduced major axis linear regression | + (**) | ||
| [83] (2002) | Central Italy (1) | 1982–2001 | Hirst-type | Linear regression | – (8.0; *) | + (10.0; *) | |
| [90] (2024) | N Italy (1) | 1989–2018 | Hirst-type | Linear regression + Mann-Kendall test | – (*) | ||
| [91] (2016) | S Spain (1) | 1996–2010 | Hirst-type | Linear regression + local regression method (LOESS) | – (41,500; ***) | ||
| [93] (2023) | Andalusia (1) | 1998–2020 | Hirst-type | Linear regression + Mann-Kendall test + Sen’s slope estimation | + (304; *) | – (13.3; *) | |
| [94] (2018) | S Spain (1) | 1994–2016 | Hirst-type | Z coefficient estimation + Mann-Kendall test | – (~225; ns) | – (ns) | – (ns) |
| [96] (2025) | SW Spain (1) | 1993–2022 | Hirst-type | Linear regression + Mann-Kendall test + Theil-Sen estimator | – (*) | No trend | No trend |
| [100] (2011) | NW Italy (1) | 1981–2010 | Hirst-type | Linear regression | + (**) | – (***) | + (***) |
| [121] (2000) | NW Italy (1) | 1981–1997 | Hirst-type | Linear regression | + (*) | ||
| [125] (2009) | Spain (2) | 1991–2006 | Hirst-type | Linear regression | – (ns in Malaga, *** in Vigo) | + (ns in Malaga, 30, * in Vigo) | – (*** in Malaga, ** in Vigo) |
+: trend towards increased pollen concentration (PIn), earlier onset of pollination (PSS), or longer pollen season (PSD); –: trend towards decreased pollen concentration (PIn), later onset of pollination (PSS), or shorter pollen season (PSD); *: p < 0.05; **: p < 0.01; ***: p < 0.001. PIn: pollen integral; PSS: pollen season start date; PSD: pollen season duration; NW: northwest; NE: northeast; N: north; S: south; LOESS: locally estimated scatterplot smoothing; ns: non-significant; SW: southwest.
Pollen calendars are marked, in more than three-quarters of cases, by an increasingly early onset of flowering of the Urticaceae [20, 51, 57, 59, 74, 83, 90, 93, 94, 100], with a progression reaching up to one month every ten years in Western Liguria [20]. In contrast, Vigo, located at the Northwestern tip of Spain, which shares the same latitude as the Mediterranean but has a significantly different climate, has recorded an average delay of around thirty days per decade [125]. A very early pollination of Urticaceae, which are mainly believed to be Parietaria, is regularly associated with an extension of the pollen season [20, 51, 59, 83, 100], with the increase ranging from less than 1 to more than 31 days per ten-year period. However, there are also sites where this duration remains unchanged [57, 81, 96], and others where it tends to decrease [94, 125]. The cases of Malaga and Vigo still appear to be anomalous, with pollen seasons becoming both later and shorter [125]. In any case, such findings challenge the widely held belief, especially in Italy, that the pellitory season has extended to cover the entire year [126].
The Asteraceae family, which includes 12,000 species classified into 780 genera, approximately, is one of the largest groups of flowering plants with members across all continents, but particularly in Northern temperate latitudes. Most are entomogamous and are unlikely to cause anything other than contact or proximity allergies. However, there are at least two genera, Artemisia (mugwort) and Ambrosia (ragweed), which are wind-pollinated and are prone to causing respiratory allergies in late summer and autumn. These are indeed short-day plants with a generative growth phase induced after the day length decreases and the summer temperatures have reached their peak.
Only a single publication [18] is dedicated to the evolution of pollination in the Asteraceae family without differentiation. It covers about ten European sites and observes, from 1990 to 2009, both a decrease in airborne pollen concentrations (in 8 of the studied locations), an earlier onset of the seasons (in 6 of these sites), and a lengthening of the exposure period to one or another pollen of this family (everywhere except Prague); however, it is not possible to determine the respective contributions of mugwort and ragweed to these trends.
The most striking point (Table 6 and Figure 1) is that, unlike all other taxa, the intensity of the mugwort pollen season is declining in just over two-thirds of cases [25, 27, 28, 30, 32, 37, 38, 40, 42, 51, 55, 56, 83, 85, 119, 127], whereas it is increasing in only 17.4% [26, 36, 45, 81] and remains quite steady in 13% [44, 57, 121]. In Northwestern Germany, for example, the annual PIn of Artemisia at the end of the 2000s was only half as high as in the 1980s [42]. The decline, which some authors describe as unexpected [85], was already well underway in series ending in 2001 and beginning in 1968 and 1974, respectively, in Derby and Brussels [50]. The most widely accepted hypothesis is that plants respond to summer warming by allocating most of their resources to vegetative organs at the expense of reproductive organs, thereby limiting pollen production, which also enables them to reduce evaporation and water loss [119, 128].
Temporal trends in pollination of the Asteraceae family.
| Reference (publication date) | Region (number of sites) | Study period | Methodology | Trend identification technique | PIn (grains per cubic meter of air per decade and significance) | PSS (days per decade and significance) | PSD (days per decade and significance) |
|---|---|---|---|---|---|---|---|
| [18] (2014) | Europe (13) | 1990–2009 | Hirst-type | Linear regression | – in 8 sites of 10, * in Derby, ** in Strasbourg, *** in Leiden | – in 6 sites of 10 (** in Derby) | + (ns) except in Prague |
| Artemisia | |||||||
| [25] (2018) | Brussels (1) | 1982–2015 | Hirst-type | Local regression method (LOESS) | – | ||
| [26] (2003) | Switzerland (1) | 1979–1999 | Hirst-type | Linear regression | + (ns) | – (8.1; *) | No trend |
| [27] (2025) | Texas, USA (1) | 2009–2023 | Hirst-type | Least square regression | – (0.5; ***) | ||
| [28] (2021) | Benelux (5) | 1981–2020 | Hirst-type | Linear regression | – (*) in 3 sites of 5 | – in all sites; * in only 1 | + in all sites; * in 3 out of 5 |
| [30] (2014) | Catalonia (8) | 1994–2011 | Hirst-type | Linear regression + non-parametric test | – | ||
| [32] (2000) | Basel (1) | 1969–1998 | Hirst-type | Linear regression | – (ns) | ||
| [36] (2016) | Spain (12) | 1994–2013 | Hirst-type | Linear regression | + at 8 sites out of 12 | ||
| [37] (2021) | Basel (1) | 1969–2018 | Hirst-type | Linear regression | – (~29; ***) | ||
| [38] (2021) | Switzerland (14) | 1990–2020 | Hirst-type | Linear regression + LOESS | – (*) | ||
| [40] (2018) | Brussels (1) | 1982–2015 | Hirst-type | Linear regression + Mann-Kendall test | – (***) | – (ns) | + |
| [42] (2011) | Germany (10) | 1988–2009 | Hirst-type | Linear regression + Mann-Kendall test | – in NW and S | + in S (~9) | + in NE and NW |
| [44] (2016) | Stockholm (1) | 1973–2013 | Hirst-type | Linear regression | No trend | – (~3.0; *) | + (~6.6; ***) |
| [45] (2011) | S Poland (1) | 1991–2008 | Hirst-type | Linear regression | + (*) | No trend | No trend |
| [50] (2003) | W Europe (5) | 1968–2001 (partly) | Hirst-type | Linear regression | – in Brussels and Derby, + in the 3 other sites; * in 1 site, ** in the 4 others | ||
| [51] (2024) | NE Italy (20) | 2006–2022 | Hirst-type | Theil-Sen estimator | – (26) | No trend | + (5.0) |
| [55] (2015) | USA (50) | 1994–2010 | Unspecified | Linear regression | – in the NE (30.3; *) | – in the NE (7.4; *) | + in the NE (5.9; *) |
| [56] (2012) | Europe (97) | 1977–2009 (partially) | Hirst-type | Linear regression | – (5; ***) | ||
| [57] (2020) | N & Central Italy (9) | 2000–2016 | Hirst-type | Non-parametric Mann-Kendall test | No trend | + | No trend |
| [73] (2002) | W of the NL (1) | 1969–2000 | Hirst-type | Linear regression | – (3.75) | ||
| 2000s–2090s | Modelling | Unspecified | – (1.5) | ||||
| [81] (2007) | Thessaloniki (1) | 1987–2005 | Hirst-type | Linear regression | + (~2) | No trend | No trend |
| [83] (2002) | Central Italy (1) | 1982–2001 | Hirst-type | Linear regression | – (1.5; ns) | No trend | No trend |
| [85] (2021) | Slovakia (1) | 2002–2019 | Hirst-type | Linear regression + Mann-Kendall test | – | – | |
| [119] (2014) | W Poland (1) | 1996–2011 | Hirst-type | Mann-Kendall test + Sen’s slope estimator | – (813; *) | – (7.5; **) | No trend |
| [121] (2000) | NW Italy (1) | 1981–1997 | Hirst-type | Linear regression | No trend | ||
| [127] (2013) | SE Spain (1) | 1992–2011 | Hirst-type | Linear regression | – (~38; ns) | + (~2; ns) | – (~6.3; ns) |
| [129] (2020) | N Italy (2) | 1995–2019 | Hirst-type | Linear regression + Mann-Kendall test + Sen’s estimate + Pettitt test | – (ns or *** until end of August), then + (** or ***) | ||
| Ambrosia | |||||||
| [26] (2003) | Switzerland (1) | 1979–1999 | Hirst-type | Linear regression | + (ns) | – (9.5; *) | No trend |
| [27] (2025) | Texas, USA (1) | 2009–2023 | Hirst-type | Least square regression | + (5.2; ***) | ||
| [37] (2021) | Basel (1) | 1969–2018 | Hirst-type | Linear regression | – (ns) | ||
| [38] (2021) | Switzerland (14) | 1990–2020 | Hirst-type | Linear regression + LOESS | No trend | ||
| [45] (2011) | S Poland (1) | 1991–2008 | Hirst-type | Linear regression | No trend | No trend | |
| [51] (2024) | NE Italy (20) | 2006–2022 | Hirst-type | Theil-Sen estimator | No trend | + (4.5) | – (4.3) |
| [55] (2015) | USA (50) | 1994–2010 | Unspecified | Linear regression | + in the S (58.8; *) and the NE; – in the NW Central (23.9; *) | – (1.8 to 1.9 in the NE; *); ns elsewhere | + in the S (1.5); ns elsewhere |
| [56] (2012) | Europe (97) | 1977–2009 (partially) | Hirst-type | Linear regression | + (9; **) | ||
| [59] (2021) | Georgia, USA (1) | 1992–2018 | Rotorod | Linear regression | No trend | – (0.9) | + (1.2) |
| [62] (2025) | N Italy (1) | 1997–2023 | Hirst-type | Linear regression | + (ns) | + (ns) | – (8.7; ns) |
| [81] (2007) | Thessaloniki (1) | 1987–2005 | Hirst-type | Linear regression | – (~3) | ||
| [90] (2024) | N Italy (1) | 1989–2018 | Hirst-type | Linear regression + Mann-Kendall test | + (**) | ||
| [92] (2021) | Oklahoma, USA (1) | 1996–2020 | Hirst-type | Linear regression | – (~2,700; ***) | + (ns) | + (ns) |
| [110] (2024) | Slovakia (2) | 2002–2022 | Hirst-type | Linear regression + Mann-Kendall test + Theil-Sen estimator | + (ns) | – (ns) | + (***) at 1 site out of 2 |
| [121] (2000) | NW Italy (1) | 1981–1997 | Hirst-type | Linear regression | + from 1989 (**) | ||
| [131] (2002) | Oklahoma, USA | Experiment | + (+84% for A. psilostachya with a warming of 1.2°C) | ||||
| [132] (2014) | Oklahoma, USA (1) | 1987–2011 | Hirst-type | – (**) | + (ns) | + (ns) | |
| [134] (2011) | Central North America (10) | 1995–2009 | Mostly Hirst-type, but also Rotorod and Durham | No trend in the S, increasingly + northwards (up to 18.0) | |||
| [135] (2015)[136] (2017) | Europe | From 1986–2005 to 2041–2060 | Model | + (~4 times more) | + | ||
| [137] (2018) | Missouri, USA (1) | 1997–2017 | Hirst-type | – | + | ||
The grey backgrounds correspond to studies that have made projections about the future. +: trend towards increased pollen concentration (PIn), earlier onset of pollination (PSS), or longer pollen season (PSD); –: trend towards decreased pollen concentration (PIn), later onset of pollination (PSS), or shorter pollen season (PSD); *: p < 0.05; **: p < 0.01; ***: p < 0.001. PIn: pollen integral; PSS: pollen season start date; PSD: pollen season duration; LOESS: locally estimated scatterplot smoothing; ns: non-significant; NW: northwest; S: south; NE: northeast; W: west; N: north; NL: Netherlands; SE: southeast.
A study provides an interesting clarification, showing that in Trentino-Alto Adige, in Northern Italy, there are two periods during the year when the pollen counts of Artemisia in the air evolve in opposite directions: first, a sharp decrease until the end of August, attributed to native species of mugwort, of which A. vulgaris is the most abundant, then a considerable increase from the beginning of September, mainly due to the invasive late-flowering species A. annua and A. verlotiorum [129]. A comparable phenomenon has been described, over a period limited to ten years, in Central and Eastern Europe [130].
The start of the pollen season does not allow for a definitive conclusion. Admittedly, 50.0% of publications report an increasing earliness [26, 28, 40, 44, 55, 73, 119], with an advancement that can reach 7 to 8 days per decade, but 21.4% note a noticeable delay (for example, of 9 days every ten years in Southern Germany [42]). The remaining studies [45, 51, 81, 83] report no clear trend over the periods examined.
The length of the pollen season equally precludes a definitive stance, since most observations are divided between the absence of a trend [26, 45, 57, 81, 83, 119] and a tendency towards lengthening [28, 40, 42, 44, 51, 55], fluctuating repeatedly around 6 days per decade. Two studies [85, 127] also mention a shortening, although this is not consistent across geographical regions.
Although it belongs to the same botanical family as mugwort and flowers at roughly the same time, ragweed exhibits a rather different pattern, with half of the studies again pointing to an increase in pollen concentrations [26, 27, 56, 62, 90, 110, 121, 131]. Although it is far from being universal [37, 55, 81, 92, 132], this trend can be interpreted as the complex result of two contradictory influences. On the one hand, especially if water stress occurs, the growth of Ambrosia can be disrupted by temperatures exceeding the thermal optimum of this weed, which some authors have somewhat categorically set at 31.7°C [133]. On the other hand, experiments conducted under controlled conditions have revealed that ragweed exhibits developmental plasticity [134], resulting in a thermal tolerance that is far superior to that of mugwort. But above all, it is an invasive plant that continuously spreads into new territories, so that even if the pollen production per inflorescence only increases moderately, remains unchanged, or even decreases slightly due to warming, the amounts of pollen present in the air are likely to experience sharp increases, particularly in sectors at the forefront of colonization. In this context, ragweed pollen production is expected to increase significantly under the projected future climatic conditions. Two complementary studies have calculated that, for the species A. artemisiifolia at least, concentrations could quadruple in Europe by 2050; climate change is thought to account for two-thirds of this increase, with the remaining third attributable to the natural spread of the plant into new areas, its densification in areas where it was already established, and human activities [135, 136].
Analysis of pollen calendars subsequently shows that the ragweed season has shifted to an earlier onset in 50% of cases [26, 55, 59, 110, 137], and to a later onset in 40% [51, 62, 92, 132]. However, these trends are only significant in an earlier study concerning Western Switzerland, where this plant was very scarce at the time [26], and in another study addressing the Northeastern United States [55].
What undoubtedly has the most serious consequences for allergies is that in 70% of cases [55, 59, 92, 110, 132, 134, 137], the ragweed pollen season has lengthened, sometimes substantially, with maxima of 16.6 and 18.0 days per decade at two Canadian sites [134]. It has been demonstrated in North America that the dominant drivers of the increasing season length are a delay in the first autumn frost and an extension of the frost-free period [134]. This trend is expected to continue in Europe until at least the 2040s–2060s [135, 136].
The synthesis of available data indicates a dominant trend toward earlier and more abundant pollen seasons, particularly for winter-spring flowering trees such as birch, cypress, and olive. In contrast, trends for late-pollinating herbaceous species such as grasses or mugwort are less consistent and often region-specific. These variations are taxon-, site-, and period-dependent, with some species even showing opposing trends within the same botanical family, illustrating the complex interactions between biological adaptation and climatic variability. Moreover, it cannot be denied that this literature review has its limitations, due to three factors: the heterogeneity of the methods used, both for the characterization of pollen seasons and for the statistical demonstration of trends; the heterogeneity of the series studied, both in terms of their date and their duration; and the overrepresentation of certain regions, particularly the Mediterranean area. The conclusions stated must therefore always be approached with great caution, and are confined to the most general trends. While the current influence of climate change on pollen production and phenology is well established, the magnitude of its future impact remains uncertain, and the diversity of methodologies and study durations limits the comparability of available data. Nevertheless, most projections support a continued, though possibly attenuated, increase in pollen intensity and season advancement, suggesting partial ecological adaptation.
Despite frequent divergent findings from one sampling location to another, the timing of pollen seasons is primarily dependent on temperature changes measured one to five or six months, or even eight to ten months, before the start of flowering [61, 79, 118]. The example of the Betulaceae is particularly illustrative in this regard. While flower and anther maturation in hazel, alder, and birch tends to be delayed after mild autumns and early winters, with longer vernalization periods [77], it occurs earlier as temperatures rise from mid-winter onwards, with shorter forcing periods [17, 40]. A similar pattern has been observed for mugwort, whose the start of pollination depends closely on the temperature recorded as early as February, while it only flowers in the middle of summer [40]. It should be noted that the start of the pollen season, all species combined, is also influenced by factors affecting short-term pollen release, such as rainfall or lack of wind, and may not coincide exactly with the maturation of the flowers. With regard to the quantities of pollen released, it was noted that higher mean temperature in the previous summer was often significantly associated with a higher seasonal integral for tree pollen, while higher mean temperature in the previous winter was associated with a higher seasonal integral for grass pollen [43]. Changes in rainfall patterns due to global warming are typically less correlated with pollen characteristics than temperature changes are, due largely to the complexity of rainfall distribution over space and time. However, water availability during the period preceding pollination most often promotes the development of grasses and weeds, and therefore their pollen production [40], while a large amount or prolonged precipitation during the flowering period can significantly reduce the amount of pollen in the air. Finally, and this applies to all selected species, there is experimental evidence to suggest that increasing CO2 concentration in the atmosphere stimulates photosynthesis and growth rates, reduces the time required to reach the minimal critical size for floral induction, increases the number of flowers, and enhances pollen production [35, 59, 79, 113]. Nevertheless, it is not always easy to disentangle the direct impact of carbon dioxide (fertilizing effect) from its indirect impact (which involves global warming).
Furthermore, while the trends described for the intensity and timing of pollen seasons are largely undisputed regarding changes in pollen exposure, it would be a serious mistake to attribute all or even most of this to climate change. Many other explanatory factors exist, which operate in very variable proportions. Changes in local or regional land use and land cover play a key role in this regard [91, 93], as do increasing urbanization (and the increasing greening of cities where pollen traps are located), air pollution (which boosts pollen production, at least in certain species), and biological invasions, which are themselves partly, but only partly, linked to climate change.
The evolution of allergic sensitization, however, has been less frequently investigated, particularly in relation to its connection with climate change [20, 23, 88, 95, 100, 121, 138–140]. In Western Liguria, analysis of over 25,000 skin prick tests (1981–2007) revealed increased sensitization to Parietaria, birch, olive, and cypress, species with rising airborne pollen concentrations, while grass sensitization remained stable in line with unchanged Poaceae pollen loads [20]. Other studies in the same region found no consistent link between pollen trends and sensitization frequencies. In Central Germany (1998–2017), sensitization to birch, hazel, alder, and grasses increased markedly despite stable pollen counts [23]. Overall, available evidence suggests that pollen exposure and sensitization prevalence do not always evolve in parallel, reflecting the multifactorial nature of allergic disease development. A better understanding of sensitization profiles and their temporal evolution is therefore needed to clarify how environmental and climatic drivers shape allergic susceptibility across populations.
Beyond these gradual shifts, extreme weather events such as thunderstorm asthma represent an emerging manifestation of climate-related risk [141]. During such events, pollen grains can rupture into respirable allergenic particles, triggering acute asthma attacks even in individuals with mild or previously unrecognized allergic disease. The growing frequency of these phenomena underscores the need for integrated surveillance that combines aerobiology, meteorology, and clinical reporting, as well as for targeted public health preparedness.
In the years and decades to come, the anticipation of a higher burden of allergic diseases will inevitably influence both clinical practice and public health planning [142]. Allergen immunotherapy (AIT), the only treatment capable of modifying the natural course of allergic disease, will remain central to managing climate-related changes in allergic respiratory conditions. Earlier and more intense pollen exposure may require advancing the initiation of AIT or adjusting treatment doses and duration. But there are many other areas where the medical profession, as a reliable source of knowledge, can contribute to the implementation of effective primary and secondary prevention strategies. Among other examples, physicians have a key role to play in ensuring that, in urban and peri-urban environments, ornamental plantings contain an increasingly smaller proportion of species that are not only highly allergenic but also highly sensitive to global change. Ultimately, strengthening longitudinal pollen monitoring, harmonizing methodologies, and fostering collaboration between aerobiologists, clinicians, environmental professionals, urban planners, and policymakers will be essential to improving forecasting, prevention, and personalized treatments in a rapidly changing environment.
AIT: allergen immunotherapy
PIn: pollen integral
PSD: pollen season duration
PSS: pollen season start date
JPB: Conceptualization, Formal analysis, Writing—original draft, Writing—review & editing. LM: Conceptualization, Writing—review & editing. Both authors read and approved the submitted version.
Laurent Mascarell, who is the Editorial Board Member and Guest Editor of Exploration of Asthma & Allergy, had no involvement in the decision-making or the review process of this manuscript. LM is also an employee of Stallergenes Greer. The other author declares no conflicts of interest.
Not applicable.
Not applicable.
Not applicable.
Not applicable.
Not applicable.
© The Author(s) 2026.
Open Exploration maintains a neutral stance on jurisdictional claims in published institutional affiliations and maps. All opinions expressed in this article are the personal views of the author(s) and do not represent the stance of the editorial team or the publisher.
Copyright: © The Author(s) 2026. This is an Open Access article licensed under a Creative Commons Attribution 4.0 International License (https://creativecommons.org/licenses/by/4.0/), which permits unrestricted use, sharing, adaptation, distribution and reproduction in any medium or format, for any purpose, even commercially, as long as you give appropriate credit to the original author(s) and the source, provide a link to the Creative Commons license, and indicate if changes were made.

Nhan Pham-Thi, Pascal Demoly
Alessandro Cinquantasei ... Marcello Albanesi
Nicolas Visez ... Romain Courault
Matthew C. Bell ... Allison J. Burbank
Jeremy Corriger ... Julien Goret
Natalia Rodríguez-Otero
