 Review

Affiliation:
1Department of Gastroenterology, University Hospital Center Rijeka, 51000 Rijeka, Croatia
2School of Medicine, University of Rijeka, 51000 Rijeka, Croatia
Email: mikolasevic@gmail.com
Affiliation:
2School of Medicine, University of Rijeka, 51000 Rijeka, Croatia
Affiliation:
2School of Medicine, University of Rijeka, 51000 Rijeka, Croatia
Affiliation:
2School of Medicine, University of Rijeka, 51000 Rijeka, Croatia
Affiliation:
2School of Medicine, University of Rijeka, 51000 Rijeka, Croatia
Affiliation:
2School of Medicine, University of Rijeka, 51000 Rijeka, Croatia
Affiliation:
2School of Medicine, University of Rijeka, 51000 Rijeka, Croatia
Affiliation:
2School of Medicine, University of Rijeka, 51000 Rijeka, Croatia
Affiliation:
2School of Medicine, University of Rijeka, 51000 Rijeka, Croatia
Affiliation:
2School of Medicine, University of Rijeka, 51000 Rijeka, Croatia
Affiliation:
2School of Medicine, University of Rijeka, 51000 Rijeka, Croatia
Affiliation:
2School of Medicine, University of Rijeka, 51000 Rijeka, Croatia
Affiliation:
2School of Medicine, University of Rijeka, 51000 Rijeka, Croatia
Affiliation:
2School of Medicine, University of Rijeka, 51000 Rijeka, Croatia
Affiliation:
2School of Medicine, University of Rijeka, 51000 Rijeka, Croatia
Affiliation:
2School of Medicine, University of Rijeka, 51000 Rijeka, Croatia
Affiliation:
2School of Medicine, University of Rijeka, 51000 Rijeka, Croatia
Affiliation:
1Department of Gastroenterology, University Hospital Center Rijeka, 51000 Rijeka, Croatia
Affiliation:
1Department of Gastroenterology, University Hospital Center Rijeka, 51000 Rijeka, Croatia
2School of Medicine, University of Rijeka, 51000 Rijeka, Croatia
Explor Med. 2020;1:205–217 DOI: https://doi.org/10.37349/emed.2020.00014
Received: May 15, 2020 Accepted: June 15, 2020 Published: August 31, 2020
Academic Editor: Lindsay A. Farrer, Boston University School of Medicine, USA
The article belongs to the special issue Exploring NAFLD/NASH
Nonalcoholic fatty liver disease (NAFLD) is a serious condition that can lead to fibrosis, cirrhosis, and hepatocellular carcinoma. NAFLD is associated with metabolic syndrome (MetS) and all of its components. According to data, around 25–30% of population has NAFLD. Giving the growing incidence of MetS, obesity and diabetes mellitus type 2, NAFLD related terminal-stage liver disease is becoming prevailing indication for liver transplantation. In order to prevent terminal stage of this disease, it is crucial to determine those that are in risk group, to modify their risk factors and monitor their potential progression. In the absence of other causes of chronic liver disease, the prime diagnosis of NAFLD in daily clinical practice includes anamnesis, laboratory results (increased levels of aminotransferases and gammaglutamil transferases) and imaging methods. The biggest challenge with NAFLD patients is to differentiate simple steatosis from nonalcoholic steatohepatitis, and detection of fibrosis, that is the main driver in NAFLD progression. The gold standard for NAFLD diagnosis still remains the liver biopsy (LB). However, in recent years many noninvasive methods were invented, such as transient elastography (TE). TE (FibroScan®, Echosens, Paris, France) is used for diagnosis of pathological differences of liver stiffness measurement (LSM) and controlled attenuation parameter (CAP). Investigations in the last years have confirmed that elastographic parameters of steatsis (CAP) and fibrosis (LSM) are reliable biomarkers to non-invasively assess liver steatosis and fibrosis respectively in NAFLD patients. A quick, straightforward and non-invasive method for NAFLD screening in patients with MetS components is TE-CAP. Once diagnosed, the next step is to determine the presence of fibrosis by LSM which should point out high risk patients. Those patients should be referred to hepatologists. LB may be avoided in a substantial number of patients if TE with CAP is used for screening.
Nonalcoholic fatty liver disease (NAFLD) is the most common chronic liver disease that affects around 25% of population. NAFLD is a broad spectrum of diseases that include simple fatty infiltration, nonalcoholic steatohepatitis (NASH), which is defined as the presence of fat leading to inflammatory damage to hepatocytes, fibrosis and finally cirrhosis. The importance of NAFLD lies in the possibility of its gradual progress to advanced fibrosis, cirrhosis, and hepatocellular carcinoma (HCC). Once that cirrhosis develops, it has all the clinical manifestations as cirrhosis of any other etiology. The pathophysiology is complex and involves multiple concurrent mechanisms, in the context of abnormal metabolic processes that arise mostly in individuals with risk factors. Co-morbidities associated with NAFLD include obesity, type 2 diabetes mellitus (T2DM), arterial hypertension and dyslipidemia, as traits of metabolic syndrome (MetS). Recently, attention has also been aimed at gut-liver axis as a part of the crucial role in this network of multiple interactions. Genetic background, diet and antibiotic usage are the main factors that can affect and alter intestinal microbiota. NAFLD cannot be distinguished from alcoholic liver disease histologically. Thus, to diagnose NAFLD underlying alcohol usage must be ruled out, as well as the absence of causes such as viral hepatitis or hereditary liver disease. Most patients are asymptomatic, although some may experience malaise, fatigue or abdominal discomfort in the right upper quadrant. While not specific or sensitive, elevated liver enzymes are often first sign of the disease. However, hepatomegaly and splenomegaly can be first sign in some cases. Noninvasive diagnostic tests, as abdominal ultrasound and transient elastography (TE), are usually sufficient for diagnosis, but liver biopsy (LB) remains the gold standard. In the management of NAFLD, it is important to identify those at risk, to modify their risk factors and monitor their potential progression. Treatment primary includes elimination of risk factors, including diet and lifestyle modification. In patients who fail to achieve the change in their lifestyle, pharmacological therapy is considered, and is mostly recommended on an individual basis [1–3]. Because of space limitations, this review will mainly focus on the detection of steatosis and fibrosis by TE with controlled attenuation parameter (CAP).
MetS is a clinical syndrome that includes obesity, dyslipidemia, arterial hypertension and T2DM [3]. NAFLD is strongly linked with all segements of MetS and it is in fact liver manifestation of MetS. The prevalence rates of NAFLD in patients with hypertension, hyperlipidemia, T2DM, and obesity are approximately 50%, 50–90%, 30–50%, and 80–90%, respectively [3]. Some authors are suggesting that NAFLD could be defined as a fifth component of the MetS [3]. Both conditions are related with insulin resistance (IR), the main pathogenetic factor underlying NAFLD and MetS. One-third of patients with NAFLD have MetS and 90% of NAFLD patients have at least one component of MetS [4–12]. On the other hand, this bidirectionality is not only limited to the incident of NAFLD and MetS; it also affects MetS components and disease severity [3]. NAFLD patients have a risk of developing arterial hypertension [hazard ratio (HR) = 1.07, 95% confidence interval (CI): 1.00–1.15 for mild steatosis; HR = 1.14, 95% CI: 1.00–1.30 for severe steatosis] and the risk of T2DM (twofold risk increase) [7, 13]. Depending on the number of MetS segments present, the risk of developing NAFLD and the severity of NAFLD are higher.
NAFLD is associated with obesity, specifically with abdominal obesity as a component of MetS [14, 15]. Abdominal fat overage is a fundamental determinant in NAFLD pathogenesis due to its association with IR and a possible source of free fatty acids (FFA) [16]. Visceral fat releases higher amounts of adipokines and excess of FFA into the portal vein, so the liver is susceptible to higher concentrations of FFA. In the liver in patients with NAFLD there is 59% of accumulated triacylglycerol which is obtained from circulating FFA [16]. Adipose tissue consists of adipocytes, vascular endothelial cells, mesenchymal cells and macrophages and is actually an endocrine organ that secretes adipokines. Adipocytes release leptin into circulation in response to changes in body weight. In obese patients with NAFLD leptin levels are elevated and that is directly related to the severity of steatosis [16].
Insulin function is impaired in patients with NAFLD and/or MetS. This results in hyperglycemia [16]. Abdominal obesity, as one of the central features of the MetS, is associated with increased release of inflammatory cytokines, such as tumor necrosis factor α (TNFα) and FFA, from visceral adipose tissue. Because of that, the accumulation of hepatic diacylglycerols and the activation of inflammatory pathways are promoted. Diacylglycerols activate protein kinase ε. It inhibits insulin signaling which leads to hepatic IR [17, 18].
The deregulation of insulin mediated control of hepatic production of glucose and lipids appears to be a main event in the development of NAFLD. Normally, insulin impairs gluconeogenesis while promoting lipogenesis. There is a paradoxical situation in NAFLD, especially in the context of T2DM. IR results in a reduced ability to inhibit gluconeogenesis, but insulin driven lipogenesis still occurs and is even enhanced [19–31].
Approximately half of patients with hypertension have NAFLD [22]. Numerous mechanisms have been proposed to explain the commencement of hypertension in MetS. The underlying cause of MetS is IR, which leads to increased sodium retention in the kidney, impaired vasodilation, and activation of the sympathetic part of the autonomic nervous system [15]. Impact on the development of hypertension in MetS patients also has increase in the secretion of leptin, resistin and angiotensin from adipose tissue, and hyperinsulinemia directly causes structural damage to the endothelium and its apoptosis [17].
Another component of MetS is dyslipidemia. According to the literature 62% of patients with NAFLD have elevated triglyceride levels and 54% have reduced high-density lipoprotein cholesterol (HDL-C) levels [29]. Usually, insulin has a role in reducing production of very-low-density lipoprotein (VLDL) through inhibiting lipolysis of adipose tissue and it reduces hepatic production of VLDL [30]. However, in those patients who have NAFLD, insulin role is diminished. Because of that there is an increase in serum triglycerides levels as well as decrease in HDL levels [31]. Proposed mechanism of pathophysiology regarding the MetS and steatosis development are shown in Figure 1.
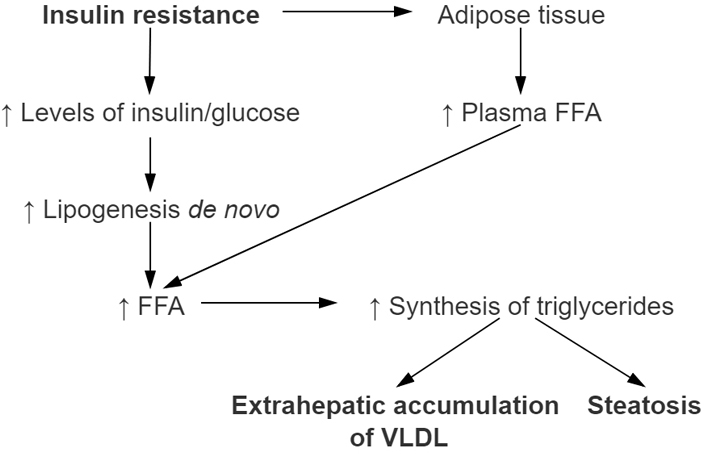
Development of nonalcoholic hepatic steatosis in relation with metabolic syndrome (MetSy). The main role in the development of nonalcoholic hepatic steatosis has IR which promotes higher concentration of FFA released in plasma. Therefore, more FFAs are then taken up by the liver. Increased dietary fat intake promotes increasing formation of ‘de novo’ synthesis of FFA in the liver as well. Increasing amount of FFA in the liver through process of esterification leads to increase of triglyceride synthesis. Steatosis of liver occurs when their accumulation occurs. HSL: hormone-sensitive lipase; TG: triglyceride; PPAR-γ: peroxisome proliferator-activated receptor gamma; SREBP-1: sterol regulatory element binding protein 1; PPAR-α: peroxisome proliferator-activated receptor α; CPT-I: carnitine palmitoyltransferase I; VLDL: very-low-density lipoproteins
In everyday clinical practice, the initial diagnosis of NAFLD is based on anamnesis, laboratory findings (increased levels of aminotransferases and gammaglutamil transferases) and imaging methods in the absence of other causes of chronic liver disease. Key issues in NAFLD patients are the differentiation between simple steatosis, NASH and detection of fibrosis because that is the main driver in NAFLD progression [3, 32–34]. LB has been the gold standard to stage steatosis, inflammation and fibrosis in the liver for a long time. It is being used to assess patients with viral hepatitis (especially patients with hepatitis B or C virus infection), to determine stage of the disease and to decide if treatment should be pursued. The disadvantages of the LB are that it is an invasive test, patient must be hospitalized for half a day, it is expensive, and it is associated with some risks, such as pain and bleeding. Bleeding due to LB is rare, but it presents a significant risk when it occurs. Additionally, it samples only a small piece of the liver parenchyma and it can cause incorrect staging if taken sample is not representative of the rest of the liver. Consequently, this can lead to sampling error and that may lead to overstaging or understaging of fibrosis. Sampling error occurs in up to 25–30% of liver biopsies. Another disadvantage is that different pathologists can interpret the same sample differently. This can result in variations in liver disease staging [3, 33, 35]. Considering the data that around 25–50% of population has NAFLD, LB evaluation is nonpractical, and noninvasive methods for diagnosing NASH and fibrosis are needed [1]. The diagnosis of NAFLD represents a clinical challenge in everyday clinical practice since the majority of NAFLD patients are asymptomatic and aminotransferase are elevated in approximately 50% of NAFLD patients [3]. Therefore, a numerous laboratory test and biomarkers for steatosis, inflammation and fibrosis detection as well as imaging methods are intensively investigated in the last decade.
In the context of noninvasive methods there are two different approaches that although are different, their combination is useful in everyday clinical practice. First approach is “Biological”. It is based on the quantification of biomarkers in serum samples [33]. And second, “Physical” approach is based on the measurement of liver stiffness. For the measurement of liver stiffness, we can use either ultrasound- or magnetic resonance-based elastography techniques [33].
Several steatosis scores such as hepatic steatosis index, NAFLD liver fat score and fatty liver index are used to detect or grade liver steatosis. A proportion of patients with simple steatosis will develop NASH. In the term of NASH, circulating keratin 18 fragments were analyzed to discriminate NASH from simple steatosis, and M30 was more intensively studied than M65 [33]. The most important risk factor for liver related and overall morbidity and mortality in NAFLD patients is liver fibrosis. There are a lot of serum markers that were investigated for fibrosis detection in various chronic liver diseases. Some of them, such as fibrosis-4 (FIB-4) or BARD score were originally designed to stage fibrosis in patients with viral hepatitis. On the other hand, NFS was initially designed to predict the fibrosis in NAFLD patients. Nowadays, the most investigated fibrosis biomarkers are NFS and FIB-4 [33]. Both FIB-4 and NFS scores are clinically useful to exclude, not predict, advanced fibrosis. In addition, both FIB-4 and NFS scores also have an acceptable clinical utility in the exclusion of advanced fibrosis in patients with diabetes and NAFLD [23, 24]. Hoverer, the practical advantages of serum biomarkers are their high applicability and their potential widespread availability (nonpatented), but most of this serum biomarker have a very good negative predictive value for excluding advanced fibrosis, but poor positive predictive value. This data is suggesting that serum biomarkers can be used to exclude advanced fibrosis and, prevent LB in patients without fibrosis. Also it is important to note that this markers are not liver-specific and their results can be influenced by comorbid conditions [33–39]. In conclusion, none of the currently accessible serum biomarkers can distinguish NASH from simple steatosis with high specificity and sensitivity, nevertheless, in combination with different approaches their diagnostic accuracy can be enhanced [37].
Today we have two different kinds of elastography methods: ultrasound-based or magnetic resonance-based. This review will focus on the TE, because of space limitations.
TE is a non-invasive, simple, safe, and efficient method which is being used to diagnose pathological variations in liver stiffness-LSM (liver stiffness measurement) and steatosis-CAP. For this method, most used device is FibroScan® (Echosens, Paris, France). FibroScan® works by calculating acceleration of shear waves that go through liver tissue. The device consists of an ultrasound probe and a small transducer that estimates the acceleration and then converts it into liver stiffness [3, 35]. TE provides a number of advantages in comparison to LB. Advantages of TE are the fact that it is a noninvasive test, it can be performed at the point of care, it is not painful, sedation is not needed, it is significantly less expensive, it has not been linked with any side effects and the results are immediately available, so clinicians can use them to make decisions during patients’ visits. Ordinarily, the examination takes around 5–10 min to perform and causes no patient distress and thus is very well accepted among the patients [3, 35, 39]. This method can be completed in out clinic environment and patient can get results right after the exam is over. FibroScan® results for LSM grade from 2.5 kPa to 75 kPa and CAP from 100 decibels per meter (dB/m) to 400 dB/m [33]. According to the literature, 90–95% of people without hepatopathies have LSM lesser than 7 kPa, median being 5.3 kPa [39]. However, interpretation of results can differ from patient to patient, depending on liver disease etiology and underlying comorbidities that should be considered. Namely, the interpretation of the TE readings may vary to some degree dependent of the cause of liver disease. Interpretation of the results is the best when performed synchronously with other clinical and/or biochemical parameters and by someone experienced in managing chronic liver disease [39]. The clinical interpretation of TE results should always be in the hands of an expert clinician and should be based on information regarding patient demographics, disease etiology and necessary laboratory parameters at his/her disposal [39–42].
Having in mind postprandial blood flow which undoubtedly increases liver stiffness, the patients are previously informed to diet at least 2 h before the procedure [3, 40]. During the procedure, the patient is lying down, placing the right arm beneath the head in maximal abduction. The operator places an ultrasound-like probe along with the intercostal space on the skin over the liver area, generally in the right mid-axillary line [39]. With every vibration wave, the patient feels a gentle ‘flip’ [39]. Once the operator established the area of at least 6 cm compact and free of large vascular formation or gallbladder, to have reliable results, 10 measurements are necessary with success rate of at least 60% and an interquartile amplitude fewer than 30%. It is extremely important to insure accuracy and reproducibility of this method in order for the exam to be credible [35].
Nowadays, TE can be performed with both medium (M) and extra-large (XL) probes, depending on patient’s BMI and amount of fat tissue in the thoracic and abdominal area. Patients with obesity often cannot get valid results with M probe, thus in recent years, XL probe was developed. A study that was published few years ago analyzed 276 patients with chronic liver diseases and BMI greater than 28 kg/m2 [41]. Unreliable results were those with less than 10 valid measurements (LSM), interquantile range greater than 30 % or success rate lesser than 60% while failed results were those where liver stiffness could not be measured. Failure rate was lesser with XL probes than with M probes (1.1% and 16%, respectively). According to this study, XL probes proved to provide more reliable results than M probes (73% and 50%, respectively) and XL probes were efficient in 61% of patients where M probes were not. Finally, M and XL probes have equivalent efficiency (AUROC scores 0.86 and 0.83, respectively) and should both be used, depending on the patient, but XL probes are more successful with patients with obesity [41].
Nonetheless TE has been validated as a gold-standard alternative to LB in most of chronic liver diseases [33]. The patients with dyslipidemia, altered aminotransferase levels, autoimmune hepatitis, primary sclerosing cholangitis, primary biliary cirrhosis, chronic hepatitis B and C, alcoholic fatty liver disease and NAFLD are all to be considered for TE assessment. In all previously mentioned indications, TE can be used as a follow-up method that can evaluate current state of liver tissue [43]. Although TE has been proposed as a non-invasive tool to measure liver fibrosis, TE actually measures the shear wave speed through the liver which reflects liver stiffness and not actual amount of fibrosis in the liver. Regarding the previous statement; conditions that are more likely to give faulty results are acute hepatitis, ascites, pregnancy, accutization of congestive heart failure (specifically of valvular etiology) and cholestasis. The main reason behind falsely high estimates of the liver fibrosis lies in acute inflammation of liver tissue and increased central venous pressure. Hence, all previously mentioned conditions are (relative) contraindications for immediate TE as a diagnostic (follow-up) method [44].
There are no absolute contraindications for this method, although the presence of ascites prevents adequate propagation of the vibration wave hence frequently resulting in failure to obtain proper readings. The manufacturer also advises against the use of this device during pregnancy and in patients with implemented pacemaker. Children and lean patients with narrow intercostal spaces also have higher failure rates, but newer pediatric S2 probes are now available to improve reliability in this regard [45].
Liver steatosis can histologically be defined as a fatty deposit presence in ≥ 5% of hepatocytes [3]. Over time, steatosis can advance into irreversible damage of the liver, which can result in fibrosis, cirrhosis and finally HCC. During the last ten years, a great efforts regarding in the context of reliable non-invasive methods for liver steatosis detection and quantification have been made. According to studies with a LB as a gold standard there was a strong correlation of CAP with fat accumulation in the liver; moreover, CAP has been reported to be useful in the diagnosis of steatosis of the liver in numerous chronic liver diseases [3, 46–51]. CAP is one of the aforementioned ultrasound-based techniques which enable quantification of hepatic fat. CAP measures the degree of ultrasound attenuation caused by hepatic fat at the frequency of 3.5 MHz-taking advantage of “Vibration-controlled elastography (VCTE™)” implemented on FibroScan® [28]. CAP results are stated in dB/m and range from 100–400 dB/m [28], the final result being the median value of 10 valid measurements [46, 47].
It has been shown repeatedly that CAP is able to accurately differentiate grades of hepatic steatosis, correlating well with results of LB [46, 47]. It is also important to note that while the CAP threshold linked with significant steatosis (> 33% of hepatocytes) varied among different studies, values above 250 dB/m consistently correlated with at least moderate steatosis. Moreover, CAP values were not influenced by the presence of inflammation, fibrosis or cirrhosis [43, 48]. It is important to note that in comparison to LSM in which the cut-off values depend on the type of liver disease, the CAP cut-off values are not impacted by the etiology of the chronic liver disease [3]. Some studies show that higher CAP values are associated with the waist circumference and level of triglycerides in blood [50]. According to our study, CAP was related to MetS and its individual components [52].
In the last 8 years a few studies regarding optimal cut-off values for each steatosis grade (range from S0, which suggests no steatosis, to S3, which suggests the highest level of steatosis) were published [3, 45–52]. Namely, for S ≥ 1 the CAP cut-off values range from 214 to 289 dB/m, for S ≥ 2, the CAP cut-off values range from 255 to 311 dB/m and for S3 the CAP cut-off values range from 281 to 310 dB/m. The conclusion of this data was that CAP is useful in the detection of S ≥ 1, S ≥ 2, and S3 steatosis respectively as a result of its good sensitivity and specificity. One year ago, a meta-analysis analyzed 9 studies involving 1, 297 patients with LB-proven NAFLD. The mean AUROC value for CAP in the diagnosis of mild, moderate, and severe steatosis was 0.96, 0.82 and 0.70, respectively. A subgroup analysis suggested that variation in the cutoffs, age, geographic regions and obesity could be the potential sources of heterogeneity in the diagnosis of moderate to severe steatosis [45]. More recently, last year Eddowes et al. [51], estimated the accuracy of CAP and LSM only in patients with NAFLD. The study included in 385 patients in the final analysis. The highest accuracy was at the S ≥ S1 threshold, with an AUROC score of 0.87 (95% CI 0.82–0.92), sensitivity of 0.80 (0.75–0.84) and specificity of 0.83 (0.69–0.92) at a threshold of 302 dB/m selected by maximizing Youden’s index. There was an AUC of 0.77 (0.71–0.82) for the S ≥ S2 threshold, with the sensitivity of 0.70 (0.63–0.75) and specificity of 0.76 (0.68–0.83) at the threshold of 331 dB/m maximizing Youden’s index and an AUROC score of 0.70 (0.64–0.75) for the S = S3 threshold with the sensitivity of 0.72 (0.63–0.79) and a specificity of 0.63 (0.56–0.69) at the threshold of 337 dB/m maximizing Youden’s index. According to their results, CAP and LSMs by FibroScan assess liver steatosis and fibrosis, respectively, with AUROC values ranging from 0.7 to 0.89. In contrast to earlier data, steatosis and probe type did not affect LSMs [51].
In conclusion, CAP measurement is excellent tool for diagnosis and grading of steatosis and follow-up those patients and if there are no accurate measures with M probe, it is recommended to use XL probe for obese patients.
Specific biomarkers are required to provide the three-key information: the amount of excess fat present in the liver, the level of inflammation and the level of fibrosis. In NAFLD patients, the most important factor is the assessment of fibrosis severity and monitoring fibrosis progression. As it was mentioned, most patients with chronic liver diseases remain asymptomatic until their liver function is jeopardized; therefore, the identification of the presence and severity of liver fibrosis persists a great clinical interest and clinical challenge. Regarding the fact that we still have no adequate therapy for NAFLD patients, identification of high-risk patients (those with significant and advanced fibrosis) is the only effective method in preventing liver related and overall complications. LSM by TE is a reliable method for noninvasively staging liver fibrosis. Most hepatic complications appear in patients with advanced fibrosis. LSM not only represents the degree of liver fibrosis but also predicts complications such as portal hypertension, varices requiring treatment, cirrhotic complications and HCC [52]. LSM by TE also predicts the risk of hepatic complications or death in patients with chronic liver disease [53–55]. The presence of significantly elevated elastographic values LSM on TE may help us decide who appropriate patient to perform LB is.
The main initial clinical focus of LSM was to assess the stage of liver fibrosis in patients with chronic hepatitis B and C and to reduce the need for LB as an invasive method [3]. Later, studies were investigated the usefulness of LSM in NAFLD population.
Liver stiffness values in healthy people is 5.3 kPa (median is 1.5 kPa) while in healthy people with MetS is 6.5 kPa (median is 1.6 kPa) [56]. Border values of liver stiffness need to be determined in each chronic liver disease separately. In NAFLD those are < 7 kPa for F1 or mild fibrosis stage, 7.1–8.8 kPa for F2 or significant fibrosis stage, 8.9–11.6 kPa for F3 or advanced fibrosis stage and > 11.6 kPa for F4 or cirrhosis stage [57]. For F1 stage there are no additional procedures needed, for F2 stage there is biopsy or other non-invasive methods needed while for F3 and F4 stages treatment is needed [58]. If LSM is < 8 kPa (negative predicted value 94–100%) or enhanced liver fibrosis (ELF) test < 9.5, severe fibrosis/cirrhosis can be excluded with high probability and the test should be repeated within one year. In the case of findings of high fibrosis (LSM ≥ 8 kPa, ELF ≥ 9.5), a LB should be considered for reliable confirmation of the stage of fibrosis (positive predicted value of TE for severe fibrosis/cirrhosis is 47–70%). Also, evaluation of other histological components and comorbidities must be done [59–62].
Already mentioned, study from 2019 [51] included 384 patients with valid LSM and interpretable LB. The stage of fibrosis was as follows: no fibrosis (F0) = 62 (17%), minimal fibrosis (F1) = 86 (23%), moderate fibrosis (F2) = 85 (23%), advanced fibrosis (F3) = 106 (28%), and severe fibrosis (F4) = 34 (9%). LSM was notably different between all stages of fibrosis, except of F0 and F1 (Kruskal-Wallis H = 119.8, P < 10–16; Dunn’s post hoc tests, P = 1 between LSM in F0 and LSM in F1, P < 0.05 otherwise). AUC as well as diagnostic performance of LSM cutoff values were optimized using Youden’s index, a sensitivity of 90% or a specificity of 90%. The highest accuracy was at the F = F4 threshold, with an AUC of 0.89 (95% CI 0.84–0.93) and sensitivity of 0.85 (0.69–0.95) and specificity of 0.79 (0.74–0.83) at a threshold of 13.6 kPa selected by maximizing Youden’s index. The lower fibrosis thresholds was the more the accuracy of AUROC dropped (0.75–0.84). For F ≥ F3 with the corresponding sensitivity of 0.71 (0.62–0.78) and a specificity of 0.75 (0.69–0.80) at a threshold of 9.7 kPa maximizing the Youden’s index and to an AUROC of 0.77 (0.72–0.82) for the F ≥ F2 threshold, with the corresponding sensitivity of 0.71 (0.64–0.77) and specificity of 0.70 (0.62–0.77) at the threshold of 8.2 kPa maximizing the Youden’s index [<hyllink targ="" addrs="" subaddr="bookmark36">51</hyllink>]. Furthermore, the connection of LSM values and type of probe used was evaluated, as well as the connection of LSM values and histological parameters. There was not a significant difference between LSM and type of probe used found, with P = 0.55. However, histological parameters were associated with LSM: stage of fibrosis (P < 10–16), grade of ballooning (P < 10–7), grade of portal inflammation (P < 10–4), grade of steatosis (P = 0.004) and grade of lobular inflammation (P < 10–6), respectively. However, when a multivariable linear regression analysis was performed, the stage of fibrosis was the only variable that was connected to LSM with P < 10–16. There was no significant difference between LSM value and type of probe used nor between LSM value and grade of steatosis [51].
In conclusion, elastographic parameters of steatosis (CAP) and fibrosis (LSM) are good methods of mass screening for NAFLD, which is important because one third of the population has NAFLD [<hyllink targ="" addrs="" subaddr="bookmark39">54</hyllink>, 55].
The usefulness of TE was investigated in the prediction of chronic liver disease complications such as portal hypertension. In a prospective study [<hyllink targ="" addrs="" subaddr="bookmark45">62</hyllink>], 100 patients with chronic liver disease underwent both LSM as well as hepatic venous pressure gradient (HVPG) measurements. After 2-year follow-up, LSM and HVPG had similar success in diagnosis of liver disease related complications. LSM had AUC of 0.837, while HVPG had AUC of 0.815. Considering that hepatic venous pressure gradient measurement is an invasive method with its complications, measurements of liver stiffness could be used as a clinical exam to bypass invasive procedures. Thus, TE may potentially be practical in identifying patients who are at risk of developing varices as a consequence of portal hypertension.
Additionally, in a prospective study [63] on 866 patients who were hepatitis C virus-RNA positive, association between LSM and HCC development was examined. LSM was performed on all patients and after 3 years follow-up 77 patients developed HCC. Patients with increased LSM proved to have significantly greater risk of developing HCC. We have to keep in mind that LSM cannot completely replace LB in this population. However, this non-invasive method can be helpful in calculation of the possibility of HCC development because it has been proven that LSM highly correlates to liver fibrosis and we know that fibrosis is the main driver for HCC development.
Interestingly, usefulness of LSM is being examined in the diagnosis of preeclampsia in pregnant women. Hypertension and preeclampsia are potentially dangerous complications during pregnancy which can affect both pregnant women and fetus. In a study in 2018 from Ammon et al. [64], 537 pregnant women were subjected to TE where LSM was measured. When comparing control group and women with complications related to pregnancy, this study proved that LSM was considerably higher in women with complications (P < 0.0001). LSM was proven to be an independent prognostic factor for preeclampsia with odds ratio being 2.05; cut off value in this study was 7.6 kPa. Similarly, in a study from Frank Wolf et al. [65], 32 patients with preeclampsia diagnosed using regular criteria and 16 patients without preeclampsia were compared. The study proved that LSM was higher in women with preeclampsia (mean 4.57 kPa vs. 3.66 kPa in normotensive women, P = 0.01).
Finally, given the associations between NAFLD, cardiovascular diseases (CVD) and NAFLD and chronic kidney diseases (CKD), we had investigated the association between CAP and LSM with CVD and CKD risk. We had demonstrated the positive association among this variable [66, 67]. Thus, additional studies should figure whether patients with NAFLD with both increased CAP and particularly LSM might benefit from early CVD and CKD screening [3].
Elastographic parameters (CAP and LSM by FibroScan) are reliable biomarkers to non-invasively assess liver steatosis and fibrosis respectively in NAFLD patients. A quick, easy and non-invasive mass screening for NAFLD in patients with one or more MetS components may be rational approach with TE-CAP. Once NAFLD is diagnosed, the assessment of fibrosis by LSM should recognize high-risk patients that should be referred to hepatologists. If TE with CAP is used as a screening method, LB may accordingly be avoided in a considerable number of patients.
CAP: controlled attenuation parameter
CI: confidence interval
CKD: chronic kidney diseases
CPT-I: carnitine palmitoyltransferase I
CVD: cardiovascular diseases
ELF: enhanced liver fibrosis
F0: no fibrosis
F1: minimal fibrosis
F2: moderate fibrosis
F3: advanced fibrosis
F4: severe fibrosis
FFA: free fatty acids
FIB-4: fibrosis-4
HCC: hepatocellular carcinoma
HR: hazard ratio
HSL: hormone-sensitive lipase
HVPG: hepatic venous pressure gradient
IR: insulin resistance
LB: liver biopsy
LSM: liver stiffness measurement
MetS: metabolic syndrome
NAFLD: nonalcoholic fatty liver disease
NASH: nonalcoholic steatohepatitis
PPAR-α: peroxisome proliferator-activated receptor α
PPAR-γ: peroxisome proliferator-activated receptor γ
SREBP-1: sterol regulatory element binding protein 1
T2DM: type 2 diabetes mellitus
TE: transient elastography
TG: triglyceride
VLDL: very-low-density lipoproteins
IM, SM, NS, AL, TJ, MK, PM, NK, DK, IJ, IK, DJ, DI, IE, VH, DC, ED, DE, and BV contributed with conception and design of the study. IM, SM and NS organized the database. IM, SM, NS, AL, TJ, MK, PM, NK, DK, IJ, IK, DK, DI, IE, VH, DC, ED, DE, and BV wrote the first draft of the manuscript. All authors contributed to manuscript revision, read and approved the submitted version.
The authors declare that they have no conflicts of interest.
Not applicable.
Not applicable.
Not applicable.
Not applicable.
Not applicable.
© The Author(s) 2020.
Copyright: © The Author(s) 2020. This is an Open Access article licensed under a Creative Commons Attribution 4.0 International License (https://creativecommons.org/licenses/by/4.0/), which permits unrestricted use, sharing, adaptation, distribution and reproduction in any medium or format, for any purpose, even commercially, as long as you give appropriate credit to the original author(s) and the source, provide a link to the Creative Commons license, and indicate if changes were made.

Noel C. Salvoza ... Natalia Rosso
Amedeo Lonardo, Stefano Ballestri
Marvin Ryou ... Gyorgy Baffy
Michael Doulberis ... Stergios A. Polyzos
Marica Meroni ... Paola Dongiovanni
Valerio Rosato ... Marcello Persico
Carlo Acierno ... Ferdinando Carlo Sasso
Rosa Lombardi ... Anna Ludovica Fracanzani
Angelo Di Vincenzo ... Marco Rossato
Angelo Colucci ... Claudia Mandato
