Review

Affiliation:
School of Pharmaceutical Sciences, Lingaya’s Vidyapeeth, Faridabad 121002, India
Email: tausif@lingayasvidyapeeth.edu.in
ORCID: https://orcid.org/0000-0002-4423-0970
Explor Med. 2022;3:617–638 DOI: https://doi.org/10.37349/emed.2022.00118
Received: July 17, 2022 Accepted: October 09, 2022 Published: December 31, 2022
Academic Editor: Md Noushad Javed, K.R. Mangalam University, India
The article belongs to the special issue Techniques in Repurposing and Targeted Delivery: Bringing a New Life to Shelved Drugs
The aim of this review is to discuss the development of nanostructured lipid carrier (NLC) by the application of quality by design (QbD). QbD started with the evolution of the quality concept and slow adaptation of quality guidelines, which has now become a regulatory requirement. In this review, brief history and elements of QbD including risk assessment (RA) have been discussed followed by the design of experiments (DoEs) that acts as a tool to analyze the input whose variation can optimize the output with the desired goal. NLC is a versatile delivery system as researchers widely use it to administer therapeutics with different physicochemical properties. The surface of NLC can be modified, making it a suitable delivery system with targeting potential for therapeutics. Implementation of QbD provides a high-quality robust formulation that can consistently meet the patient’s requirement throughout its life cycle without compromising the safety and effectiveness of the drug and delivery system. This review discusses QbD concepts followed by the systematic development of NLC by the application of DoE. Process analytical technology (PAT) and six sigma concepts have also been included which can benefit in the development of optimized NLC.
Nanostructured lipid carrier (NLC) is an updated version of solid lipid (SL) nanoparticles (SLN). SLN was modified with the purpose to enhance loading capacity (LC) while decreasing time-dependent drug expulsion. This enhanced functionality of NLC was due to the incorporation of liquid lipid (LL) in the SL matrix which disorganizes SL providing more space for the drug to accommodate and remain there without expulsion [1, 2]. NLC is widely used in the administration of drugs through oral, intranasal, ocular, topical, and parenteral routes without compromise in its stability [3–7]. NLC can also enhance the bioavailability of a wide range of therapeutics [8, 9]. NLC is made of components that are generally recognized as safe by Food and Drug Administration (FDA) [9]. Furthermore, NLC also acts as a controlled and site-specific drug delivery system [8, 10, 11].
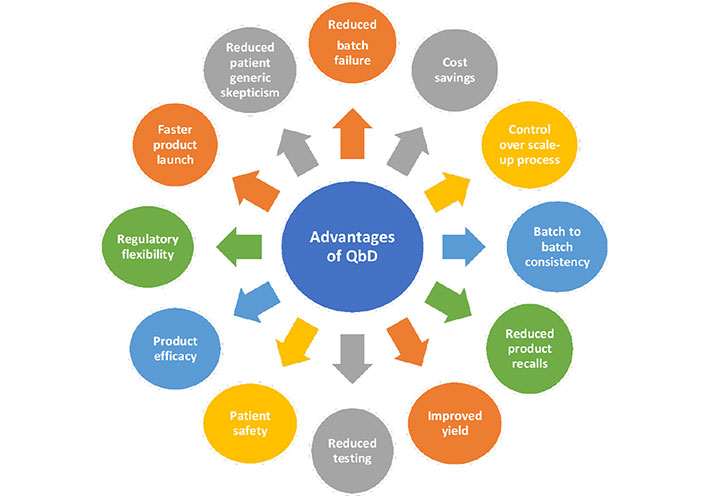
The application of quality by design (QbD) in the development of NLC has sharply increased during the last decades because of the realization that quality cannot be tested into the final product but should be built in by design [12, 13]. Conventionally, the development of pharmaceutical products and the assurance of their quality were based on controlling raw materials and processes used. If a product does not fulfill the regulatory specifications, then the pharmaceutical company has to restart the manufacturing process again to identify the cause of out of specifications. Such a procedure of testing incurred more costs to the company and also decreases the safety of the final dosage form. To avoid these limitations, the concept of QbD was adapted, which not only minimizes batch failure thus saving company costs but also ensures the quality and safety of the finished dosage form. Several benefits of QbD in the development of a pharmaceutical product is represented in Figure 1 [14, 15].
Adaptation of QbD in the development of lipid-based nanocarriers is a new approach but the term was introduced in 1992 by Juran [16]. However, Juran [16] did not use the terms drug, excipients, and medical devices in his book. Due to quality concerns in the pharmaceutical product United States FDA in 2004 integrated a quality system and risk-based approach [17]. A few years later International Conference on Harmonization (ICH) introduced the term QbD in ICH Q8 which is officially defined as a systematic approach to development that begins with predefined objectives and emphasizes product and process understanding and process control, based on sound science and quality risk management (QRM) [18]. ICH Q9 guideline is based on the risk management principle to identify and control the variables significantly affecting the quality of the product [19]. ICH Q10 gives guidance on pharmaceutical quality system and includes good manufacturing practice (GMP) regulations and complements ICH Q8 and ICH Q9 [20]. It can be said that if ICH Q8, Q9, and Q10 guidelines are implemented can deliver robust pharmaceutical products with consistent quality [21].
The application of these guidelines in pharmaceutical development is complex and time-consuming as there are so many independent variables (inputs) that can significantly affect the dependent variables (output or response). Studying the effect of each combination to understand the relationship between input and output is not easy to understand. Consequently, to explore the relationship effectively a statistical tool called the design of experiment (DoE) is utilized which is a structured approach to the development of a product within the QbD framework [22, 23].
Earlier to DoE one factor at a time (OFAT) approach was used. This method involves studying the effect on dependent variables by varying OFAT and keeping other factors constant until no significant effect of one or more variables on response is obtained. This method is complex, time-consuming, and also increases the cost to the company. Furthermore, if two or more factors are varied simultaneously then the effect of the interaction of these variables on response cannot be identified [23–25].
Integration of the concept of six sigma finds out ways to improve and modify the process, which yields nanoparticles that have no quality defect and give more customer satisfaction. This concept has not been implemented in the industry so far for the formulation of lipid-based nanoparticles. Six sigma concepts have been described briefly in a future perspective.
This review aims at the application of QbD in the development of NLC. In doing so, firstly different elements of QbD are discussed followed by the discussion of the implementation of DoE in the systematic development of NLC within the design space.
Below figure indicates various stages in product development (Figure 2). It shows how different elements of QbD are interlinked with each other in the final production of NLC within the design space. Each of the elements is further described below.
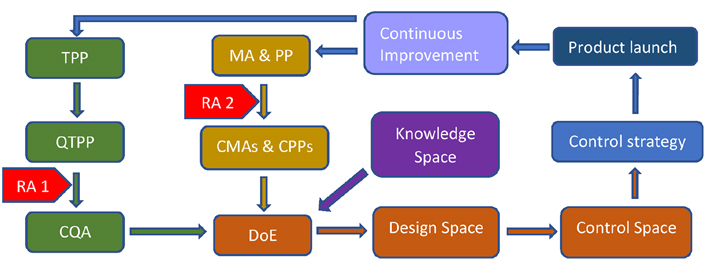
Life-cycle in the development of the pharmaceutical product by QbD implementation. From the target product profile (TPP), quality TPP (QTPP) is chosen and then risk assessment 1 (RA 1) is applied to analyze, which QTPP can be critical quality attributes (CQAs). RA 1 is nothing but just the analysis to select a particular QTPP as CQA. RA 2 refers to failure mode and effect analysis (FMEA) to select critical material attributes (CMAs) and critical process parameters (CPPs) from material attributes (MAs) and process parameters (PPs) respectively. CMAs, CPPs, and CQA are then fed into DoE software to get design space and control space. Further control of CMAs and CPPs is control strategy, which ensures batch-to-batch consistency of the product. TPP, MA, and PP should be updated if the necessity arises for further improvement of product quality
TPP is the key element that provides information to the regulatory body about the formulation development process. TPP is also called the first stage of formulation development where the formulator has to describe the fundamental characteristics of the formulation. TPP plays a key role in designing safety, efficacy, and absorption, distribution, metabolism, and elimination (ADME) studies. TPP is patient-centric and includes the mechanism by which the product works, pharmacokinetic information, indication, adverse reaction, overdosage, and storage condition. As all this information is organized in the product’s label, TPP can also be called label centric apart from patient-centric [15, 26]. There is always a scope for improvement in the quality of the formulation (continuous improvement). TPP should always be updated regularly which forms the lifecycle of formulation development as shown in Figure 2 [27]. TPP forms the basis of the QTPP as described in the next section.
QTPP is the extension of TPP and is defined as the quality characteristics a formulation should possess in order to give reproducible result as mentioned in the product label while designing TPP thereby ensuring the safety and efficacy of the formulation on patients [26, 28]. Different quality characteristics of the NLC (oral dose) are mentioned in Table 1 with justification.
QTPP of NLC
| S. No. | QTPP | Target | Justification |
|---|---|---|---|
| 1 | Dosage form | Lipid based formulation | Selection of NLC, which is lipid based enhances the oral bioavailability of lipid soluble, BCS class II drugs |
| 2 | Dosage shape | Spherical | High surface area, high rate of drug release |
| 3 | Dosage type | Controlled release | Low dosing frequency |
| 4 | Dosage strength | X (mg) | Required dose to be incorporated in formulation to provide therapeutic benefit |
| 5 | Pharmacokinetics | Cmax, AUC | High AUC and Cmax are required to achieve higher plasma drug concentration and thus higher oral bioavailability |
| 6 | Route of administration | Oral | Good patient compliance, non-invasive |
| 7 | Container and closure | Air-tight amber color bottle | To protect drug degradation from light and moisture |
| 8 | Stability | At least 12 months at room temperature | To maintain the therapeutic activity of the drug during the storage period |
AUC: area under curve; BCS: biopharmaceutical classification system; Cmax: maximum plasma concentration; S. No.: serial number
CQA can be defined as the physical, chemical, biological, and microbiological properties of the formulation that should always be within the appropriate limit or distribution to ensure the desired quality of the formulation. CQAs are also called dependent variables or responses whose values depend on independent variables or factors. CQA is derived from QTPP which has a direct impact on the safety and efficacy of the formulation [18]. QTPP which directly affects the safety and efficacy of the drug product is chosen as CQAs as illustrated in Table 2, which ultimately affects the biopharmaceutical performance of the formulation.
CQAs of NLC with their justifications
| S. No. | Quality attributes of drug product | Target | CQA | Justification | |
|---|---|---|---|---|---|
| 1 | Physical attributes | ColorOdorAppearance | Acceptable to patientNo unpleasant odorAcceptable to patient | No | Color, odor, and appearance of the formulation were not considered critical as these do not affect the safety and efficacy of the drug. |
| 2 | Assay and drug content | 100% | No | Drug content and assay variability affect the safety and efficacy of the potent drug but as the drug is well-entrapped in the formulation as a homogenous blend with SL and LL, these quality attributes are moderately critical. | |
| 3 | PS | < 100 nm | Yes | A smaller size of the formulation is essential for lymphatic uptake and higher bioavailability of the drug and is therefore considered critical. | |
| 4 | Drug entrapment | High | Yes | Higher drug entrapment is critical as less excipients are required to coat the drug thus providing less exposure of excipients to patients. | |
| 5 | Drug release | High | Yes | Immediate drug release for quick action followed by sustained release of the drug for prolonged action was considered critical. | |
| 6 | Impurities | < 0.1% | Yes | Product related or process related impurities affects the safety of the formulation. | |
The value < 0.1% was set to prevent any toxic or unexpected side effects. This value can go higher than 0.1% if justified by toxicological data. PS: particle size; Should be less than 0.1% as per ICH Q3A guideline
CMAs and CPPs are called input variables or independent variables or factors which directly affect CQAs. Both CMAs and CPPs are identified from MAs and PPs respectively through RA which has been explained in the next section. An attribute is defined as physical, chemical, biological, and microbiological properties or characteristics of input or output material. MAs include the quality and quantity of drugs and excipients, which are used to prepare formulation while PPs include all those unit operations which apply at different stages of formulation development [21]. PPs generally include instruments involved and their operating condition in manufacturing and measuring different parameters, methods employed to assess these parameters, and environment conditions [21, 26, 29]. NLC generally has the amount of the drug, LL, SL, surfactant, the ratio of surfactant to co-surfactant, and the ratio of liquid to SL as CMAs, as these affect the CQA in DoE. In section “ Analysis of response” the effect of CMA (total lipid) on CQA [entrapment efficiency (EE), EE (%)] has been discussed with reason.
QRM consists of the identification of the severity of the risk and how to avoid or control it to the acceptable level so that it does not generate a quality failure. QRM is divided into 3 steps namely RA, risk control, and risk review [19].
RA is the first step in QRM. It is further divided into risk identification, risk analysis, and risk evaluation. Risk can be assessed at two different steps as depicted in Figure 2. RA 1 is carried out to identify CQAs from QTPP while RA 2 is carried out to identify CMAs and CPPs from MAs and PPs respectively.
In order to identify whether any specific event or operation (MAs and/or PPs) is putting a risk on CQAs, the Ishikawa fishbone diagram was constructed (Figure 3). This diagram contains all the possible variables that can significantly affect CQAs. Each variable can affect CQAs to a different degree [30, 31].
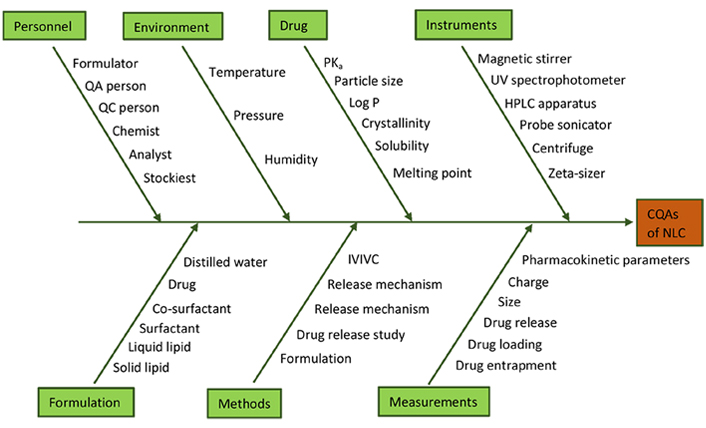
Ishikawa fish bone diagram illustrating the influence of different parameters on CQAs of NLC. HPLC: high-performance liquid chromatography; IVIVC: in vitro-in vivo correlation; Log P: partition coefficient; PKa: acid dissociation constant; QA: quality assurance; QC: quality control; UV: ultraviolet-visible
To quantify how severe a factor can impact CQAs, risk priority number (RPN; RPN = severity × occurrence × detectability) for each factor is calculated. RPN measures whether MAs and PPs are at high, low, or moderate risk for the quality of the product. FMEA was performed to prioritize the risk factors based on RPN (Table 3). FMEA refers to the mode of failure and the factors responsible for such failures while effect analysis refers to studying the effect of those failures on product performance. Here product performance is related to CQAs [29]. It can be said that FMEA identifies CQA which is mainly responsible for causing product failure. Each parameter, i.e., severity, occurrence, and detectability are assigned scores from 1 to 5 which are substituted in the equation given below to calculate the RPN. Risk factors assigned medium and high RPN were further subjected to optimization studies.
FMEA matrix to identify the criticality of failure modes on the basis of RPN scores
| S. No. | Failure modes | Severity (S) | Occurrence (O) | Detection (D) | RPN (S × O × D) | Risk |
|---|---|---|---|---|---|---|
| 1 | Stirring speed (rpm) | 4 | 3 | 2 | 24 | Medium |
| 2 | Stirring time (min) | 4 | 4 | 2 | 32 | Medium |
| 3 | SA (%) | 4 | 5 | 2 | 40 | Medium |
| 4 | ST (min) | 5 | 5 | 2 | 50 | High |
| 5 | Total lipid conc. (%) | 5 | 5 | 3 | 75 | High |
| 6 | Surfactant conc. (%) | 5 | 5 | 3 | 75 | High |
| 7 | Rate of mixing | 2 | 1 | 2 | 4 | Low |
| 8 | Temperature (°C) | 3 | 3 | 2 | 18 | Medium |
| 9 | Bead size | 2 | 2 | 1 | 4 | Low |
| 10 | Bead shape | 1 | 1 | 1 | 1 | Low |
| 11 | Beaker size | 2 | 2 | 1 | 4 | Low |
| 12 | Beaker color | 1 | 1 | 1 | 1 | Low |
conc.: concentration; rpm: rotation per minute; SA: sonication amplitude; ST: sonication time
Severity refers to how severe the impact of failure mode would be on the product quality. Severity is ranked as 5-catastrophic, 4-critical, 3-serious, 2-minor, and 1-no effect. Occurrence refers to how frequently a particular failure mode can affect product quality. Occurrence is ranked as 5-frequent, 4-probable, 3-occasional, 2-remote, and 1-unlikely. Detectability refers to the ease with which a failure mode can be detected to avoid product failure. Detectability is ranked as 5-hard to detect, 4-low or remotely detectable, 3-moderately detectable, 2-highly detectable, 1-easily detectable [30].
Once the risk is identified and evaluated it is required to be reduced and/or accepted. Risk reduction is necessary to bring the quality of the product within an acceptable range [19]. High ST (risk) decreases drug EE (CQA) of NLC [32]. This results in an increase in the volume of this formulation to be taken by the patient provided the concentration of total lipids in the formulation is kept constant. If the route of administration is ocular (30 μL) or intranasal (200 μL) where the volume of the formulation required to be kept is minimum to avoid spillage then ST can result in product failure by decreasing the dose of the drug in the same volume of the formulation [33–35]. This product failure can be avoided by keeping a minimum ST during the formulation of NLC. Another example of risk minimization is found in the study research work of Lakhani and colleagues [36] who studied that 1,2-distearoyl-sn-glycero-3-phosphoethanolamine- N-[methoxy(polyethyleneglycol)] (mPEG-2K-DSPE) is essential for drug loading (DL) of 0.1% w/v of amphotericin B (AmB) but for 0.1% w/v of AmB, mPEG-2K-DSPE decreases DL. The possibility of DL of even 0.1% w/v diminishes if mPEG-2K-DSPE is omitted from formulation so mPEG-2K-DSPE being a risk is used at minimum concentration [36]. Sometimes there is a possibility that risk cannot be minimized so it has to be accepted. Risk acceptance is always done in that case when risk is not severely harming the patients, i.e., benefit to risk ratio is high. One example is the use of drugs (CMAs) in preparing NLC. Drugs particularly anticancer have several side-effects but they cannot be either omitted or used in less concentration in the formulation as it is the main active constituent for the treatment of cancer where the benefit to risk ratio is high.
This is the final step of QRM where risks are reviewed or monitored which is based on prior experience and knowledge. Identification of CQAs (from QTPP) and recognition of CMAs and CPPs from MAs and PPs respectively requires prior knowledge and experience. Here prior knowledge refers to the formulation of NLC. Once the ingredients are selected, the formulation is prepared to further identify which excipient and process significantly impact the development of NLC. Various RA tools like the Ishikawa fish bone diagram, FMEA, and Pareto analysis are used for this purpose [37].
DoE to optimize NLC has been discussed under the separate heading “DoE in the optimization of NLC”. Through knowledge space, design space is created which is further controlled to give control space (as illustrated in Figure 4) which is a part of continuous improvement after the product is launched in the market [38, 39].
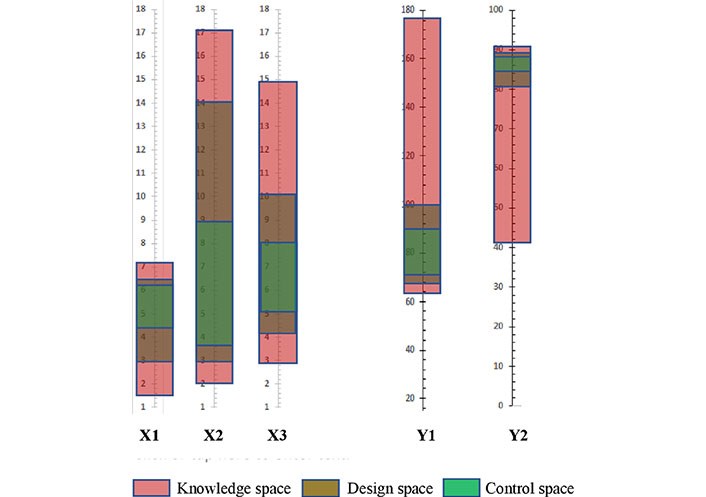
Knowledge space, design space, and control space between input factors (CMAs and CPPs) and CQAs represented on the hypothetical scale. X1: surfactant (%); X2: ST (min); X3: total Lipid (%); Y1: size (nm); Y2: EE (%)
This is the region of operability during the lab scale product development (Figure 4). After the identification of CMAs and CPPs through screening design, their highest and lowest value is selected. This selection is based upon prior knowledge and experience in formulating NLC where the range of each ingredient and process used is taken into account to develop a stable formulation. This range is called input factors and is used to analyze its relationship with CQAs within the experimental design [39].
The relationship between input (CMAs and CPPs) and output (CQAs) can be analyzed by design space. Design space can be obtained by the analysis of experimental design. Design space can be of two types. First, if the relationship is analyzed between CMAs and CQAs then this is called product design space and if the relationship is analyzed between CPPs and CQAs then this is called process design space. Within the design space, any change in CMAs and CPPs is permissible independent of the change in the value of CQAs. But if any change is happening outside this design space, then this will impose regulatory restrictions on the formulation and the formulator has to take regulatory approval again for product launch [27].
From design space, control space is proposed where the range of CMAs and CPPs is further narrowed for future product development. The area of control space within the design space is far from the edge of failure. The purpose of the refinement of CMAs and CPPs is to have further control over CQAs. This is the company’s call to operate in the region of control space as it is not important for regulatory approval [21, 22].
Through control space future operating range is set and to assure that product development stays within this operating range, the control strategy is implemented. The control strategy ensures continuous improvement throughout the life cycle of the pharmaceutical product. To achieve consistent quality in the final product (batch-to-batch consistency by continuous control over CQAs) control strategy at a minimum should include control over the inputs (CMAs and CPPs). The proposed ranges of these inputs decide the future commercial manufacturing of the pharmaceutical product [14, 40]. Process analytical technology (PAT) is used to measure CQAs during manufacturing also called real time control over manufacturing or in-process control. PAT can maintain the process within the established design space [14].
PAT monitors the development of the pharmaceutical product by identifying the cause of deviation in the manufacturing process thus preventing batch failure and increasing production efficiency. PAT keeps a check on risk-causing elements, i.e., CMAs and CPPs and thus helps in anticipating that CQAs are within the earlier specified design space [14]. PAT not only helps in running a process within a specified design space but also broadens the design space [41]. Some broadly used PAT tools are UV-visible spectroscopy, Raman spectroscopy, infrared spectroscopy, two dimension (2D) fluorescence spectroscopy, mass spectroscopy, and nanoparticle tracking analysis (NTA) [42, 43].
PAT has been explored in the development of the nanoparticulate system. An example is a real time, inline measurement of the size and size distribution of turbid nanosuspension under stirring by a PAT tool called NanoFlowSizer. This technology unlike the zetasizer employs a non-invasive method for sample preparation and works on the principle of fourier domain low-coherence interferometry. Samples whether static or flowing, diluted or concentrated can be analyzed thus providing an in-process control over the size and size distribution of nanosuspensions [44].
In another study, it has been shown that using ultrasonic resonator technology size of oil droplets and physical properties of surfactant: co-surfactant (Smix) self-nano-emulsified drug delivery systems (SNEDDs) can be evaluated without dilution thus preventing loss of structural integrity of SNEDDs. This technology thus acts as a prediction model at the early stage of formulation development and thus provides in-process control [45].
Ahmed and their co-worker [46] demonstrated the role of near-infrared (NIR) spectroscopy as an offline tool for the quantification of a drug (glimepiride) in the lyophilized liposome. They showed that NIR acts as a non-destructive tool (as no sample preparation is required) in the real-time analysis of drugs in liposomes [46].
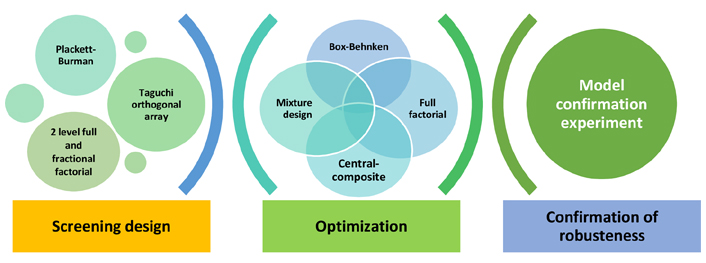
DoE is a systemic approach to the development of the pharmaceutical product. DoE determines the relationship between input variables, Xi (factors), and outputs, Y (responses) as Y = f(Xi). With fewer experiments, one can find out how changes in factors affect the response [47]. DoE is broadly divided into screening design and response surface design also called optimization design as shown in Figure 5. DoE in optimization experiments generally consists of a selection of appropriate design or design combinations, measurement of response, analysis of response, development of design space, and finally confirmation of design space with at least 3 checkpoint batches.
For a large number of factors (factors > 4), one can opt for a screening design before applying an optimization design. However, the screening design can be skipped if the number of factors is less than 4.
Risk estimation can be done by either of the most widely used technique in nanoformulation, i.e., FMEA on the basis of RPN scores or screening design.
Out of different screening designs, the Plackett-Burman design (PBD) is the most widely used for screening risk factors for responses of NLC due to the robustness of this design [48]. PBD is a 2-level factorial design that allows the studying of N number of experiments with N-1 factors. Analysis of Pareto charts (Figure 6) as obtained by running PBD allows picking the most significant factors (ST, concentration of total lipid and surfactant) affecting response (size) while eliminating non-significant factors (stirring speed, stirring time, temperature, and SA) which unnecessarily increases the number of experimental runs. Another example is found in the work of Negi and colleagues [49], where 11 input factors were selected for the optimization of NLC in PBD but just 4 significant factors affecting response were screened and further used for the optimization experiment. PBD is only suitable for factor screening and cannot be used for optimization experiments to find out design space as PBD does not give information on multiple levels of each factor and interaction between factors which also significantly affects responses [32].
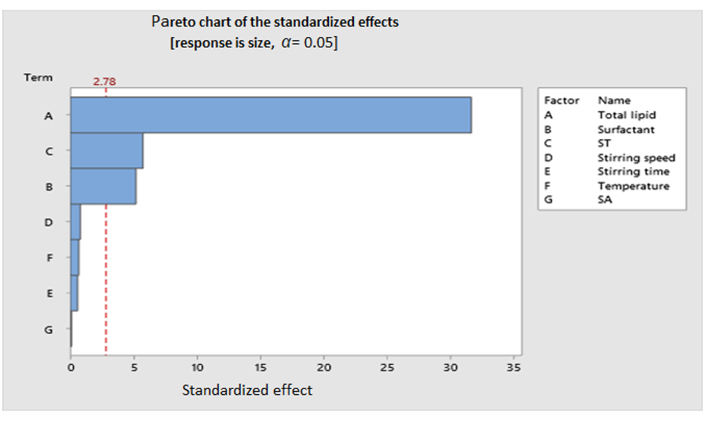
Pareto chart representing the effect of different factors (CMAs and CPPs) on the response (CQAs). Bars crossing the reference line are statistically significant. Bars that represent factors A, B, and C cross the reference line that is at 2.78 (reference line 2.78 was generated by the software Minitab). These factors are statistically significant at the 0.05 level with the current model terms. Factor A is representing the highest effect followed by C and B
One of the most powerful design to analyze the effect of interaction between input factors on the response is 2-level full factorial design. However, a large number of experiments are required to be performed as compared to other screening designs to screen out significant factors as this design is based on the 2k model. K represents the number of factors at 2 levels. For 11 input factors, one has to perform 2,048 experiments, unlike PBD which required just 11 experiments to select significant factors [47, 48].
Fractional factorial design (FFD) can also evaluate several factors with a lesser number of experiments like PPD. This is possible if 2-level full factorial design, 2k is fractionated into 2k – p where p refers to the fraction of FFD, p = 1 for half FFD and p = 2 for quarter FFD. For example, for 6 factors, the number of experiments for 2-level quarter FFD is 26 – 2 = 16 while full factorial design would have given us 26 = 64 experiments. The limitation of FFD is similar to PBD, i.e., interaction terms between factors are not involved thus giving rise to aliased factors [47]. Cacicedo and coworkers [50] studied the effect of multiple factors on responses: size, polydispersity index (PDI), and zeta potential (ZP). Screened factors were further used in central composite design (CCD) for further optimization of NLC [50].
Taguchi orthogonal array (TOA) is an FFD and is represented as Lk – p where L, k, and p refer to level, number of factors, and fraction of FFD respectively. For example, for 3 factors and 3 level, L9 TOA give 3k – p = 33 – 1 = 9 experiments to perform. One limitation associated with TOA is that it does not involve the interaction of factors just like PBD and FFD [51]. However, TOA has been used as the main optimization design for NLC in some research publications [49, 52].
Box-Behnken design (BBD) and CCD are the most commonly used design for the optimization of NLC followed by 3-level full factorial design. Mixture design has also been used in some instances. Studies from the previous three years on formulation optimization of NLC using different experimental designs are represented in Table 4. All these designs are based on a response surface where 3 levels of each factor are used to get a quadratic response surface [47, 53].
Summary of optimization results by the application of QbD on NLC
| Experimental design | Drug | CMAs | CPPs | CQA | Results | Reference |
|---|---|---|---|---|---|---|
| 4 Factors 3 levels BBD | AmB | mPEG-2K-DSPE, AmB, castor oil | Number of cycles in HPH | PS, PDI, EE, DL |
| [36] |
| 3 Factors 3 levels BBD | calcipotriol | LL:TL, SC:CSC, calcipotriol | - | PS, EE |
| [54] |
| 5 Factors 3 levels BBD + 2 factors 3 levels CCD | Clarithromycin | Lipids, tween 20, PEG 6,000 | ST, SA | PS, PDI, ZP, DL, EE |
| [55] |
| PBD + 3 factors 3 levels BBD | Ibuprofen | Type of surfactant (P188 and HS15), concentration of surfactant, lipid concentration | Homogenization speed, homogenization time, ultrasonication frequency, ultrasonication time | PS, PDI, ZP, EE |
| [56] |
| Resolution V fractional factorial + 3 factors 3 levels CCD | Metvan | Total lipid, LL, surfactant | ST, SA | PS, PDI, ZP |
| [50] |
| PBD + 3 factors 3 levels CCD | Ibrutinib | LL, drug, surfactant, organic to aqueous ratio | Stirring speed, ST | PS, PDI, EE |
| [57] |
| 23 Full factorial design + CCD | Zidovudine | Tween 80, SL | ST | PS, PDI, DL |
| [58] |
| 3 Factors 3 levels CCD | Efavirenz | Lipid, surfactant | HPH pressure | PS, PDI, EE |
| [59] |
| 3 Factors 3 levels CCD | Exemestane | SL, surfactant | ST | PS, PDI, EE |
| [60] |
| 23 Full factorial design | Dexamethasone | Lipid, drug, surfactant | - | PS, ZP, EE |
| [61] |
| 23 Full factorial design | Pterodon pubescens fruit oil | Types of SL, PC, TAS | - | PS, PDI, ZP, TC, EE |
| [62] |
| 23 Full factorial design | Zolmitriptan | SL, LL, chitosan | - | PS, PDI, EE, % yield |
| [63] |
| 3 Factors 4 levels Taguchi design (L9) | Ergosterol | LL:TL, drug:TL, surfactant, co-surfactant | - | EE |
| [52] |
| 5 Factors 2 levels D-optimal mixture design | Hydroxymethyl-nitrofurazone | Gelucire® 50/13, Precirol® ATO 5, Miglyol® 840, P188, water | - | PS |
| [64] |
D-optimal: determinant-optimal; HPH: high-pressure homogenizer; HS15: hydroxy stearate 15; LL:TL: ratio of LL to total lipids; mV: millivolt; P188: Poloxamer® 188; P80H: phospholipon 80H; PC: P80H concentration; PEG: polyethylene glycol; SC:CSC: ratio of surfactant concentration to cosurfactant concentration; TAS: types of aqueous surfactant; TC: total content of vouacapans; TSL: type of SLs; -: not applicable; +ve: positive; –ve: negative
To optimize NLC 2 to 3 factors at 3 levels are often used. The number of experiments is calculated from Xk where X and k refer to the number of level and number of factors respectively. So, for 3 level 3 factors we have to perform 33 = 27 experiments [47].
CCD is the most widely used design for optimization. Unlike BBD and full factorial, CCD operates at 5 level for selected 3 level 3 factor experiment. Two levels are –1 and +1 which is factorial design points (Fp), and another 2 levels are –α and +α which is axial points (Ap) and last level are 0 due to center points (Cp). –1, 0, +1 is common to all three response surface design. The value of Ap α is ± 1.682 for rotatable CCD. Number of experiments required for 3 factor 3 level (including two more levels due to Ap) is 2k + 2k +Cp = 23 + 2 × 3 + 6 = 20 where Cp is 6 replicas [53].
3 factor 3 level BBD gives 15 experiments, unlike full factorial design and CCD which requires 27 and 20 experiments respectively. Thus, BBD is economical to perform. This design is also efficient for CCD if we know our safe operating zone. Ap lying outside the cube in CCD are considered outside the knowledge space which is set through lab experiments and is not required to be included as a factor in the experiment [65]. The number of experiments for 3 factor 3 level is 2k (k – 1) + Cp = 2 × 3 (3 – 1) + 3 = 15 [53].
Mixture design is broadly classified as simplex-lattice designs, simplex-centroid designs, and optimal designs. Optimal designs are further categorized as (average) A-optimal, D-optimal, and (integrated) I-optimal [66]. D-optimal is the most commonly used design in optimizing NLC. In mixture design sum of all the components or factors should be equal to 100% or 1 [23]. Suppose, there are 3 components or factors to prepare NLC, i.e., SL, LL, and Smix with lower and upper ranges as 0.3–0.8, 0.2–0.4, and 0.2–0.4 respectively. The upper range of solid liquid is automatically adjusted to 0.6 to make room for the other two components each with a value 0.2. Therefore, the components will always be under constraint to adjust the sum equal to one. Thus, these components are called dependent factors unlike other optimization designs.
Significant model and model terms are suggested through analysis of variance (ANOVA). When a model is not significant Box-Cox transformation can provide recommended transformation. Generally, insignificant model terms (P > 0.05) should be removed to improve the model. Lack of fit should always be non-significant [67].
A typical example demonstrating the effect of factors on EE (%) is shown in Figure 7. The factorial plot (Figure 7A) portrays the effect of an individual factor on EE (%). As the concentration of total lipid increases till the intermediate level size increases but after this size decreases. As the homogenization pressure of HPH increases EE (%) decreases due to a negative slope. The same trend is seen with the increase in the number of homogenization cycles but as the slope is less negative the decrease in EE (%) is not that high. The normal plot (Figure 7B) represents factors in red and blue showing the significant and non-significant effects of factors on EE (%) respectively. Factors in red towards the right and the left represents the positive and negative effect on EE (%) respectively. The contour plot (Figure 7C) portrays color coded region. Each colored region indicates how two factors interact to give different values of EE (%) in 2D. Three different regions inside the contour plot have been labeled to show how the interaction between factors changes the value of EE (%). The 3D surface plot (Figure 7D) clearly portrays the effect of factors on response EE (%).
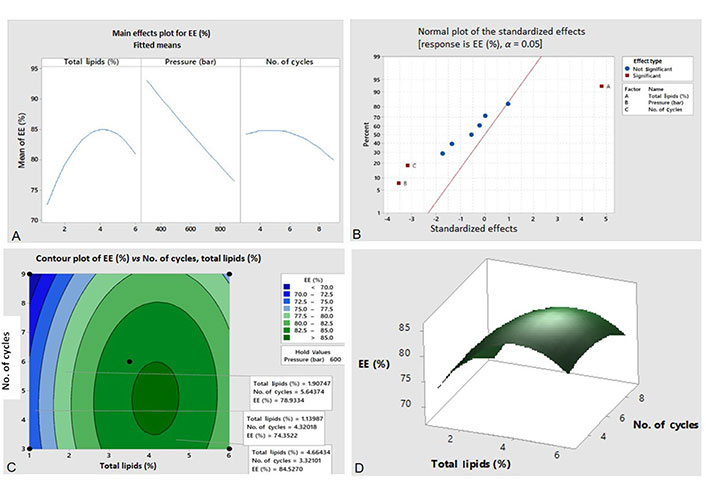
Graphical analysis of EE (%) through (A) factorial plot, (B) normal plot, (C) contour plot, and (D) 3D surface plot
The optimized formulation can be obtained by desirability function and design space by employing numerical optimization and graphical optimization respectively [68].
In numerical optimization, multiple responses are optimized by composite desirability or desirability function. In simple terms, the individual desirability of each response (also called goal) is set and then these individual responses are combined into one called composite desirability [53]. A goal can either be maximizing, minimizing, or targeting responses. In the case of NLC, generally, response like size is minimized while EE (%), LC and percentage in vitro release is maximized [35, 69]. We can also change the value of each factor in numerical optimization. A typical example of numerical optimization of NLC is represented in Table 5 where responses were put under constrain by setting their goals but factors were under no constrain. In numerical optimization, our aim should not be to get composite desirability equal to 1 but to find a set of factors to meet the desired goal as composite desirability depends upon upper and lower limits at which responses or goal is set [53].
Numerical optimization by setting the goal of each response
| Response | Goal | Total lipids (%) | Pressure (bar) | No. of cycles | EE (%) | Drug release (%) | Size (nm) | Composite desirability |
|---|---|---|---|---|---|---|---|---|
| EE (%) | Maximum | 2.86869 | 463.636 | 6 | 86.6053 | 81.3127 | 81.5919 | 0.857581 |
| Drug release (%) | Maximum | |||||||
| Size (nm) | Minimum |
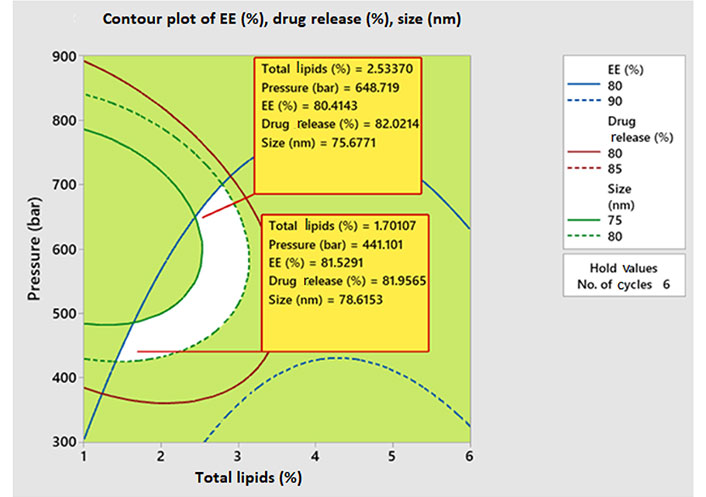
Design space in white color is represented in Figure 8 where critical factors, i.e., total lipid (%) and homogenization pressure (bar) are interacting to give the responses like EE (%), drug release (%), and size (nm) with predefined specifications. The green color region is called knowledge space which is constrained to get design space. Putting further constrain on responses (narrowing down responses) gives control space that lies within the design space.
Confirmation of the model for its robustness is done by performing three to five confirmatory experiments [70]. If the model-predicted response is closer to as obtained by experimental observation (analyzed by R2 value which should be closer to 1) then it confirms the accuracy of the model [71]. This verification can be achieved by selecting three to five formulations from the design space and then using that combination of factors to formulate the product. If responses observed for the product are closer to as predicted inside the design space, then this confirms the robustness of the model.
NLC is a widely researched delivery system because of its ability to deliver a wide range of agents like proteins, peptides, hydrophilic, and hydrophobic drugs either through intranasal, oral, ocular, or transdermal routes. NLC is commercially available as a cream and viscous solution at present and there are several patents with different applications. Some researchers have shown the active targeting potential of NLC by surface modification but development in this field is still in its infancy for organ, cellular, and intracellular targeting.
QbD is becoming a widely used technique for formulation optimization inclusive RA across the industry. Implementing define, measure, analyze, improve and control (DMAIC) with six sigma viewpoints in QbD can benefit the commercial production of pharmaceutical products with less likely rejection. The concept of six sigma gives high quality product as there are just 3.4 products per million of the final products that does not meet quality. Six sigma enables production to be 99.9997% perfect [72]. Through the defined approach we identify QTPP, CMAs, CPPs, and CQAs of NLC through risk analysis as given in Tables 1 and 2 respectively. Screening design also helps in identifying CMAs and CPPs. Then the response is measured, which is CQAs, by a using suitable DoE. With the help of statistical process control (SPC), the source of variation and make an attempt to eliminate it. These graphs like control charts give an idea that which experimental run is the source of variation for CQA and then can be controlled further. An alternative to SPC is the use of the ANOVA table as obtained by DoE software where we get an F-ratio. F-ratio automatically gives an idea of whether a model is significant or not. The next step is the analysis of the relationship between factors and responses through model graphs like 3D plots, contour plots, normal plots, factorial plots, etc., as represented in Figure 7. The fourth step is the improvement stage where quality is achieved by DoE and PAT as described in earlier sections. Inside the design space, any change in the factors is permissible as long as CQAs are not lying outside the design space. Here products can be launched into the market. The last step is to have control mainly on quality by continuous improvement in the process. The ranges of the factors are further controlled in order to improve the quality of the products that are already on the market. This control leads to the generation of control space which is not the regulatory requirement as that of working under design space but product quality is beyond the failure range.
Adaptation of QbD in optimizing NLC starts with screening several factors to identify key variables affecting quality characteristics which are further used in optimization experiments to give the best combination of factors to achieve the desired goal. With such advancement, there is still scope for improvement. First, the application of QbD in surface modified NLC with biomarkers, ligands, antibodies, etc. remains to be investigated. Second, the employment of PAT in the production of NLC has not been considered yet which is essential in analyzing and controlling any deviation in critical quality during production itself. QbD is a systematic approach that can be employed in the commercial production of NLC delivering consistent quality without any compromise on safety and efficacy.
2D: two dimension
AmB: amphotericin B
Ap: axial points
BBD: Box-Behnken design
CCD: central composite design
CMAs: critical material attributes
Cp: center points
CPPs: critical process parameters
CQAs: critical quality attributes
DoE: design of experiment
D-optimal: determinant-optimal
EE: entrapment efficiency
FFD: fractional factorial design
FMEA: failure mode and effect analysis
ICH: International Conference on Harmonization
LL: liquid lipid
MAs: material attributes
mPEG-2K-DSPE: 1,2-distearoyl-sn-glycero-3-phosphoethanolamine-N-[methoxy(polyethyleneglycol)]
NLC: nanostructured lipid carrier
PAT: process analytical technology
PBD: Plackett-Burman design
PPs: process parameters
QbD: quality by design
QRM: quality risk management
QTPP: quality target product profile
RA: risk assessment
RPN: risk priority number
SL: solid lipid
ST: sonication time
TOA: Taguchi orthogonal array
TPP: target product profile
The author contributed solely to the work.
The author declares that he has no conflicts of interest.
Not applicable.
Not applicable.
Not applicable.
Not applicable.
Not applicable.
© The Author(s) 2022.
Copyright: © The Author(s) 2022. This is an Open Access article licensed under a Creative Commons Attribution 4.0 International License (https://creativecommons.org/licenses/by/4.0/), which permits unrestricted use, sharing, adaptation, distribution and reproduction in any medium or format, for any purpose, even commercially, as long as you give appropriate credit to the original author(s) and the source, provide a link to the Creative Commons license, and indicate if changes were made.

Neha Minocha ... Parijat Pandey
Monu Yadav ... Anil Kumar
Sangeet Kumar Mall ... Md Sabir Alam
Rouchan Ali ... Pooja A. Chawla
Rosy Yesela Mancilla Santa Cruz ... María Segunda Aurora Prado
Abhishek Chaurasiya ... Pooja A. Chawla
Dilpreet Singh ... Pooja A. Chawla
Shikha Choudhary ... Md Sabir Alam