 Original Article

Affiliation:
1Facultad de Ciencias de la Alimentación – UNER, Concordia 3200, Entre Ríos, Argentina
Email: lucas.benitez@uner.edu.ar
ORCID: https://orcid.org/0000-0003-2748-7341
Affiliation:
1Facultad de Ciencias de la Alimentación – UNER, Concordia 3200, Entre Ríos, Argentina
2Instituto de Ciencia y Tecnología de Alimentos de Entre Ríos (CONICET-UNER), Concordia 3200, Entre Ríos, Argentina
3Consejo Nacional de Investigaciones Científicas y Técnicas (CONICET), Ciudad de Buenos Aires C1425FQB, Argentina
ORCID: https://orcid.org/0000-0002-8066-6595
Affiliation:
1Facultad de Ciencias de la Alimentación – UNER, Concordia 3200, Entre Ríos, Argentina
ORCID: https://orcid.org/0009-0009-9153-6284
Affiliation:
1Facultad de Ciencias de la Alimentación – UNER, Concordia 3200, Entre Ríos, Argentina
2Instituto de Ciencia y Tecnología de Alimentos de Entre Ríos (CONICET-UNER), Concordia 3200, Entre Ríos, Argentina
3Consejo Nacional de Investigaciones Científicas y Técnicas (CONICET), Ciudad de Buenos Aires C1425FQB, Argentina
ORCID: https://orcid.org/0000-0001-7007-7001
Affiliation:
1Facultad de Ciencias de la Alimentación – UNER, Concordia 3200, Entre Ríos, Argentina
2Instituto de Ciencia y Tecnología de Alimentos de Entre Ríos (CONICET-UNER), Concordia 3200, Entre Ríos, Argentina
3Consejo Nacional de Investigaciones Científicas y Técnicas (CONICET), Ciudad de Buenos Aires C1425FQB, Argentina
ORCID: https://orcid.org/0000-0001-8013-9595
Affiliation:
1Facultad de Ciencias de la Alimentación – UNER, Concordia 3200, Entre Ríos, Argentina
2Instituto de Ciencia y Tecnología de Alimentos de Entre Ríos (CONICET-UNER), Concordia 3200, Entre Ríos, Argentina
3Consejo Nacional de Investigaciones Científicas y Técnicas (CONICET), Ciudad de Buenos Aires C1425FQB, Argentina
ORCID: https://orcid.org/0000-0003-2358-1365
Affiliation:
4Research group in Innovative Technologies for Sustainable Food (ALISOST), Department of Preventive Medicine and Public Health, Food Science, Toxicology and Forensic Medicine, Faculty of Pharmacy, Universitat de València, Burjassot 46100, Valencia, Spain
Email: lucas.benitez@uner.edu.ar
ORCID: https://orcid.org/0000-0002-3659-3640
Explor Foods Foodomics. 2024;2:67–82 DOI: https://doi.org/10.37349/eff.2024.00026
Received: December 09, 2023 Accepted: January 18, 2024 Published: February 27, 2024
Academic Editor: Andrea Gomez-Zavaglia, Center for Research and Development in Food Cryotechnology (CIDCA-CONICET), Argentina
The article belongs to the special issue Delivery of Hydrophobic Compounds in Food Systems
Aim: This work aimed to develop rice bran oil-in-water (O/W) emulsions, stabilized with different mixtures of pea protein concentrate (PPC), Arabic gum (AG), and maltodextrin (MD), as the basis for the formulation of plant-based food products.
Methods: The effects of the aqueous phase formulation on the properties of the resulting O/W emulsions were evaluated by a mixture design approach. Volume-weighted mean diameter (D[4,3]) of the emulsion particles and polydispersity expressed as the difference of D[4,3] – D[3,2], apparent viscosity at a shear rate of 200 s–1 and backscattering at different times associated to the global stability of the emulsions were studied as response variables. A multi-response optimization was carried out and mathematical models were validated.
Results: The ternary mixtures of the aqueous phase showed significant antagonism between the three components in all the response variables. The optimal formulation of the aqueous phase for the O/W emulsions obtained after three homogenization cycles was 78% PPC and 22% MD. The properties of the O/W optimal emulsion were according to the ones predicted by the model.
Conclusions: The best-formulated emulsion is promising for developing plant-based foods and beverages.
In recent years, consumers have been interested in reducing their intake of foods of animal origin, for ethical, environmental, and health reasons [1]. There is evidence that the production of animal-derived products is a major contributor to global warming and biodiversity loss, due to the generation of greenhouse gases and the inefficient use of land and water [2, 3]. Growing consumer interest and product innovation have made the plant-based food market one of the fastest-growing sectors of the modern food industry [4]. These aspects generate an incentive in the food industry for the development of new products with ingredients of vegetable origin. In this context, opportunities arise for the revalorization of agro-industrial products and by-products to use them as ingredients in plant-based drinkable foods. Particularly, functional plant-based beverages have become a trend among conscientious consumers, due to perceived health benefits such as cardiovascular, cancer prevention, digestive tract health, immune protection, weight management, bone structure, improvement of athletic endurance, energy, hydration, etc. [5].
Microemulsification is used to design innovative food ingredients and products [6], for example, encapsulated nutrients, nutraceuticals, colors, flavors, and preservatives with better water dispersibility, resistance to chemical degradation, improved bioavailability and controlled delivery [7]. The development and application of this advanced technology is leading to new approaches for improving food quality and functionality, as well as transforming the way that food can be produced and consumed [8].
Rice bran oil (RBO), a byproduct of the rice milling process, is mainly composed of unsaturated fatty acids and, to a lesser extent, saturated fatty acids (linoleic to oleic acids ratio in RBO is approximately 1:1.1) [9]. RBO is rich in various dietary trace components such as vitamin E (α-tocopherol and tocotrienols), squalene, phytosterols, and polyphenols that impart the high bioactivity of RBO [10–12]. Numerous research findings have highlighted the notable antioxidant and anti-inflammatory qualities of RBO, affirming its potential in addressing conditions like hypertension, diabetes, obesity, and potentially preventing cancer [13, 14]. A key component believed to contribute to these health benefits is γ-oryzanol, which is an antioxidant blend consisting of ferulic acid esters of phytosterols [15]. RBO has great potential in the market of the biomass valorization [11] and is recommended by the World Health Organization as one of the top three high-value vegetable oils [16].
Over the past few years, plant-derived proteins have gained prime importance due to their higher ethical profile, increasing concern from animal welfare organizations for meat proteins, and increased exposure to animal-based protein greenhouse emissions [17]. Pea protein concentrate (PPC) consists mainly of globulin proteins, legumin and vicilin, and the minor protein components convicilin and lipoxygenase (LOX) [18]. PPC has been used in the formulation of foam and oil-in-water (O/W) emulsions due to its high content of proteins and excellent emulsifying properties [19]. It is also considered a high-quality protein and a functional ingredient due to its low allergenicity, high protein content, availability, affordability, and derivation from a sustainable crop [17]. Arabic gum (AG), a water-soluble dietary fiber obtained as exudates of Acacia Senegal and Acacia seyal trees, is used in the food industry due to its aqueous dispersions properties, low viscosity, and good emulsifying characteristics attributed to its residual protein content [20, 21]. Maltodextrins (MDs) are mixtures of polymers that consist of D-glucose units obtained by partial (acidic or enzymatic) hydrolysis of starch. MD is commonly used in the food industry due to its low cost, good digestibility, non-sweet, high solubility in water, and low viscosity in aqueous dispersions [22]. However, their poor emulsifying properties are their main drawback [23].
This research aimed to develop RBO emulsions stabilized with mixtures of PPC, AG, and MD, as the basis of food products able to be included in plant-based foods and beverages. The effect of the aqueous phase formulation on the properties of the resulting O/W emulsions was evaluated by a mixture design approach. In addition, a multi-response optimization was carried out to obtain the best-performing emulsion and mathematical models were validated.
RBO (Saman S.A., Uruguay), previously characterized by Benitez et al. [9], was used as a lipid phase. PPC (SolaeTM, TruProTM 2000, Dupont Nutrition and Health) had a protein, fat, ash, moisture and carbohydrate content, according to the label, of 80.6% (w/w), 9.0% (w/w), 4.9% (w/w), 4.5% (w/w), and less than 1% (w/w) respectively. AG (TICAmulsion A-2010, TIC GUMS, Argentina) had a protein, fat, ash, moisture and carbohydrate content, according to the label, of 0.8% (w/w), 2.8% (w/w), 7.7% (w/w), 7.3% (w/w), and 81.2% (w/w), respectively. Finally, MD (Farmal DE-15, Ingredion, Argentina) had a carbohydrate, moisture and ash content according to the label of 94.0% (w/w), 6.0% (w/w) and 0.05% (w/w), respectively. PPC, AG and MD were used as emulsifying and/or stabilizing agents. All the other reagents used were analytical grade.
O/W emulsions were composed of 75.0% (w/w) aqueous dispersions and 25.0% (w/w) RBO [oil mass fraction (Φm) = 0.25]. These aqueous dispersions were composed of different mixtures of PPC, AG, and MD to reach a fixed 6.0% (w/w).
The three independent variables in the mixture design were the concentration of PPC (X1), MD (X2), and AG (X3). The resulting augmented {3,3} simplex lattice design calculated with the Minitab Statistical Software (Minitab version 17, USA) resulted in thirteen runs and two replications of the central point (Figure 1).
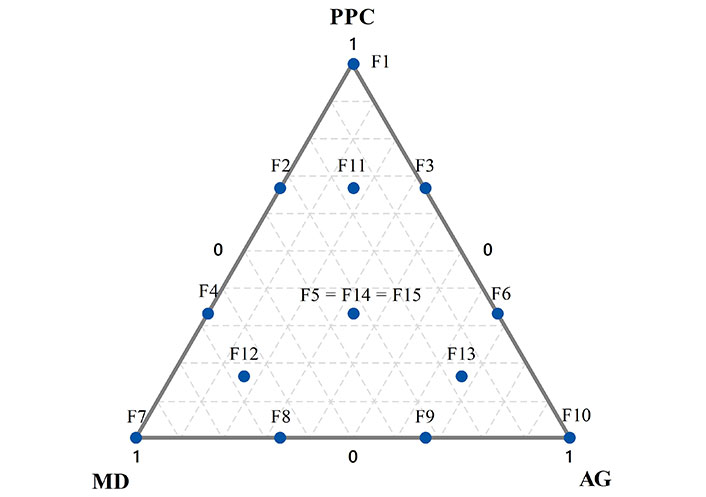
Distribution of experimental points of the augmented {3,3} simplex-lattice design for three components—PPC (X1), MD (X2), and AG (X3)—used in this study. Fifteen formulations (PPC, MD, and/or AG mixtures) were used as aqueous phases of rice bran O/W emulsions
All tested formulations are shown in Table 1. Before emulsification, PPC, MD, and AG were hydrated with distilled water keeping the aqueous dispersions in magnetic stirring at 1,180 rpm (Wisd, MSH-20D, Germany) for 30 min at room temperature. Then, the amount of RBO needed for each formulation was added. Coarse emulsions were prepared with a high-speed blender UltraTurrax T18 using an S18N-19G dispersing tool (Janke & Kunkel GmbH, Germany) at 18,000 rpm for 90 s. To obtain fine emulsions, coarse emulsions were homogenized with a two-valve high-pressure homogenizer (Panda 2000, GEA Niro Soavi, Italy) at 15 MPa and with three cycles of homogenization. The obtained fine emulsions were stored at refrigeration temperature (4°C) and protected from light. Antimicrobial agents were not added in this study. Three individually prepared replicates were assayed for each condition.
Codified and actual PPC, MD, and AG values, according to the augmented {3,3} simplex-lattice design used in this study. The resulting mixtures (PPC, MD, and/or AG) were used as aqueous phases in the formulation of the rice bran O/W emulsions
| Formulation* | Codified values | |||
|---|---|---|---|---|
| PPC (X1) | MD (X2) | AG (X3) | Total | |
| F1 | 1.00 | 0.00 | 0.00 | 1.00 |
| F2 | 0.67 | 0.33 | 0.00 | 1.00 |
| F3 | 0.67 | 0.00 | 0.33 | 1.00 |
| F4 | 0.33 | 0.67 | 0.00 | 1.00 |
| F5 | 0.33 | 0.33 | 0.33 | 1.00 |
| F6 | 0.33 | 0.00 | 0.67 | 1.00 |
| F7 | 0.00 | 1.00 | 0.00 | 1.00 |
| F8 | 0.00 | 0.67 | 0.33 | 1.00 |
| F9 | 0.00 | 0.33 | 0.67 | 1.00 |
| F10 | 0.00 | 0.00 | 1.00 | 1.00 |
| F11 | 0.67 | 0.17 | 0.17 | 1.00 |
| F12 | 0.17 | 0.67 | 0.17 | 1.00 |
| F13 | 0.17 | 0.17 | 0.67 | 1.00 |
| F14 | 0.33 | 0.33 | 0.33 | 1.00 |
| F15 | 0.33 | 0.33 | 0.33 | 1.00 |
* Formulation numbers correspond to Figure 1
The particle size distributions were measured by static light scattering (SLS) using a particle size analyzer (Malvern Mastersizer 2000E, Malvern Instruments Ltd., Worcestershire, UK) in a range of 0.1–2,000 µm, according to Benitez et al. [9]. The refractive indexes of the dispersed and continuous phases were 1.40 and 1.33, respectively [24]. The parameters volume-weighted mean diameter (D[4,3]) and surface-weighted mean diameter (D[3,2]) match in monodisperse emulsions, but are notably different in polydisperse systems [25], the arithmetic difference between both (D[4,3] – D[3,2]) was also calculated [26]. The particle size distribution was measured immediately after the preparation of emulsions and after 24 h of refrigerated storage. Measurements were carried out in triplicate at room temperature.
Rotational rheological tests were carried out on a rheometer (Discovery HR-1, TA Instrument Inc., USA) using a concentric cylinder sensor system with a 5,923,44 μm gap between the cylinders. The samples were subjected to a logarithmic increasing shear rate with a continuous ramp from 1 s−1 to 500 s−1 in 120 s. Since all the emulsions fall in the Newtonian region, the flow behavior was described by fitting the experimentally measured data to the Ostwald de Waele model [27]. All measurements were performed in triplicate at constant temperature (20°C ± 0.5°C).
The stability of the emulsions was determined using backscattering light with a vertical scan analyzer (Turbiscan Formulation, France) according to Benitez et al. [9]. At each time (0 h and 24 h), the average values of backscattering percentage (%BS) were obtained in the lower (10–15 mm) and upper (45–50 mm) zones of the tube of each emulsion tested (BS0 h, BS24 h bottom, BS24 h top) to determine their stability. The cells with the emulsions were stored at 4°C for 24 h. Determinations were conducted in triplicate.
Results corresponding to the particle size distribution, rheological behavior and global stability were fitted using Scheffe’s canonical special cubic model for mixtures of three components (Equation 1), using the multiple-step regression analysis described by Cornell [28]. Equation 1:
Where: Y is the predicted response (in this study: D[4,3] – D[3,2], BS0 h, BS24 h bottom, BS24 h top, BS72 h bottom, BS72 h top and apparent viscosity at 200 s–1), Xi is the proportion of each component (X1 = PPC, X2 = MD, X3 = AG), and βi, βij, and βijk were the regression coefficients obtained for each variable corresponding to linear terms, double and triple interaction terms, respectively.
The formulation of the aqueous phase was optimized with Derringer’s desirability function [29] seeking to maximize the response variables associated with the stability of the emulsions (BS0 h, BS24 h bottom, and BS24 h top, BS72 h bottom, and BS72 h top) and to minimize their polydispersity (D[4,3] – D[3,2]) simultaneously.
For model validation, O/W emulsions were prepared as was previously described (section Characterization of the O/W emulsions) using the ingredient concentrations (PPC, MD, and AG) that maximized the desirability function, characterized as described in section Surface response analysis and the experimental data was compared to the values predicted by the model.
Results were expressed as mean ± standard deviation. Minitab Statistical Software (Minitab Inc., version 17, USA) was used to perform Analysis of Variance (ANOVA), fit the polynomial equations to experimental data, and obtain the coefficients of such equations. The significance of each term of the models was evaluated and referred to the pure error. For verification of the model adequacy, the lack of fit and the coefficient of determination (R2) were calculated. Minitab was used as well for the numerical optimization procedure through Derringer’s desirability function. The statistical differences among samples were determined using Tukey’s honestly significant difference (HSD) test with a level of signification P = 0.05.
The formulation and the procedure for obtaining the emulsions play a fundamental role in their properties and characteristics. An adequate relationship between the lipid and aqueous phases, the presence of emulsifiers and stabilizers, promotes the stabilization of the emulsions. Additionally, a correct input of processing energy favors a greater increase in their stability over time, due to the reduction and homogenization of particle size distributions [9].
Although there are different methods for studying the emulsions’ stability such as transmission and scanning electron microscopy and fluorescence microscopy [30], in this particular work, the particle size distribution (Figure 2), the mean diameters (D[4,3] and D[3,2]) and the difference between them, the flow behavior and the initial stability were characterized immediately after the preparation of the emulsions. In addition, stability measures were made during their sealed refrigerated storage (Table 2). All the emulsions, formulated with the pure components, binary and ternary mixtures, processed after three homogenization cycles, presented multimodal particle size distributions (Figures 2A–C). The particle size range of all processed emulsions was between 0.08–1,000 µm. The emulsions had mean diameter values in the range of D[4,3]: 1.5 µm to 246.6 µm and D[3,2] from 0.3 µm to 39.5 µm (Table 2). The smaller differences between the average parameters of particle diameter distribution (D[4,3] – D[3,2]) indicate that the system presents a certain homogeneity in size and uniformity in the shape of the particles [26, 31].
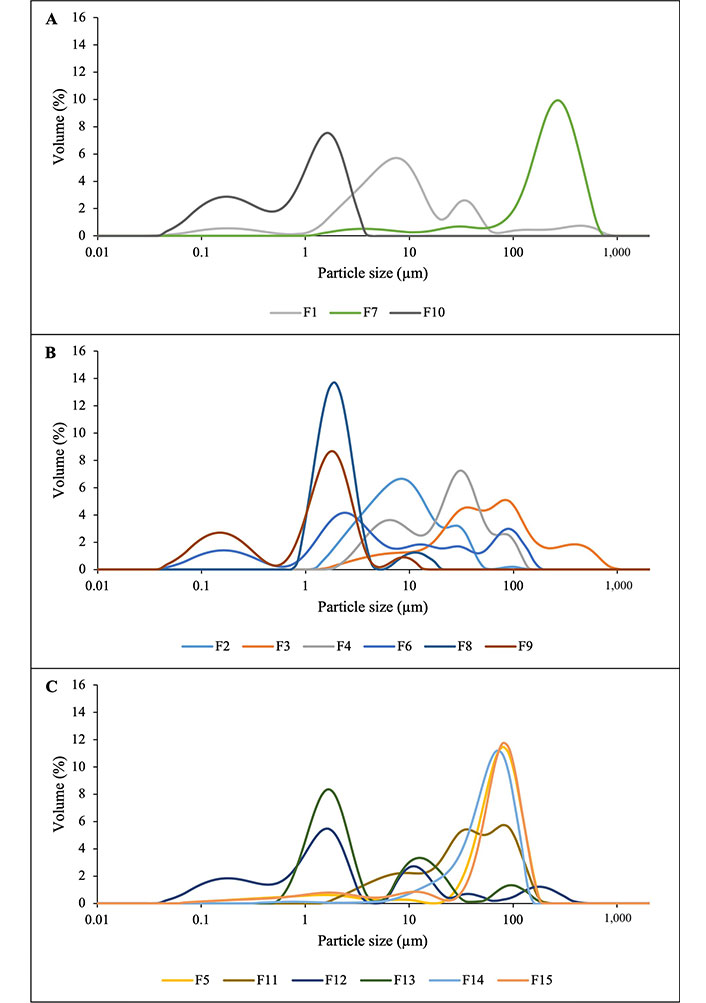
Particle size distribution of the O/W emulsions formulated with (A) pure components; (B) binary mixtures; and (C) ternary mixtures
Volume-weighted (D[4,3]) and surface-weighted (D[3,2]) mean particle diameters, D[4,3] – D[3,2], apparent viscosity at 200 s–1, and backscattering (%BS; BS0 h, BS24 h bottom, BS24 h top, BS72 h bottom, and BS72 h top) of rice bran O/W emulsions (Φm = 0.25) obtained after three cycles of homogenization at 150 bar
| Formulation* | D[4,3] (µm) | D[3,2] (µm) | D[4,3] – D[3,2] (µm) | Apparent viscosity (mPa.s) | BS0 h (%) | BS24 h top (%) | BS24 h bottom (%) | BS72 h top (%) | BS72 h bottom (%) |
|---|---|---|---|---|---|---|---|---|---|
| F1 | 34.52 ± 8.06DEF | 3.78 ± 2.99EF | 30.75 ± 17.73DE | 56.49 ± 1.49C | 89.08 ± 0.99A | 86.54 ± 0.69AB | 88.19 ± 0.91A | 90.23 ± 2.38A | 89.18 ± 2.11A |
| F2 | 27.41 ± 7.39EFG | 8.34 ± 3.49CD | 19.06 ± 14.13EFG | 25.52 ± 1.78EF | 89.67 ± 1.19A | 88.36 ± 2.21A | 88.20 ± 2.04A | 87.47 ± 3.45AB | 88.34 ± 1.88AB |
| F3 | 88.51 ± 12.99B | 20.81 ± 2.02B | 67.70 ± 12.47B | 255.12 ± 4.18B | 87.01 ± 1.59AB | 86.72 ± 2.27AB | 87.41 ± 1.13A | 86.15 ± 1.65ABC | 86.88 ± 0.61ABC |
| F4 | 32.47 ± 7.15DEFG | 12.37 ± 1.04C | 20.11 ± 7.12EFG | 46.65 ± 9.38CD | 88.81 ± 1.98A | 87.95 ± 3.21AB | 87.65 ± 1.81A | 88.05 ± 3.06AB | 88.27 ± 1.64AB |
| F5 | 62.18 ± 3.34BCD | 4.85 ± 1.74DE | 57.33 ± 3.85BC | 46.97 ± 1.24CD | 82.49 ± 0.68BCDE | 82.43 ± 0.51BC | 81.43 ± 1.28BC | 80.62 ± 2.27BCDE | 81.74 ± 1.66CDE |
| F6 | 25.84 ± 0.48EFG | 1.16 ± 0.91EF | 24.69 ± 9.67EF | 43.85 ± 3.73CD | 86.04 ± 2.90ABC | 86.58 ± 1.09AB | 83.88 ± 1.52AB | 81.07 ± 2.48BCDE | 82.46 ± 3.64BCDE |
| F7 | 246.60 ± 38.80A | 39.54 ± 2.49A | 178.98 ± 7.01A | 34.03 ± 10.26DE | 32.83 ± 1.54F | 21.24 ± 1.96E | 20.76 ± 1.03E | 21.41 ± 0.96F | 19.59 ± 0.48F |
| F8 | 2.39 ± 0.390G | 1.75 ± 0.08EF | 0.64 ± 0.31G | 11.79 ± 0.07F | 86.91 ± 2.10AB | 86.50 ± 1.48AB | 86.48 ± 1.13AB | 77.28 ± 4.24DE | 81.08 ± 4.04CDE |
| F9 | 1.51 ± 0.20G | 0.34 ± 0.01F | 1.18 ± 0.19G | 19.42 ± 0.45EF | 88.23 ± 0.83A | 87.43 ± 1.94AB | 87.61 ± 0.25A | 86.10 ± 3.82ABC | 86.59 ± 2.02ABCD |
| F10 | 1.83 ± 0.90G | 0.34 ± 0.02EF | 1.49 ± 0.88FG | 24.01 ± 0.08EF | 84.85 ± 1.96ABCD | 82.28 ± 1.87BC | 84.65 ± 0.42AB | 85.80 ± 2.23ABC | 85.49 ± 1.42ABCD |
| F11 | 56.36 ± 10.81CDE | 17.68 ± 2.25B | 38.69 ± 8.81CDE | 325.82 ± 9.88A | 87.63 ± 1.10A | 87.57 ± 1.98AB | 87.13 ± 0.53AB | 85.33 ± 2.99ABCD | 86.30 ± 2.56ABCD |
| F12 | 52.24 ± 18.71CDE | 0.65 ± 0.11EF | 51.60 ± 18.61BCD | 12.87 ± 4.35F | 79.71 ± 1.80E | 76.89 ± 2.35C | 76.89 ± 1.66C | 76.51 ± 1.65E | 78.81 ± 1.76E |
| F13 | 17.76 ± 12.59FG | 1.23 ± 0.81EF | 16.53 ± 12.78EFG | 22.86 ± 1.57EF | 85.41 ± 1.62ABCD | 77.17 ± 0.59C | 83.72 ± 1.07AB | 84.35 ± 3.36ABCDE | 83.95 ± 1.45ABCDE |
| F14 | 56.69 ± 0.88CDE | 19.16 ± 3.71B | 37.54 ± 3.65CDE | 54.89 ± 0.71C | 80.31 ± 2.24DE | 67.77 ± 0.97D | 67.61 ± 3.66D | 78.99 ± 2.01CDE | 79.20 ± 1.37E |
| F15 | 63.61 ± 3.04BC | 3.67 ± 0.94EF | 59.94 ± 2.52BC | 43.67 ± 0.03CD | 81.74 ± 1.50CDE | 70.88 ± 2.70D | 76.11 ± 4.88C | 80.51 ± 2.05BCDE | 80.48 ± 1.03DE |
* Formulation numbers correspond to Figure 1. Different superscript letters are indicating significant differences (P < 0.05)
The differences (D[4,3] – D[3,2]) range from 0.6 µm to 179.0 µm. For all processed emulsions, apparent viscosities were obtained at a shear rate of 200 s–1, in the range from 11.8 mPa.s to 325.8 mPa.s (Table 2). The 200 s–1 shear rate is characteristic of some food engineering unit operations such as pumping and mixing [27]. The emulsions studied presented high values of initial backscattering (BS0 h around 80%) throughout the measurement tube (Table 2). This suggests a large concentration of small droplets that are homogeneously distributed throughout the measurement tube [32], except for the formulation with MD (F7) in its aqueous phase composition, which presented a BS0 h around 32 %. After 24 h of refrigerated watertight storage, decreases in the backscattering values of the emulsions were observed, more noticeable in some formulations (Table 2). These decreases turn out to be more evident at the top of the tube than at the bottom. This shows that most systems suffered destabilization mainly due to flocculation and coalescence. After 72 h of refrigerated watertight storage, a slight drop in backscattering values was observed regardless of the formulation and the zone of the tube. However, the emulsions that presented the highest values of backscattering were those that presented mainly PPC or AG in their formulation, allowing the interpretation of their usefulness in emulsifying and stabilizing droplets of the lipid phase.
The formulation of the aqueous phase largely determines the properties of the resulting emulsions, as can be noticed in the formulations prepared. The results presented in Table 2 were statistically analyzed through a mixture experimental design and mathematical models. The coefficients for each response variable are presented in Table 1. All the mathematical models obtained successfully predicted the response variables. The models presented R2 greater than 0.74 and a statistically significant P-value (P < 0.05) for the lack-of-fit test, except for differences in D[4,3] and D[3,2], BS24 h bottom and BS24 h top (P > 0.05). However, the adjusted R2 value is considered a more important parameter to evaluate the models to estimate the response variables.
Each of the regression coefficients (βi, βij, and βijk) shown in Table 1 describes the magnitude and direction of the relationship between the term included in the model and the response variable. Also, the model does not include a constant, because it is incorporated into the linear terms. For these reasons, in the linear terms of the components, there are no P-values for statistical comparison [33].
The interaction terms βi, βij, and βijk indicate that the association between the mixture of components and the response is statistically significant when P < 0.05. Positive coefficients of the interaction terms indicate that the components of the term act synergistically; while the negative coefficients are related to an antagonistic interaction when the maximization of the response variable is desired [33]. Contrarily, when the response variable needs to be minimized, the interpretation of the coefficient signs is the opposite.
The emulsions formulated only with pure components presented dissimilar values of differences between the parameters D[4,3] and D[3,2]. The F7 (MD) presented a value close to 178 mm, while the F1 (PPC) of 30 mm and the F10 (AG) of 1.4 mm. The lower values would indicate a greater homogeneity in the sizes and shapes of the drops. The binary mixtures formulated with AG/DM (F8 and F9) presented the lowest values of the difference between the parameters.
In the binary mixtures of PPC/MD (F2 and F4) intermediate values were observed, while the mixture of PPC/AG (F3 and F6) registers the greatest values of the difference between the parameters D[4,3] and D[3,2]. This suggests that the binary mixtures with AG/MD and PPC/MD present a synergy to act at the interface between the aqueous and lipid phases. This behavior is shown in Table 1, where negative values are observed for the PPC/MD and AG/MD coefficients and smaller, positive values for the PPC/AG interaction. The PPC/AG binary mixtures show marked competitiveness at the lipid-aqueous interface. Possibly, the interaction between PPC and AG promotes less homogeneity of sizes and shapes (Table 1).
The ternary mixtures (F5 = F14 = F15, F11, F12, and F13) presented different values between the parameters D[4,3] and D[3,2] between 16 mm and 59 mm (Table 2). The value of the coefficient in Table 1 for the PPC/MD/AG interaction presents a positive value, allowing the interpretation that this interaction promotes the heterogeneity of droplet sizes and shapes. However, that ternary formulation where AG predominates in the composition (F13), presented the lowest values in this response variable. This gives rise to the interpretation that in a ternary mixture, the greatest homogeneity of sizes is found with AG as the main component and highlights the good emulsifying properties of this ingredient.
The contour plots of D[4,3] – D[3,2] for the O/W emulsions is presented in Figure 3. It can be seen that the greatest differences between the parameters D[4,3] – D[3,2] are presented with MD as the main component and in formulations with equal proportions of PPC and AG. The lowest values in this response variable are found with double mixtures between AG and MD, where AG is the majority and the contribution of PPC is minimal.
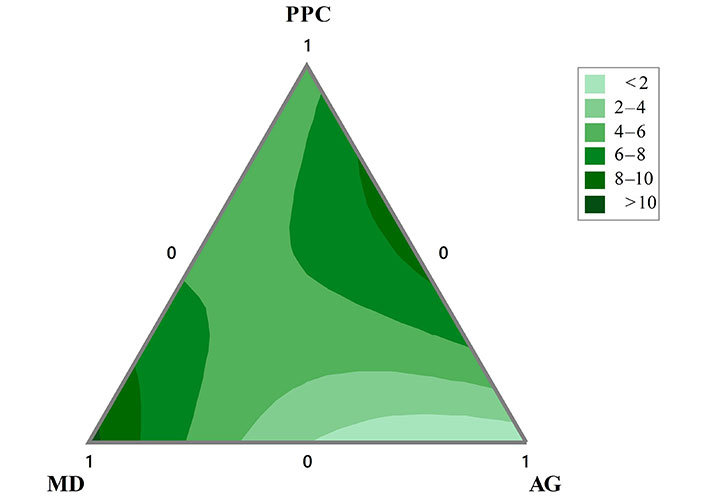
Contour plots of the difference D[4,3] – D[3,2] of the O/W emulsions formulated with mixtures of PPC, MD, and AG in the aqueous phase obtained after three cycles of homogenization
Regarding the flow properties of the emulsions, Table 2 shows the apparent viscosities (evaluated at 200 s–1), and Table 1 shows the regression and correlation coefficients of the model and parameters of the statistical analysis. The highest viscosity values were presented by the emulsions formulated with PPC as the main component in a ternary mixture (F11), followed by the binary mixture containing PPC/AG (F3). Interactions probably occur between the PPC and AG macromolecules that increase the resistance to the flow of the emulsions. In general, gums are negatively charged in a wide range of pH while proteins can be positively or negatively charged, depending on the pH of the medium [34]. PPC and AG carried a net negative charge at neutral pH, thus, tend to fully expand due to electrostatic repulsion, occupying maximum volume in solution and offering maximum resistance to flow. A similar effect was observed by İbanoğlu [35] between the whey protein concentrate (WPC) and AG. Therefore, a trend can be observed where the emulsions that present PPC as an ingredient of the aqueous phase show the highest viscosity values, and those others with a lower proportion or absence of PPC as an ingredient, present the lowest values of apparent viscosity evaluated at 200 s–1.
The coefficients of the PPC/AG interactions are positive (Table 1), allowing the interpretation that the interaction of these two compounds promotes the increase in viscosity. The PPC/MD and AG/MD interactions are negative, acting synergistically to decrease the apparent viscosity. Likewise, the term corresponding to the triple interaction was negative. However, the regression obtained values close to R2 (0.41) for model fit and P-values greater than 0.05. Therefore, the apparent viscosity response variable will not be considered for optimization.
The contour plot of the apparent viscosity evaluated at 200 s–1 is presented in Figure 4. As, it can be seen that the highest values in this response variable are found with double mixtures of PPC and AG, with lower contributions of MD. On the other hand, the emulsions formulated mainly with AG and MD and lower proportions of PPC present the lowest values of apparent viscosity.
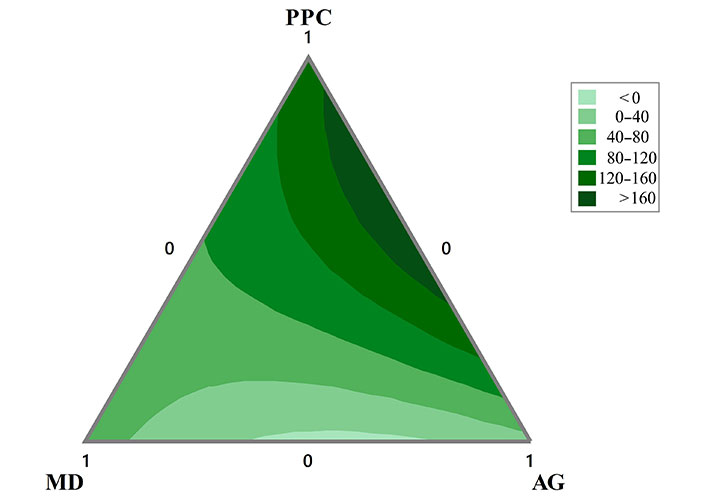
Contour plots of the apparent viscosity (mPa.s) evaluated at 200 s–1 of the O/W emulsions formulated with mixtures of PPC, MD, and AG in the aqueous phase obtained after three cycles of homogenization
In a global analysis of Table 1 regarding the backscattering values, it can be seen that all the coefficients, both the linear terms and the double mixtures, are positive; except for the double PPC/MD mixtures for the time 3 days (BS72 h top and BS72 h bottom). The positive incidence of linear backscattering coefficients is relevant in all cases. However, the incidence of the coefficients is statistically significant only for the PPC/AG interactions, while the PPC/MD and AG/MD interactions are not. The triple interaction coefficients are negative, allowing the interpretation that the mixture of the three ingredients in the aqueous phase is ineffective in stabilizing the oil droplets. Despite this, the triple interaction coefficients are statistically significant only for the response variables BS0 h, BS72 h top, and BS72 h bottom.
In the contour graphs (Figure 5A–E) it can be seen that in those emulsions with a higher proportion of MD as the main ingredient of the aqueous phase, the resulting stability is minimal, regardless of time. However, when the MD is found in a lower proportion, accompanying AG and especially PPC, the emulsions with greater stability are found. In addition, it is observed that those double mixtures between PPC and AG, present reduced stability.
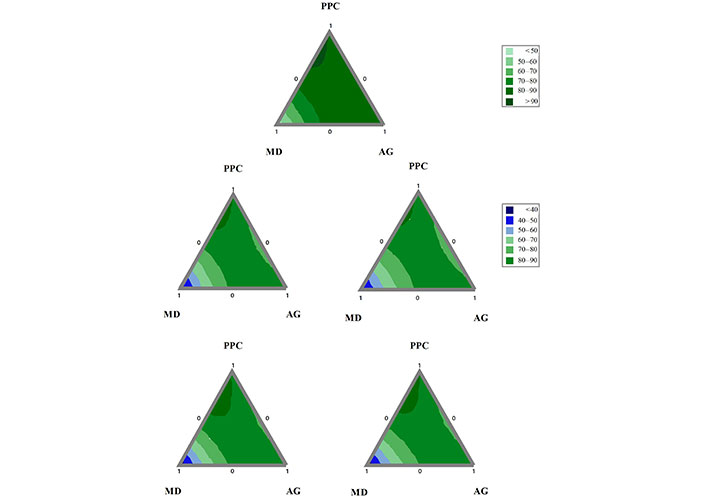
Contour plots of the O/W emulsions formulated with mixtures of PPC, MD, and AG obtained in three cycles of homogenization. (A) BS0 h; (B) BS24 h bottom; (C) BS24 h top; (D) BS72 h bottom; (E) BS72 h top
The destabilization produced by the combination of PPC and AG is possibly due to their electrostatic repulsion and their competition for the interphase, and may cause a lesser concentration of emulsifier on the interphase. Coacervation between PPC and AG has been reported [36], although at different pH values. The stability seems to be slightly improved by the addition of MD to the PPC/AG mixture, however, the combination of the three ingredients continues to be worse than the binary mixtures PPC/MD and AG/MD.
To identify a mixture of the aqueous phase that allows obtaining the best properties for O/W emulsions, the optimization was carried out following the desirability function. The desirability function seeks to minimize the values of the parameters D[4,3] and the difference between the parameters D[4,3] and D[3,2]. Additionally, it seeks to maximize the stability values (BS0 h, BS24 h bottom, BS24 h top, BS72 h bottom, and BS72 h top). The apparent viscosity values at 200 s–1 were not considered as a response variable in the optimization because they presented R2 values below 0.70. It should also be noted that no weights were applied in the statistical software to overestimate or underestimate response variables over others. In the global desirability function, for the responses D[4,3] and the difference between the parameters D[4,3] and D[3,2], the objective was to minimize the values, the target was set in 1 and the limit 10. As for the stability values (BS0 h, BS24 h bottom, BS24 h top, BS72 h bottom, and BS72 h top), the objective was to maximize the values, the target was set at 95 and the limit 80.
The statistical software, through the desirability function, calculated the optimal formulations in the aqueous phase, optimizing the properties of the O/W emulsions processed in three homogenization cycles. The optimal formulation of the aqueous phase for the emulsions obtained turned out to be the one with 78% PPC and 22% MD (without AG); achieving a desirability close to 79%. This is in following with every regression coefficient for the ternary mixtures showing significant antagonism between the three components in all the responses studied.
To validate the predicted optimal O/W emulsion formulation (78% PPC, 22% MD, and 0% AG), the emulsion was prepared and tested. The responses predicted by the model and those obtained experimentally for the optimal O/W emulsion are presented in Table 3.
Comparison of the response variables D[4,3], D[4,3] – D[3,2], and global stability (BS0 h, BS24 h bottom, BS24 h top, BS72 h bottom, and BS72 h top) predicted by the model and those obtained experimentally for the optimal rice bran O/W emulsion formulated with 78% PPC, 22% MD and 0% AG in the aqueous phase, obtained after three cycles of homogenization at 150 bar
| Data | D[4,3] (µm) | D[4,3] – D[3,2] (µm) | BS0 h (%) | BS24 h bottom (%) | BS24 h top (%) | BS72 h bottom (%) | BS72 h top (%) |
|---|---|---|---|---|---|---|---|
| Predicted by the model | 4.39 | 3.66 | 96.88 | 97.76 | 97.54 | 98.10 | 97.62 |
| Experimental | 10.61 ± 0.70 | 9.92 ± 0.67 | 88.07 ± 1.61 | 87.24 ± 1.35 | 88.03 ± 0.98 | 87.29 ± 0.64 | 87.29 ± 0.38 |
Values reported for experimental results are expressed as means standard deviation (n = 3)
This emulsion presented a multimodal particle size distribution, with a major peak around 0.8–0.9 µm, the following peak around 34 µm, and a smaller one at 0.2 µm. The values of the parameters D[4,3] were in the order of 10.66 µm and the difference between the parameters D[4,3] and D[3,2] was close to 9.9 µm. These values turned out to be higher than those predicted by the model (Table 3). The optimal emulsion presented experimental values of backscattering regardless of the zone and time that ranged between 87–88%. However, the values predicted by the model (96–98%) are higher than the experimental ones. Even though the actual values of backscattering differ, their variation over time is not significant either in the model or in the experimental verification (Table 3). Therefore, despite the numerical differences, the model obtained allows us to describe, with some limitations, the behavior of the O/W emulsions studied.
The stability conditions of emulsions depend on variables such as the droplet size distribution of the oil droplets present in the emulsion, as well as the viscosity of the continuous phase. Additionally, these variables are influenced by the emulsion formulation as well as the processing and storage conditions. Thus, each emulsification system has its own specific advantages and disadvantages for the intended purpose.
Previously, several studies have explored various aspects related to the formulation and stabilization of O/W emulsions using RBO as the oily phase. Emulsified systems using RBO as the lipid phase have been investigated in works such as [20, 37–45]. In these studies, various emulsifying and stabilizing materials were employed, such as AG, whey protein isolate (WPI), modified starch, egg yolk, glycerol monostearate, a mix of medium-chain triglycerides, poly e-caprolactone, and sorbitan monostearate (Span 60), WPC, pectin, zein, inulin, and Tween 80, polyglycerol polyricinoleate ester, nanocrystalline cellulose, rice bran protein, and sodium caseinate. These emulsions were obtained using microfluidizers, sonicators, mechanical stirrers, and homogenizers at high hydrodynamic pressures, where generally larger droplet sizes are obtained than those presented in this study. However, these systems typically exhibit lower lipid content, with the exception of the work published by Chetana et al. [46] 2019, where a mayonnaise with 63–65% fat was developed.
In conclusion, rice bran O/W emulsions (Φm = 0.25) were prepared in different proportions of PPC, MD, and AG. The PPC and AG showed their good emulsifying properties, even in emulsified systems that present high proportions of lipids; but MD did not. Generally, binary or ternary mixtures allow to improve the strengths of these ingredients and reduce their limitations. The optimal formulation of the aqueous phase for the emulsions obtained after three cycles of homogenization turned out to be that with 78% PPC and 22% MD and without the presence of AG. This emulsion was characterized, and its properties were compared with the responses predicted by the model. In this sense, the model obtained allowed us to describe, with some limitations, the behavior of the O/W emulsions studied. The optimized emulsion formulation holds promise for developing plant-based foods and beverages.
AG: Arabic gum
D[3,2]: surface-weighted mean diameter
D[4,3]: volume-weighted mean diameter
MD: maltodextrin
O/W: oil-in-water
PPC: pea protein concentrate
RBO: rice bran oil
Φm: oil mass fraction
Marcos Malvasio was beneficiary of the scholarship from the National Interuniversity Council of Argentina (Beca de Estímulo a las Vocaciones Científicas EVC-CIN 2021-2022). Raúl Petelin is beneficiary of a doctoral scholarship from the National Council for Scientific and Technical Research of Argentina (Beca interna doctoral cofinanciada UNER - CONICET, RESOL-2022-259-APN#DIR#CONICET) and Daiana Monetta is beneficiary of a doctoral scholarship from the National Council for Scientific and Technical Research of Argentina (Beca interna doctoral cofinanciada CONICET-Delegación Argentina de la Comisión Técnica Mixta de Salto Grande, RESOL-2022-517-APN-DIR#CONICET). Mercedes Rasia is beneficiary of the postdoctoral scholarship from the National Council for Scientific and Technical Research of Argentina (Beca Postdoctoral Cofinanciada CONICET-UNER, RESOL-2022-907-APN-DIR#CONICET). Juan Manuel Castagnini is a beneficiary of the grant (ZA21-028) for the requalification of the Spanish university system from the Ministry of Universities of the Government of Spain, modality “Maria Zambrano”, financed by the European Union, NextGeneration EU through the project “Extraction of bioactive compounds from food matrices using innovative and sustainable technologies (EXTRABIO)”.
LOB: Conceptualization, Methodology, Validation, Formal analysis, Resources, Data curation, Writing—original draft, Writing—review & editing, Visualization, Project administration, Funding acquisition. RP: Conceptualization, Methodology, Formal analysis, Data curation, Writing—original draft, Visualization. MM: Conceptualization, Validation. DM: Validation. MR: Validation. MAM: Methodology, Writing—review & editing. JMC: Conceptualization, Formal analysis, Investigation, Writing—review & editing, Supervision.
The authors declare that they have no conflicts of interest.
Not applicable.
Not applicable.
Not applicable.
The original data of this article can be obtained by contacting the author (Lucas O. Benitez, lucas.benitez@uner.edu.ar; Juan M. Castagnini, juan.castagnini@uv.es).
This work is supported by the Universidad Nacional de Entre Ríos for the Research Project Desarrollo de un producto bebible emulsionado apto para ser incluido en la dieta cetogénica [PID 8106]. The funders had no role in study design, data collection and analysis, decision to publish, or preparation of the manuscript.
© The Author(s) 2024.
Copyright: © The Author(s) 2024. This is an Open Access article licensed under a Creative Commons Attribution 4.0 International License (https://creativecommons.org/licenses/by/4.0/), which permits unrestricted use, sharing, adaptation, distribution and reproduction in any medium or format, for any purpose, even commercially, as long as you give appropriate credit to the original author(s) and the source, provide a link to the Creative Commons license, and indicate if changes were made.

Angela Daniela Carboni ... María Cecilia Puppo
Luciana M. Julio ... Vanesa Y. Ixtaina
Deniz Günal-Köroğlu ... Esra Capanoglu
Juliana Ripari Garrido ... María Victoria Salinas
Lucía Cassani, Andrea Gomez-Zavaglia
