 Original Article

Affiliation:
1Department of Food Technology, Faculty of Agriculture, Universitas Negeri Gorontalo, Gorontalo 96554, Indonesia
Email: agusrachman@ung.ac.id
ORCID: https://orcid.org/0000-0001-5668-4892
Affiliation:
1Department of Food Technology, Faculty of Agriculture, Universitas Negeri Gorontalo, Gorontalo 96554, Indonesia
ORCID: https://orcid.org/0000-0002-0683-9670
Affiliation:
2Research Centre for Food Technology and Processes, National Research and Innovation Agency (BRIN), Yogyakarta 55861, Indonesia
Email: lukm016@brin.go.id
ORCID: https://orcid.org/0009-0008-8057-9118
Affiliation:
2Research Centre for Food Technology and Processes, National Research and Innovation Agency (BRIN), Yogyakarta 55861, Indonesia
ORCID: https://orcid.org/0009-0007-4632-0287
Affiliation:
3Department of Animal Product Technology, Faculty of Animal Science, Universitas Brawijaya, Malang 65145, Indonesia
ORCID: https://orcid.org/0000-0002-5511-6241
Affiliation:
3Department of Animal Product Technology, Faculty of Animal Science, Universitas Brawijaya, Malang 65145, Indonesia
ORCID: https://orcid.org/0000-0001-6013-9723
Explor Foods Foodomics. 2026;4:1010173 DOI: https://doi.org/10.37349/eff.2026.1010173
Received: November 22, 2025 Accepted: May 17, 2026 Published: June 29, 2026
Academic Editor: Marcello Iriti, Milan State University, Italy
Aim: To evaluate the effects of Syzygium cumini extract on selected physicochemical, microbiological, and bioactive properties of goat milk kefir.
Methods: Goat milk kefir was supplemented with varying concentrations of S. cumini extract and analyzed for physicochemical parameters, antioxidant activity, lactic acid bacteria (LAB) viability, amino acid composition, fatty acid profile, and microstructure. Multivariate analysis was applied to assess relationships among quality attributes.
Results: The addition of S. cumini extract influenced several quality parameters of kefir. The treatments showed increased antioxidant activity and, for the 2.0% extract, higher LAB counts than the control. Modifications in protein, fat, amino acid, and fatty acid profiles were also observed. In addition, extract supplementation significantly affected protein content, antioxidant capacity, and color parameters, while viscosity showed only numerical variation. Principal component analysis indicated that kefir samples with 1.5% and 2.0% extract were associated with a distinct set of physicochemical and functional properties.
Conclusions: The incorporation of S. cumini extract may contribute to modifications in the physicochemical and biofunctional characteristics of goat milk kefir. These findings suggest its potential application as a natural ingredient in fermented dairy products; however, further studies are recommended to confirm its functional and shelf-life implications.
Researchers and industry experts acknowledged the nutritional worth and health benefits of fermented dairy products like kefir and yogurt. Probiotics and bioactive substances found naturally in certain foods support immunity, metabolism, and digestion [1]. Antioxidant, antibacterial, and anti-inflammatory lactic acid bacteria (LAB), yeasts, and acetic acid bacteria are all found in kefir [2]. Dairy products can be made even healthier by adding plant-based bioactive ingredients. Fruits rich in polyphenols, for example, can increase nutritional value, strengthen antioxidant stability, and increase consumer demand [3, 4]. These developments reflect increasing scientific interest in combining traditional fermentation processes with plant-derived bioactive compounds to enhance the functional properties of dairy products [5].
The nutritional value and flavor of fermented dairy products are enhanced by plant chemicals called polyphenols. As naturally occurring antioxidants, they aid in oxidation prevention and shield cells from harm brought on by free radicals. Incorporating fruit polyphenols into dairy fermentation might enhance the end product’s flavor and color while also promoting the survival of beneficial bacteria [6]. The tropical fruit Syzygium cumini, popularly known as jamblang or Java plum, has potent antioxidant, antidiabetic, and anti-inflammatory properties, which are associated with its high contents of anthocyanins, flavonoids, and tannins [7]. In addition to providing health benefits, these substances interact with microorganisms and dairy proteins during fermentation to produce more stable and nutrient-dense products [8].
Interest in functional dairy foods is part of a wider trend of mixing plant-based bioactive compounds with animal products. This approach presents scientific and technical challenges, particularly in terms of stability, absorption, and interactions of phenolic compounds in complex foods matrix. Phenolic compounds can undergo changes when pH, temperature, or enzyme activity shifts during fermentation, which may affect their structure and reduce their effectiveness [5]. While polyphenols can support probiotic growth and function, excessive amounts can harm the microbes, so product development must find the right balance [9]. These considerations provide the rationale for evaluating the effects of S. cumini extract on the physicochemical, microbiological, and biochemical properties of goat milk kefir [10, 11].
Goat milk has a superior protein profile, smaller fat globules, and is more easily to digested than cow milk, thus it is frequently selected for fermentation [12, 13]. It has a smoother texture and helps the body absorb nutrients more quickly due to its low αs1-casein and higher quantities of short- and medium-chain fatty acids [14, 15]. LAB convert milk proteins into bioactive peptides that have antihypertensive, immune-stimulating, and antioxidant properties during fermentation [16]. Goat milk kefir is a useful model for researching the interaction between milk and fruit chemicals because these peptides promote gastrointestinal and metabolic health. Additionally, fermentation helps release advantageous peptides and fatty acids and makes micronutrients more accessible [17].
Goat milk kefir gains additional nutritional and sensory benefits when fruit polyphenols from S. cumini are added. The stability and functionality of the product are enhanced when polyphenols are combined with milk proteins. By preventing oxidation, these interactions preserve high antioxidant levels and increase shelf life [18]. Kefir’s texture and appearance are enhanced by anthocyanins that attach to milk proteins, thickening it and preserving its color [5]. These modifications have an impact on the molecular breakdown of proteins and fats, increasing the production of free amino acids and unsaturated fatty acids, which boosts nutritional value [19]. However, information remains limited regarding how different concentrations of S. cumini extract influence the quality characteristics of goat milk kefir.
The lack of official standards and regulations has made research on fruit-enriched fermented dairy products difficult. It is challenging to compare studies or create universal recipes due to variations in fruit concentration, fermenting techniques, and analysis [10, 11]. Instead of integrating data from several fields, most studies focus on specific factors, such as microbial viability or antioxidant activity. However, the effects of fruit polyphenols on kefir remain insufficiently understood. Goat milk kefir, which might have advantages of its own, has not gotten as much attention as cow’s milk [2]. Future investigations on the impacts of fruit phenolics should combine compositional analysis, microbiological testing, and statistical modelling.
Tropical fruits like mulberry, jamblang, and jaboticaba have been added to dairy drinks in recent studies. According to de Oliveira Galdino et al. [2], adding tropical fruits to goat milk kefir promotes microorganisms, aids in fermentation, and stabilizes pigments, all of which enhance antioxidant levels and flavor. Additionally, Kandhan et al. [6] showed that amla and jamun extracts improve ice cream’s antidiabetic and antioxidant qualities, indicating that these fruits may be useful in functional dairy products. A relatively recent processing technique called thermosonication helps preserve phenolic compounds and their advantages during dairy fermentation, increasing the stability of these compounds [11]. Utilizing agricultural byproducts as sources of polyphenols promotes by reducing food loss and waste the food industry with both practical and financial advantages [1, 19].
Despite these developments, little is known about how different concentrations of S. cumini affect the microbiological, physicochemical, and bioactive characteristics of goat milk kefir. The aim of this study was to identify the ideal polyphenol concentration that maintains a balanced microbial composition, offers health benefits, and retains flavor and texture. It is essential to comprehend how phenolic compounds, bacteria, and milk components interact to make bioactive chemicals in order to create goods that are dependable, simple to manufacture, and satisfy consumer expectations as well as nutritional criteria [8, 10].
This study investigates how the physical, chemical, microbiological, and bioactive characteristics of goat milk kefir are affected by the addition of S. cumini extract. The objective is to measure the antioxidant activity, microbial growth, amino acid and fatty acid content, and structure of kefir in order to determine the best method to enhance its nutrition and function. Multivariate analysis is used in the study to comprehend S. cumini’s overall effects, particularly how its polyphenols interact with the bacteria in kefir. The results are intended to increase understanding of fruit and milk fermentation, which will aid in the creation of regional dairy products that promote global nutrition, sustainability, and health objectives.
Fresh goat milk (approximately 10 L per batch) was obtained from local dairy farms in Gorontalo Province, Indonesia, and collected during morning milking (06:00–07:00 AM) using a manual (hand milking) method under hygienic conditions to ensure sample quality. Milk kefir grains utilized in this study were sourced from the commercial product Kefiree (Grade A) obtained from the Laboratory of Aracaki, Cisarua, West Java, Indonesia. Based on information provided by Aracaki Indonesia, these kefir grains contain a symbiotic consortium of microorganisms, including LAB such as Lactococcus spp. and Lactobacillus plantarum, and yeasts such as Saccharomyces cerevisiae. The same batch of kefir grains was used throughout the study to ensure experimental consistency and reproducibility. Fresh S. cumini fruits were collected from nearby plantations in Gorontalo Province and selected based on uniform size, color, and maturity. All analytical-grade reagents, including Trolox, ethanol, and methanol, were purchased from Sigma-Aldrich (USA).
Ripe S. cumini fruits were used as the raw material for extract preparation. Approximately 1 kg of fruits was washed, deseeded, and processed as described in the extraction procedure, using a fruit-to-solvent ratio of 1:3 (w/v) under continuous stirring for 24 hours at room temperature. The extract was filtered using Whatman No. 1 filter paper, and the solvent was evaporated under reduced pressure at 45°C using a rotary evaporator (Buchi R-215, Switzerland) to obtain a concentrated extract. The resulting S. cumini extract was stored at 4°C until further use. Proximate composition was determined using standard methods of the Association of Official Analytical Chemists (AOAC), including moisture [20], ash [21], protein (Kjeldahl) [22], and fat contents [23], while carbohydrate content was calculated by difference. Total soluble solids were evaluated using a portable digital refractometer (Instrutherm, Brazil). Titratable acidity was determined by the volumetric technique with an indicator, according to Santos et al. [24]. The pH was evaluated by measuring in a digital pH meter (Hanna Instruments, Italy). Total phenolic content was quantified using the Folin–Ciocalteu method [25] and expressed as milligrams of gallic acid equivalents per 100 g of extract (mg GAE/100 g). Antioxidant activity was assessed using the 2,2-diphenyl-1-picrylhydrazyl (DPPH) radical scavenging assay [26], and results were expressed as milligrams of fresh weight per millilitre (mg FW/mL).
Goat milk was pasteurized at 85°C for 10 minutes and cooled to 25°C before inoculation. The experiment consisted of four treatments: control (0% extract), T1 (1%), T2 (1.5%), and T3 (2%) S. cumini extract (v/v), with each treatment conducted in triplicate (n = 3). Kefir grains were inoculated at 5% (w/v) and incubated for 24 hours at 25 ± 1°C. After fermentation, the kefir samples were filtered to remove grains and stored at 4°C for subsequent analysis.
The protein content was determined using the Kjeldahl method [22], and fat content was analyzed by the Gerber method [27]. The pH values were measured using a calibrated digital pH meter (Hanna Instruments, Italy). Viscosity was determined using a Brookfield viscometer (Model DV-II+, USA) at 25°C. Color parameters (L*, a*, b*) were measured using a calibrated colorimeter (CR-400, Konica Minolta, Japan) under standardized conditions at 25 ± 1°C [28, 29]. Antioxidant activity was assessed using the TEAC method following the protocol described by Re et al. [30], and results were expressed as milligram Trolox equivalents per gram (mg TE/g).
Microbiological evaluation included enumeration of LAB and yeast & mold populations [31]. Serial dilutions of kefir samples were plated on de Man, Rogosa, and Sharpe (MRS) agar for LAB and on Potato Dextrose Agar (PDA) for yeasts and molds. The plates were incubated at 37°C for 48 hours (LAB) and 30°C for 72 hours (yeasts and molds). Microbial counts were expressed as log CFU/mL.
Amino acid profiles were prepared according to Kráčmar et al. [32] and determined using High-Performance Liquid Chromatography (HPLC; Shimadzu LC-20AT, Japan) after derivatization with o-phthalaldehyde (OPA). Samples were hydrolyzed with 6 N HCl at 110°C for 24 hours in sealed ampoules. The resulting amino acids were separated on a C18 reversed-phase column, and individual amino acids were quantified by comparing retention times with known standards. Data were expressed as mg amino acid per 100 mL of kefir.
Fatty acid methyl esters (FAMEs) were prepared according to Xiao et al. [33] procedure and analyzed using Gas Chromatography (GC; Agilent 7890A, USA) equipped with a flame ionization detector (FID) and an HP-88 capillary column (100 m × 0.25 mm, 0.20 μm film thickness). The injector and detector temperatures were set at 250°C, and the oven was programmed from 120°C to 230°C at a rate of 3°C/min. Fatty acids were identified by comparing retention times with standard FAME mixtures and expressed as a percentage of total fatty acids.
Following Xiao et al. [33] suggested methodology, the milk samples’ structures were examined using the Olympus FV1200 confocal scanning laser microscope. The confocal scanning laser microscopy was outfitted with a silicon oil objective lens and an inverted microscope (magnification 150×). A tagged image file format was used to acquire digital image files. One milliliter of goat milk kefir sample was stained with 10 µL of Nile Red solution (1 mg/mL in ethanol) and 10 µL of fluorescein isothiocyanate (FITC) solution (1 mg/mL in ethanol), followed by incubation for 30 min prior to analysis. Then, 20 µL of the stained material was pipetted onto a glass slide, covered with a coverslip, and put directly into the confocal scanning laser microscope. In order to conduct the observations in a dark room, the emission wavelengths for FITC and Nile Red were set at 495 to 559 nm and 534 to 488 nm, respectively, and the excitation wavelengths were set at 500 to 600 nm.
All experiments were performed in triplicate, and data were expressed as mean ± standard deviation (SD). One-way analysis of variance (ANOVA) was performed to assess significant differences among treatments, followed by Duncan’s Multiple Range Test (DMRT) at a 95% confidence level (p < 0.05) using SPSS software (version 25.0, IBM Corp., USA). Principal Component Analysis (PCA) was conducted using OriginPro 2022 software to evaluate the multivariate relationships among physicochemical, microbiological, and biochemical parameters of kefir samples across different S. cumini extract concentrations.
The proximate composition analysis of S. cumini extract indicated that moisture was the predominant component (80.21 ± 0.03%), followed by carbohydrates (8.14 ± 0.57%) and protein (5.21 ± 0.28%). Ash and lipid contents were comparatively lower, at 1.32 ± 0.15% and 0.82 ± 0.26%, respectively. The extract also exhibited 12.71 ± 0.04 °Brix total soluble solids, 0.61 ± 0.02% titratable acidity, and a pH of 4.10 ± 0.02, indicating an acidic, soluble solid-rich fruit matrix. The phenolic content of the extract was 149 ± 2 mg GAE/100 g extract, and antioxidant activity, as determined by the DPPH assay, yielded an EC50 value of 5,295.87 ± 92.15 mg FW/mL. These findings demonstrate that S. cumini extract possesses quantifiable phenolic content and antioxidant capacity, supporting its potential use as a functional additive in goat milk kefir formulations.
The addition of S. cumini extract significantly affected several physicochemical properties of goat milk kefir (p < 0.05) (Table 1). Protein content increased from 2.54 ± 0.19% in the control to 3.42 ± 0.21% in T2 and 3.39 ± 0.33% in T3. Color parameters were significantly influenced by treatment, including L*, a*, and b*.
Physicochemical properties of goat milk kefir with varying concentrations of Syzygium cumini extract.
| Treatment | Protein (%) | Fat (%) | TEAC (mg TE/g) | pH | Viscosity (mPa·s) | Color measurements | ||
|---|---|---|---|---|---|---|---|---|
| L* | a* | b* | ||||||
| Control (0%) | 2.54 ± 0.19b | 3.55 ± 0.46a | 0.80 ± 0.07c | 5.13 ± 0.25a | 10.90 ± 2.99a | 84.12 ± 0.35c | –1.88 ± 0.02d | 12.47 ± 0.05a |
| T1 (1%) | 3.00 ± 0.15b | 3.09 ± 0.04a | 1.09 ± 0.25b | 5.13 ± 0.03a | 20.00 ± 6.71a | 83.25 ± 0.35d | –1.52 ± 0.02c | 11.38 ± 0.49b |
| T2 (1.5%) | 3.42 ± 0.21a | 4.41 ± 0.06a | 1.46 ± 0.03b | 4.95 ± 0.13a | 22.23 ± 8.29a | 85.40 ± 0.71a | –0.62 ± 0.12b | 11.70 ± 0.09b |
| T3 (2%) | 3.39 ± 0.33a | 4.58 ± 1.48a | 2.16 ± 0.13a | 4.84 ± 0.08a | 41.87 ± 27.10a | 83.95 ± 1.25b | –0.45 ± 0.31a | 10.58 ± 0.40c |
Notes: Values are expressed as mean ± standard deviation (n = 3). Means within the same column followed by different lowercase letters are significantly different according to Duncan’s Multiple Range Test at p < 0.05. One-way ANOVA showed significant treatment effects for protein (F = 9.63, p = 0.0049), TEAC (F = 48.60, p < 0.001), L* (F = 4.17, p = 0.0472), a* (F = 51.63, p < 0.001), and b* (F = 17.90, p = 0.0007), but not for fat (F = 2.49, p = 0.1341), pH (F = 2.83, p = 0.1066), or viscosity (F = 2.38, p = 0.1455).
In contrast, fat content, pH, and viscosity were not significantly affected by supplementation. Fat content ranged from 3.09 ± 0.04% to 4.58 ± 1.48%, pH from 4.84 ± 0.08 to 5.13 ± 0.25, and viscosity from 10.90 ± 2.99 to 41.87 ± 27.10 mPa·s. Overall, the main treatment effects were observed for protein and color attributes.
The antioxidant capacity, expressed as TEAC, increased significantly with increasing S. cumini supplementation (p < 0.05) (Table 1), from 0.80 ± 0.07 mg TE/g in the control to 2.16 ± 0.13 mg TE/g in T3. These findings indicate that S. cumini extract enhanced the antioxidant potential of goat milk kefir. The higher TEAC values in the 1.5% and 2% treatments may reflect the presence of phenolic compounds from the extract and their modification during fermentation. However, as specific antioxidant metabolites were not directly analyzed, this explanation remains interpretative.
The addition of S. cumini extract influenced microbial populations in goat milk kefir (Table 2). Total LAB counts differed significantly among treatments (p < 0.05), increasing from 7.59 log CFU/mL in the control to 8.50 log CFU/mL in T3. Duncan’s test indicated that T3 showed higher values compared with the control, while T1 and T2 exhibited intermediate values.
Microbiological characteristics of goat milk kefir enriched with different concentrations of Syzygium cumini extract.
| Treatment | Total LAB (log CFU/mL) | Yeast & mold (log CFU/mL) |
|---|---|---|
| Control (0%) | 7.5949 ± 0.0546b | 7.0792 ± 0.0000b |
| T1 (1%) | 7.7257 ± 0.3939ab | 7.1964 ± 0.1166a |
| T2 (1.5%) | 8.0655 ± 0.4943ab | 7.2671 ± 0.0166a |
| T3 (2%) | 8.4998 ± 0.0967a | 7.2899 ± 0.0157a |
Notes: Values are expressed as mean ± standard deviation (n = 3). Means within the same column followed by different lowercase letters are significantly different according to Duncan’s Multiple Range Test at p < 0.05. One-way ANOVA showed significant treatment effects for total LAB (F = 4.761, p = 0.0345) and yeast & mold (F = 7.629, p = 0.0099).
Yeast and mold counts also showed significant differences (p < 0.05), ranging from 7.08 log CFU/mL in the control to 7.29 log CFU/mL in T3. However, post hoc analysis revealed that T1, T2, and T3 were not significantly different from each other, although all tended to be higher than the control.
The amino acid profile of goat milk kefir was significantly affected by S. cumini supplementation (Table 3). All amino acids showed significant differences among treatments (p < 0.05). Concentrations of both non-essential (e.g., Glu + Gln, Asp + Asn) and essential amino acids (e.g., Leu, Val, Ile, Lys) increased progressively with higher extract levels.
Amino acid concentrations (mg/100 mL) in goat milk kefir from different Syzygium cumini concentrations.
| Treatment | Asp + Asn | Glu + Gln | Ser | Gly | Ala | Val | Ile | Leu | Tyr | Phe | His | Lys |
|---|---|---|---|---|---|---|---|---|---|---|---|---|
| Control (0%) | 1.10 ± 0.05ᵃ | 1.50 ± 0.06ᵃ | 0.60 ± 0.03ᵃ | 0.50 ± 0.02ᵃ | 0.70 ± 0.03ᵃ | 0.65 ± 0.03ᵃ | 0.60 ± 0.03ᵃ | 0.85 ± 0.04ᵃ | 0.40 ± 0.02ᵃ | 0.45 ± 0.02ᵃ | 0.30 ± 0.02ᵃ | 0.80 ± 0.04ᵃ |
| T1 (1%) | 1.25 ± 0.06ᵃᵇ | 1.70 ± 0.08ᵇ | 0.68 ± 0.04ᵃᵇ | 0.55 ± 0.03ᵃᵇ | 0.78 ± 0.04ᵃᵇ | 0.70 ± 0.03ᵃᵇ | 0.68 ± 0.03ᵃᵇ | 0.95 ± 0.05ab | 0.45 ± 0.02ᵃᵇ | 0.50 ± 0.03ᵃᵇ | 0.35 ± 0.02ᵃᵇ | 0.90 ± 0.05ᵇ |
| T2 (1.5%) | 1.40 ± 0.07ᵇ | 1.95 ± 0.09ᶜ | 0.75 ± 0.03ᵇ | 0.65 ± 0.03ᵇ | 0.85 ± 0.04ᵇ | 0.82 ± 0.04ᵇ | 0.78 ± 0.04ᵇ | 1.10 ± 0.05ᵇ | 0.52 ± 0.03ᵇ | 0.60 ± 0.03ᵇ | 0.40 ± 0.02ᵇ | 1.05 ± 0.05ᶜ |
| T3 (2%) | 1.45 ± 0.06ᵇ | 2.05 ± 0.08ᶜ | 0.78 ± 0.04ᵇ | 0.68 ± 0.03ᵇ | 0.88 ± 0.04ᵇ | 0.85 ± 0.04ᵇ | 0.80 ± 0.04ᵇ | 1.15 ± 0.05ᵇ | 0.55 ± 0.03ᵇ | 0.62 ± 0.03ᵇ | 0.42 ± 0.02ᵇ | 1.08 ± 0.05ᶜ |
Notes: Values are expressed as mean ± standard deviation (n = 3). Means within the same column followed by different lowercase letters are significantly different according to Duncan’s Multiple Range Test at p < 0.05. One-way ANOVA showed significant treatment effects for Asp + Asn (F = 18.72, p < 0.001), Glu + Gln (F = 52.10, p < 0.001), Ser (F = 6.85, p = 0.015), Gly (F = 8.47, p = 0.008), Ala (F = 9.92, p = 0.005), Val (F = 14.33, p = 0.002), Ile (F = 7.66, p = 0.010), Leu (F = 11.54, p = 0.003), Tyr (F = 6.02, p = 0.020), Phe (F = 16.41, p = 0.001), His (F = 4.95, p = 0.035), and Lys (F = 21.77, p < 0.001).
Glu + Gln exhibited the most pronounced increase, rising from 1.50 ± 0.06 mg/100 mL in the control to 2.05 ± 0.08 mg/100 mL in T3, while Lys increased from 0.80 ± 0.04 to 1.08 ± 0.05 mg/100 mL. Duncan’s test indicated that T2 and T3 were generally grouped together and differed significantly from the control, with T1 showing intermediate values.
The fatty acid profile of goat milk kefir was partially affected by S. cumini supplementation (Table 4). Significant differences were observed for C4:0, C12:0, C14:0, C16:0, C18:0, C15:1n-9, C16:1n-7, C18:2n-6, and C18:2c9t11 (p < 0.05). In general, these fatty acids showed higher values in T2 and T3 compared with the control. For example, C16:0 increased from 1.40 ± 0.05 g/100 g in the control to 2.00 ± 0.06 g/100 g in T3, while C18:2n-6 increased from 0.35 ± 0.02 g/100 g to 0.48 ± 0.02 g/100 g. Similarly, C15:1n-9 and C18:2c9t11 increased progressively with extract concentration.
Fatty acid composition (g/100 g) in goat milk kefir enriched with different concentrations of Syzygium cumini extract.
| Treatment | C4:0 | C12:0 | C14:0 | C16:0 | C17:0 | C18:0 | C15:1n-9 | C16:1n-7 | C18:2n-6 | C20:4n-6 | C18:3n-3 | C18:2c9t11 | C18:2c10t12 |
|---|---|---|---|---|---|---|---|---|---|---|---|---|---|
| Control (0%) | 0.10 ± 0.01ᵃ | 0.18 ± 0.01ᵃ | 0.20 ± 0.01ᵃ | 1.40 ± 0.05ᵃ | 0.03 ± 0.01ᵃ | 0.55 ± 0.02ᵃ | 0.90 ± 0.03ᵃ | 0.10 ± 0.01ᵃ | 0.35 ± 0.02ᵃ | 0.05 ± 0.01ᵃ | 0.04 ± 0.01ᵃ | 0.18 ± 0.01ᵃ | 0.07 ± 0.01ᵃ |
| T1 (1%) | 0.12 ± 0.01ᵃᵇ | 0.20 ± 0.01ᵃᵇ | 0.22 ± 0.01ᵃᵇ | 1.30 ± 0.05ᵃ | 0.03 ± 0.01ᵃ | 0.50 ± 0.02ᵃ | 0.80 ± 0.03ᵃ | 0.12 ± 0.01ᵃ | 0.30 ± 0.02ᵃ | 0.04 ± 0.01ᵃ | 0.05 ± 0.01ᵃ | 0.15 ± 0.01ᵃ | 0.06 ± 0.01ᵃ |
| T2 (1.5%) | 0.14 ± 0.01ᵇ | 0.23 ± 0.01ᵇ | 0.25 ± 0.01ᵇ | 1.90 ± 0.06ᵇ | 0.04 ± 0.01ᵃ | 0.65 ± 0.03ᵇ | 1.10 ± 0.04ᵇ | 0.14 ± 0.01ᵇ | 0.45 ± 0.02ᵇ | 0.06 ± 0.01ᵃ | 0.06 ± 0.01ᵃ | 0.22 ± 0.01ᵇ | 0.08 ± 0.01ᵃ |
| T3 (2%) | 0.15 ± 0.01ᵇ | 0.24 ± 0.01ᵇ | 0.27 ± 0.01ᵇ | 2.00 ± 0.06ᵇ | 0.04 ± 0.01ᵃ | 0.70 ± 0.03ᵇ | 1.15 ± 0.04ᵇ | 0.15 ± 0.01ᵇ | 0.48 ± 0.02ᵇ | 0.06 ± 0.01ᵃ | 0.06 ± 0.01ᵃ | 0.25 ± 0.01ᵇ | 0.09 ± 0.01ᵃ |
Notes: Values are expressed as mean ± standard deviation (n = 3). Means within the same column followed by different lowercase letters are significantly different according to Duncan’s Multiple Range Test at p < 0.05. One-way ANOVA showed significant treatment effects for C4:0 (F = 12.84, p = 0.0030), C12:0 (F = 16.27, p = 0.0012), C14:0 (F = 14.95, p = 0.0018), C16:0 (F = 74.36, p < 0.001), C18:0 (F = 18.41, p = 0.0009), C15:1n-9 (F = 32.58, p < 0.001), C16:1n-7 (F = 10.73, p = 0.0048), C18:2n-6 (F = 28.94, p < 0.001), and C18:2c9t11 (F = 26.47, p < 0.001), but not for C17:0 (F = 1.92, p = 0.2054), C20:4n-6 (F = 2.14, p = 0.1836), C18:3n-3 (F = 3.02, p = 0.0917), or C18:2c10t12 (F = 1.76, p = 0.2391).
In contrast, C17:0, C20:4n-6, C18:3n-3, and C18:2c10t12 were not significantly affected by treatment (p > 0.05), despite slight numerical variation. Overall, the most consistent changes were observed in saturated fatty acids (C4:0, C12:0, C14:0, C16:0) and selected unsaturated fatty acids, particularly C18:2n-6 and C18:2c9t11.
Microstructural observations revealed differences in the distribution and density of the kefir matrix with increasing S. cumini concentration (Figure 1). The control sample (Figure 1a) showed a relatively uniform but less compact structure, with a more dispersed distribution of fluorescent signals, indicating a less dense network.
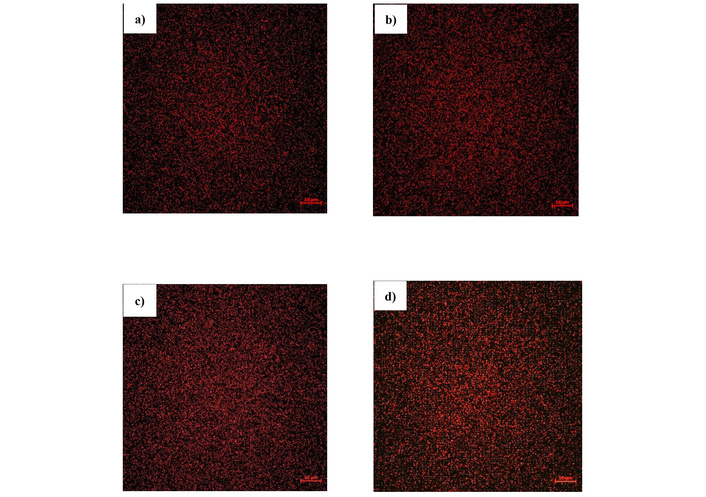
Microstructure of goat milk kefir with varying Syzygium cumini concentrations. a) Control (0%); b) T1 (1%); c) T2 (1.5%); d) T3 (2%).
In contrast, samples supplemented with S. cumini extract (Figure 1b–d) exhibited progressively denser and more homogeneous structures. The increase in brightness and signal intensity in T2 (Figure 1c) and T3 (Figure 1d) suggests a higher concentration and closer packing of structural components within the matrix. This enhancement in contrast may reflect differences in material composition and local density, as regions with higher signal intensity typically correspond to areas with greater structural accumulation. From a morphological perspective, the control sample displayed a more open network with higher apparent porosity, whereas supplemented treatments showed reduced pore spaces and a more continuous matrix. The distribution of microstructural elements became more uniform with increasing extract concentration, indicating improved structural homogeneity. No distinct layered structures were observed; however, subtle variations in texture suggest differences in the organization of the matrix. All images were obtained at the same magnification (scale bar: 10 µm), allowing direct comparison of structural features. Overall, the microstructural changes indicate a shift toward a more compact and less porous matrix in the supplemented kefir samples.
The PCA was conducted to assess the multivariate relationships among the physicochemical, microbiological, and biochemical variables measured in goat milk kefir enriched with S. cumini extract (Figure 2a). The scree plot demonstrated that the first two principal components accounted for the majority of the total variance, with PC1 explaining 86.0% and PC2 9.7%. This result indicates that the two-dimensional PCA model provided an adequate summary of the dataset.
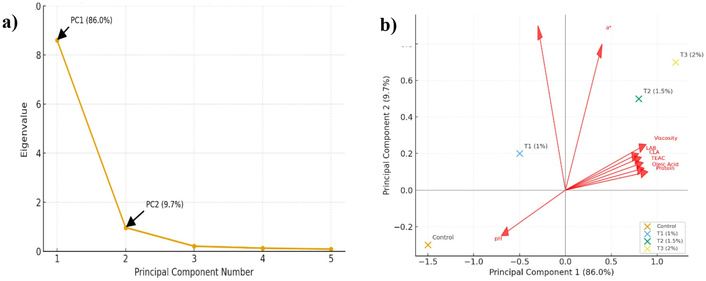
Principal component analysis (PCA) of goat milk kefir enriched with different concentrations of Syzygium cumini extract. (a) Scree plot showing eigenvalue distribution and cumulative variance; (b) PCA biplot illustrating sample clustering and variable correlations across treatments.
The PCA biplot revealed a clear distribution of treatments according to extract concentration (Figure 2b). The control sample was positioned on the negative side of PC1, while T2 and T3 were located on the positive side, indicating a distinct separation from the control. T1 occupied an intermediate position, reflecting a transitional profile between the control and higher supplementation levels. This distribution demonstrates that increasing S. cumini concentration was associated with a progressive shift in kefir’s overall characteristics.
Most measured variables, such as protein, TEAC, lactic acid, viscosity, and LAB, as well as several amino acid and fatty acid variables, were positively loaded on PC1. In contrast, pH was negatively associated with PC1 and positioned opposite these variables. The proximity of T2 and T3 to the positively loaded variables indicates that these treatments exhibited higher values for these attributes, whereas the control showed lower values and a higher pH. Overall, PCA revealed concentration-dependent differentiation among kefir samples and showed that the 1.5% and 2% treatments shared a more similar multivariate profile than the control and T1.
S. cumini fruit extract showed a compositional profile typical of tropical fruits, with high moisture content as the dominant fraction, which may influence texture, shelf life, and suitability for fermentation. Its low lipid content and moderate protein level suggest that the extract serves mainly as a carbohydrate-rich substrate, potentially supporting microbial growth during kefir fermentation. The total soluble solids value further indicates the presence of fermentable sugars required for microbial metabolism. The acidic pH (4.10) and titratable acidity reflect the fruit’s natural organic acid composition and may contribute to fermentation stability. The total phenolic content (149 ± 2 mg GAE/100 g extract) confirms the presence of bioactive compounds, although at lower levels than those reported for other fractions such as seeds or peels [25, 27]. This is consistent with the relatively high EC50 value, indicating moderate antioxidant capacity. Overall, the extract may serve as a natural bioactive ingredient, although specific phenolic contributions remain unclear.
The present study showed that S. cumini extract significantly affected selected physicochemical properties of goat milk kefir, particularly protein content and colour attributes (Table 1). The increase in protein content in T2 and T3 suggests that supplementation modified the compositional characteristics of the kefir matrix. This increase may be related to the contribution of soluble solids from the extract and to possible interactions between milk proteins and phenolic compounds during fermentation. In dairy systems, such interactions may alter matrix organisation and protein distribution, although the present study did not directly evaluate binding processes [34]. Therefore, this explanation should be regarded as a plausible interpretation rather than a confirmed mechanism.
Color parameters (L*, a*, and b*) were also strongly influenced by treatment, indicating that S. cumini extract markedly altered the visual properties of kefir. This effect is consistent with the natural pigmentation of S. cumini, which is rich in anthocyanin-containing phenolic compounds [35, 36]. The observed changes in colour values therefore, likely reflect incorporation of these pigments into the fermented dairy matrix. By contrast, fat content, pH, and viscosity were not significantly affected, despite numerical variation among treatments. This indicates that S. cumini supplementation did not consistently affect these parameters under the conditions tested. Although viscosity tended to increase at higher extract concentrations, particularly in T3, the lack of statistical significance suggests that this trend should be interpreted cautiously. Similarly, the numerical decrease in pH with increasing supplementation does not support a definitive conclusion regarding enhanced acidification or fermentation intensity. Overall, the results show that the main effects of S. cumini extract were observed in protein content and colour-related properties, while other physicochemical changes remained limited or variable.
The significant increase in TEAC values with more S. cumini supplementation shows that the extract enhanced goat milk kefir’s antioxidant capacity. This matches the known effects of S. cumini’s phenolic compounds, particularly its anthocyanin components, which enhance radical-scavenging activity [37]. The steady TEAC rise from the control to T3 shows a dose-dependent effect. The higher antioxidant capacity in the 1.5% and 2% treatments may come directly from added phenolic compounds in the extract or from changes during fermentation. In fermented dairy systems, plant phenolics can be modified by microbes or their interaction with milk [38]. These changes may alter their stability and antioxidant activity. The dairy matrix may also affect the extent of antioxidant activity retained or expressed by influencing the accessibility of the compounds [39]. Still, this study did not characterize individual phenolic compounds or identify specific antioxidant metabolites after fermentation. S. cumini supplementation improved the antioxidant potential of goat milk kefir. The biochemical basis should be clarified in future studies.
The microbiological results indicate that S. cumini supplementation supported the growth of kefir-associated microorganisms, particularly LAB. The significant increase in LAB counts from the control to T3 suggests that the extract did not inhibit the bacterial population and may have provided conditions favorable for bacterial maintenance during fermentation. This response may be related to the presence of fermentable components or bioactive compounds in the extract that were compatible with the kefir microbiota. In fermented dairy systems, LAB are essential for acid production, matrix development, and overall microbial stability; therefore, the higher LAB counts observed in the supplemented treatments may reflect an active fermentation environment [40]. Yeast and mold counts also showed significant overall differences, although post hoc analysis indicated that the supplemented treatments did not differ significantly from one another. This pattern suggests that the main distinction was between the control and the extract-containing kefirs, while increasing the extract concentration beyond 1% did not yield a clearer separation among the supplemented groups. Because yeasts are important members of the kefir consortium and contribute to carbon dioxide, ethanol, and flavor-related metabolite production, their maintenance at relatively high levels indicates that the symbiotic microbial balance of kefir was preserved [41]. Taken together, these findings suggest that S. cumini extract was microbiologically compatible with goat milk kefir fermentation and may have contributed to a more favorable environment for microbial persistence. However, since the present study did not directly evaluate microbial metabolism or substrate utilization, the mechanisms underlying these changes remain to be clarified.
S. cumini supplementation changed the amino acid profile of goat milk kefir (Table 3). Both non-essential and essential amino acids increased, raising free amino acid availability in the matrix. This likely results from fermentation. The kefir microbiota breaks down milk proteins into peptides and free amino acids [42]. As extract levels rise, amino acid concentrations increase—especially Glu + Gln and Lys—indicating that the fermentation environment is changing. Glutamic acid and glutamine are key to protein metabolism and flavor. Lysine is vital for nutrition [43]. Higher levels in T2 and T3 suggest supplementation ≥ 1.5% causes greater biochemical changes. T1 showed intermediate values, pointing to a gradual response. In fermented dairy products, amino acid changes result from interactions between microbes and matrix components [44]. Plant compounds in S. cumini extract likely affect microbial metabolism or substrate availability, and thus protein breakdown [45]. Since we did not directly measure proteolysis or enzymes, this interpretation is inferential. S. cumini supplementation increased free amino acids, likely improving kefir's nutritional profile. Further studies should clarify the roles of microbial proteolysis and phenolic-milk protein interactions during fermentation.
The observed changes in the fatty acid profile (Table 4) indicate that S. cumini selectively influenced specific fatty acids in goat milk kefir, rather than all lipids equally. For example, significant increases were noted in certain saturated fatty acids (C4:0, C12:0, C14:0, C16:0, C18:0) and select unsaturated fatty acids (C15:1n-9, C16:1n-7, C18:2n-6, C18:2c9t11), supporting that only these particular fatty acids, and not the broader lipid composition, were affected during fermentation. The increase in fatty acids such as C16:0 and C18:2n-6, and the progressive rise in C15:1n-9 and C18:2c9t11 (a Conjugated Linoleic Acid (CLA)-related fraction), may be linked to changes in lipid metabolism within the kefir matrix. Microbial activity in fermented dairy systems, such as lipolysis and fatty acid transformation, can influence fatty acid composition [46]. The higher values observed in T2 and T3 may reflect a shift in the balance between lipid hydrolysis and microbial utilization. The presence of plant-derived compounds in S. cumini extract may have contributed to these changes [47]. However, supplementation did not affect all fatty acids equally. Specifically, no significant differences were observed in C17:0, C20:4n-6, C18:3n-3, and C18:2c10t12, indicating they are unaffected. This pattern indicates that S. cumini extract selectively influenced only certain lipid fractions, leaving others—such as those listed—unchanged. This supports the notion of targeted, rather than broad, alterations during fermentation. It is also important to note that the present study did not directly assess lipolytic activity or enzymatic mechanisms. The changes in fatty acid composition may be related to microbial metabolism and matrix interactions, but these explanations remain interpretative. Overall, the results indicate that S. cumini supplementation influenced certain fatty acids, especially at higher extract concentrations. Others remained relatively stable.
S. cumini supplementation changed the kefir matrix microstructure. The control sample had a more open, less compact structure. In contrast, the supplemented treatments, especially T2 and T3, formed a denser, more homogeneous network [48]. Adding S. cumini extract changed the matrix arrangement during fermentation. However, because this study did not directly measure molecular-level interactions, these interpretations should be considered tentative and speculative rather than definitive conclusions. The supplemented samples show a more uniform distribution of microstructural elements, indicating improved matrix homogeneity compared with the control [33]. This matches the numerical viscosity trends. However, these differences were not statistically significant. While the microstructural data show a shift toward a more compact network, interpret the implications for rheological properties with caution [48]. The images were obtained under consistent magnification, enabling direct comparison of structural features across treatments. The lack of distinct layered structures indicates that the observed differences result mainly from changes in density and spatial distribution, rather than from the formation of new structural phases [49]. Overall, the microstructural analysis supports the conclusion that S. cumini supplementation was associated with a more compact and homogeneous kefir matrix at higher concentrations [33]. Nevertheless, further studies are needed to directly assess the mechanisms underlying these changes. These mechanisms may include protein–polyphenol interactions and their impact on gel formation [50].
PCA results provide an overview of the relationships among variables and the distribution of treatments. These findings should be regarded as exploratory rather than confirmatory. Principal component 1 (PC1) accounts for 86.0% of the variance, indicating that most variability follows a common pattern across treatments. Principal component 2 (PC2) contributes an additional 9.7%. The control group is separated from T2 and T3 along PC1, suggesting that S. cumini supplementation resulted in coordinated changes in the measured parameters. Protein, TEAC, viscosity, lactic acid, and LAB are associated with T2 and T3, which exhibit higher values for these attributes. In contrast, pH is positioned on the opposite side, indicating an inverse relationship [50]. This observation is consistent with earlier results, in which higher protein content and antioxidant capacity corresponded to lower pH. However, PCA does not establish causality or identify optimal treatments. The grouping of T2 and T3 indicates profile similarity but does not define an ideal formulation. Furthermore, the observed associations among variables reflect statistical co-variation rather than direct mechanistic relationships. In summary, the PCA demonstrates that S. cumini supplementation altered several attributes of goat milk kefir, particularly at higher concentrations. These findings also underscore the importance of cautious interpretation of multivariate patterns.
All of these results demonstrate that adding S. cumini extract to goat milk kefir promotes a variety of biochemical, structural, and microbiological improvements, demonstrating its potential as an excellent functional dairy formulation. S. cumini extract-enriched kefir is an example of how ancient fermentation methods can be combined with contemporary functional food innovation by promoting microbial metabolism, strengthening protein and lipid matrix, and optimizing compositional features through sophisticated statistical modeling.
The present study showed that S. cumini extract modified several physicochemical, microbiological, and biochemical properties of goat milk kefir. Supplementation significantly increased protein content, antioxidant capacity, and color parameters, while fat content, pH, and viscosity were not significantly affected. LAB and yeast/mold counts were significantly influenced by treatment, indicating that the extract was compatible with kefir fermentation. In addition, the amino acid profile and several individual fatty acids were significantly altered, particularly in the 1.5% and 2% treatments. Microstructural observations further indicated a denser and more homogeneous matrix in the supplemented kefir samples, and PCA revealed clear treatment-related differentiation, with T2 and T3 showing similar multivariate profiles. Overall, these findings suggest that S. cumini extract may serve as a promising natural ingredient for modifying the functional characteristics of goat milk kefir. However, further studies are needed to characterize individual phenolic compounds, clarify the underlying mechanisms, and evaluate sensory properties and shelf-life.
FAME: fatty acid methyl esters
FITC: fluorescein Isothiocyanate
LAB: lactic acid bacteria
PCA: principal component analysis
ABR: Conceptualization, Writing—original draft, Writing—review & editing, Investigation, Supervision. ML: Investigation, Validation, Writing—review & editing. LH and NJ: Investigation. AM and PPR: Writing—review & editing. All authors read and approved the submitted version.
The authors declare that they have no conflict of interest in financial, personal, or other relationships with other people, laboratories, or organizations.
Not applicable.
Not applicable.
Not applicable.
The raw data supporting the conclusions of this manuscript will be made available by the authors, without undue reservation, to any qualified researcher.
Funding by the Institute for Research and Community Service, Universitas Negeri Gorontalo, Indonesia through the Faculty of Agriculture – Associate Professor (Lektor Kepala) Research Grant No. [773/UN47.B6/PT.01.03/2025]. The funders had no role in study design, data collection and analysis, decision to publish, or preparation of the manuscript.
© The Author(s) 2026.
Open Exploration maintains a neutral stance on jurisdictional claims in published institutional affiliations and maps. All opinions expressed in this article are the personal views of the author(s) and do not represent the stance of the editorial team or the publisher.
Copyright: © The Author(s) 2026. This is an Open Access article licensed under a Creative Commons Attribution 4.0 International License (https://creativecommons.org/licenses/by/4.0/), which permits unrestricted use, sharing, adaptation, distribution and reproduction in any medium or format, for any purpose, even commercially, as long as you give appropriate credit to the original author(s) and the source, provide a link to the Creative Commons license, and indicate if changes were made.

View: 424
Download: 19
Times Cited: 0
