 Original Article

Affiliation:
1Departamento de Ciencias Químico-Biológicas, Instituto de Ciencias Biomédicas, Universidad Autónoma de Ciudad Juárez, Ciudad Juárez C.P. 32300, Chihuahua, México
2Secretaria de Ciencia y Tecnología (SECIHTI), Ciudad de México C.P. 03940, México
ORCID: https://orcid.org/0000-0002-7349-8335
Affiliation:
1Departamento de Ciencias Químico-Biológicas, Instituto de Ciencias Biomédicas, Universidad Autónoma de Ciudad Juárez, Ciudad Juárez C.P. 32300, Chihuahua, México
ORCID: https://orcid.org/0000-0003-2685-0049
Affiliation:
1Departamento de Ciencias Químico-Biológicas, Instituto de Ciencias Biomédicas, Universidad Autónoma de Ciudad Juárez, Ciudad Juárez C.P. 32300, Chihuahua, México
ORCID: https://orcid.org/0009-0006-1243-1328
Affiliation:
1Departamento de Ciencias Químico-Biológicas, Instituto de Ciencias Biomédicas, Universidad Autónoma de Ciudad Juárez, Ciudad Juárez C.P. 32300, Chihuahua, México
Affiliation:
1Departamento de Ciencias Químico-Biológicas, Instituto de Ciencias Biomédicas, Universidad Autónoma de Ciudad Juárez, Ciudad Juárez C.P. 32300, Chihuahua, México
Affiliation:
1Departamento de Ciencias Químico-Biológicas, Instituto de Ciencias Biomédicas, Universidad Autónoma de Ciudad Juárez, Ciudad Juárez C.P. 32300, Chihuahua, México
ORCID: https://orcid.org/0000-0002-6447-9861
Affiliation:
1Departamento de Ciencias Químico-Biológicas, Instituto de Ciencias Biomédicas, Universidad Autónoma de Ciudad Juárez, Ciudad Juárez C.P. 32300, Chihuahua, México
Email: ealvarez@uacj.mx
ORCID: https://orcid.org/0000-0002-6162-8139
Explor Foods Foodomics. 2026;4:1010172 DOI: https://doi.org/10.37349/eff.2026.1010172
Received: November 23, 2025 Accepted: May 10, 2026 Published: June 26, 2026
Academic Editor: José S Câmara, University of Madeira, Portugal
Aim: Grape pomace is the main byproduct of the winemaking process and an important source of bioactive compounds, including phenolic compounds and dietary fiber, making it a viable option for developing new functional foods. This study aimed to develop a muffin partially substituted with grape pomace that would be accepted by regular consumers and to determine the bioaccessibility of the incorporated phenolic compounds and the effect of dietary fiber on the apparent glycemic index.
Methods: Two substitutions with grape pomace (15% and 20%) were formulated and subjected to a consumer acceptance test. Macronutrient composition and phenolic compound content were characterized using spectrophotometry and mass spectrometry. Bioaccessibility and apparent glycemic index were determined using an in vitro digestion model.
Results: The results showed an increase in dietary fiber content with the incorporation of grape pomace. In contrast, the total phenolic content increased, accompanied by a corresponding increase in ferulic acid and naringenin content. Bioaccessibility increased during the small intestine stage in samples partially substituted with grape pomace. However, this trend changed during the large intestinal stage. The apparent glycemic index in the enriched muffin (25%) was lower than that in the control (26%), indicating that the release of reducing sugars was lower in the enriched muffin.
Conclusions: The addition of grape pomace increased fiber content; however, fiber reduced the bioaccessibility of phenolic compounds. Further studies are needed to explore the effect of dietary fiber on bioaccessibility and to conduct clinical trials to assess the bioavailability of phenolic compounds.
Grape pomace is the main byproduct of the wine industry and consists of skin, seeds, and small stems. It is estimated that grape pomace accounts for 38–53% of the dry matter [1]. According to the International Organisation of Vine and Wine (OIV) [2], wine and grape juice production has increased in recent years. In 2025, wine production and consumption were estimated to be 232 and 229 MhL, respectively [2, 3]. Consequently, the generation of grape pomace has also increased. Various strategies have been established to promote the use of grape pomace in different agro-industrial activities, such as the production of fertilizers [4], livestock feed [5], and oil from seeds [6]. However, these strategies have not proven to be useful because they are not economically profitable and continue to have a negative impact on the environment [1, 7]. To follow the guidelines of the circular economy, strategies have been established to decrease food losses, achieve zero waste, and reduce the generation of byproducts to lower the carbon footprint and improve the efficiency of the food sector [8]. In this context, grape pomace has proven to be an important source of bioactive compounds, such as phenolic compounds and dietary fiber, for the development of new functional foods that support the circular economy and benefit consumer health [9].
To develop a new functional food, it is important to consider different factors. It is necessary to determine the amount of grape pomace that can be incorporated into new foods to increase the content of phenolic compounds and dietary fiber while ensuring consumer acceptance. An important observation is that well-informed consumers are open to consuming foods enriched with grape pomace, as they perceive them as helping to reduce environmental impact and as products with health benefits [9]. Finally, according to various international regulations, functional foods must substantiate their claims with evidence from human interventions. Nevertheless, the development of new analytical technologies (e.g., mass spectrometry) and computational software (e.g., specialized libraries) that enable the study of the behavior of bioactive molecules under in vitro or in vivo conditions has been at the forefront of creating new functional foods [10].
The use of grape pomace to develop functional foods has been investigated in recent years. This is evidenced by the development of various foods, such as bakery products, including wheat bread [11], breadsticks [12], cakes [13], and pasta [14]. In the development of these products, different aspects have been studied, ranging from techno-functional properties [15] to modifications in their macronutrient and micronutrient profiles and sensory characteristics [16]. Previous studies have investigated the effect of adding grape pomace to bakery products on the bioaccessibility of phenolic compounds and the apparent glycemic index. However, the challenge in developing functional foods remains the need to balance consumer acceptance of new products with enrichment that increases the content of bioactive compounds, such as dietary fiber and phenolic compounds, which could have a beneficial effect on consumers. Therefore, the objective of this study was to formulate a muffin partially substituted with grape pomace flour that would be accepted by regular consumers and to determine the bioaccessibility of phenolic compounds and their effects on the apparent glycemic index.
Reagents for the in vitro digestion method: potassium chloride, potassium thiocyanate, potassium phosphate, sodium bicarbonate, sodium chloride, magnesium chloride hexahydrate, calcium chloride, mucin type II, α-amylase, lysozyme, urea, ammonium chloride, glucuronic acid, glucosamine, galactose, bovine serum albumin, pepsin, mucin type III, pancreatin, sodium phosphate and bile salts were analytical grade and purshed from Merck®. The solvents hexane, methanol, acetone, hydrochloric acid, and acetic acid were analytical grade (J.T, Baker®, USA). The sodium hydroxide, sodium carbonate, Folin-Ciocalteu reagent 2 N, gallic acid, sodium nitrite, aluminum chloride, catechin, p-dimethylaminocinnamaldehyde (DMAC), 2,4,6-tris(2-pyridyl)-s-triazine (TPTZ), iron chloride, sodium acetate, Trolox, 2,2-dyphenyl-1-pycrylhydrazyl (DPPH), 2,2’-azino-bis(3-ethylbenzothiazoline-6-sulfonic acid) (ABTS), potassium persulfate, glucose, sodium-potassium tartrate, and 3,5-dinitrosalicylic acid were analytical grade (Merck®, USA). The acetonitrile and methanol were HPLC/mass spectrometry grade (Tedia®, USA). Phenolic compound standards: gallic acid, syringic acid, protocatechuic acid, caffeic acid, chlorogenic acid, naringenin, epicatechin, catechin, hesperetin, resveratrol, quercetin, rutin, ellagic acid, myricetin, kaempferol, luteolin, isorhamnetin, epigallocatechin, gallocatchin, gallocatechin gallate, epicatchin gallate, procyanidin A1, procyanidin A2, procyanidin B1, procyanidin B2, procyanidin C1, and corilagin were HPLC grade (purity ≥ 98%, Merck®, USA).
Grape pomace from Cabernet Sauvignon (Vitis vinifera L.) was collected in 2018 after fermentation. Grupo Alximia S.A. de C.V. kindly donated the grape pomace used in the study (Valle de Guadalupe, Baja California, Mexico). Grape pomace samples were stored at –20°C in vacuum bags and transported to Universidad Autónoma de Ciudad Juárez under controlled temperature conditions. Once in the laboratory, the samples were dried at 55°C (Isotemp oven, Fisher Scientific®, USA) until reaching a constant weight, yielding a final moisture content of 3.8 ± 0.07% in the grape pomace. Dried grape pomace was ground (CS-2000, Cosuai®, China), sieved to a particle size of 420 mm, and stored in vacuum bags until use (grape pomace flour). Grape pomace flour was stored at 25°C in the absence of light.
All ingredients used for muffin preparation were food-grade and purchased from local markets in Ciudad Juárez, Mexico. The control muffin (CM) was prepared according to the methodology described by Serna-Saldivar et al. [17], with slight modifications. Two types of muffins partially substituted with 15% and 20% grape pomace flour were prepared. The ingredients used for each muffin are listed in Table S1. Briefly, sodium bicarbonate, salt, baking powder, sugar, and eggs were mixed until the sugar was dissolved. In another recipient, cocoa, milk powder, wheat flour, and butter were mixed. Both mixtures were blended and beaten until a homogeneous mixture was obtained. Grape pomace was added to the partially substituted muffin samples in this step. For baking, 60 g of batter was placed in a muffin pan and baked for 15 min (Cupcake Maker, Sunbeam®, USA) at 200°C. After baking, the samples were cooled to room temperature.
To determine the maximum level of grape pomace enrichment in muffin samples, a preliminary consumer acceptance test (20 participants) was conducted using formulations containing 10%, 15%, 20%, and 25% grape pomace substitution. The percentages were selected to increase the total phenolic and dietary fiber content of the samples. The preliminary test revealed that 15% and 20% had the highest levels of acceptance. To determine the consumers’ acceptance, the muffin samples (control and partially substituted samples at 15% and 20%) were evaluated in a consumer acceptance test by 119 healthy participants (22.4 ± 3.3 years, 59.6% females, 40.4% males) who normally consume muffins. This protocol was approved by the Institutional Committee of Ethics and Bioethics of the Universidad Autónoma de Ciudad Juárez (CIEB-2019-1-051) and was conducted in compliance with the “Declaration of Helsinki”. The test was performed using a 9-point hedonic scale ranging from “Like Extremely” to “Dislike Extremely”. For statistical purposes, the categories were treated as numeric values, with 1 for “Dislike Extremely” and 9 for “Like Extremely,” as previously proposed [18, 19]. Before the test, each participant was informed about the ingredients of each muffin sample and asked about any allergies or intolerances (including sulfites) they might have to those ingredients. The test protocol was explained, and the participants provided informed consent by signing an informed consent letter. Each sample was evaluated individually. The participants were provided with three 4 g muffin samples (control, 15%, and 20% substitution) at room temperature. Each sample was placed in a plastic cup (2 oz) and labeled with a three-digit random number. The samples were presented monadically to each participant in a random, balanced, and counterbalanced manner. Participants rinsed their mouths with purified water (Alaska®, Mexico) before and between samples. The participants tested each sample and used a 9-point hedonic scale to indicate how much they liked each sample [20]. From these consumer acceptance tests, one enriched sample (15%) was selected for further analysis.
After baking, the control and enriched samples were placed on a cookie rack, cooled to room temperature for 1 h, ground in a food processor (NB-101S, NutriBullet®, USA), and stored at 4°C until analysis. The proximate composition, including moisture, ash, protein, fat, total carbohydrates, and total dietary fiber content, was determined according to the AOAC methods [21]. Analysis was carried out in triplicate. The moisture content (925.10) was determined using the oven method (1324, VWR®, USA) at 105°C for 8 h. Ash (923.03) was determined in a muffle furnace (FE‐340, Felisa®, Mexico) at 550°C for 5 h. The crude protein content (920.87) was determined by the Kjeldahl method (RapidStill II, Labconco®, USA) using a nitrogen-to-protein conversion factor of 5.70 for muffins, as reported in previous studies [22–26], which used this factor for cereal-based food products. Moreover, other protein factors, such as 6.25 or 6.40, which are commonly used, can overestimate protein content in samples, primarily because the Kjeldahl method cannot distinguish between other nitrogen sources [24]. The fat content (935.38) was determined using the Soxhlet method (2043, Soxtec™ Foss™, Denmark). The total carbohydrate content was determined by difference. The total dietary fiber (985.29) was determined by an enzymatic gravimetric kit (TDF-100A-1KT, Merck®, USA). The pH value was determined by the potentiometric method (AB15 Plus, Accumet®, USA). Titratable acidity was determined according to the method described by Sanz-Penella et al. [27] with slight modifications. Briefly, 10 g of the sample was dissolved in 90 mL of degassed water and homogenized. The solution was kept under agitation, and an electrode was introduced. Once the pH was recorded, the sample was titrated with standardized 0.1 N NaOH until a pH of 8.5 was reached. The results were expressed as milliliters of 0.1 N NaOH. The muffin energy (calorie) value was calculated according to the Official Mexican Standard [28], where carbohydrates provide 4 kcal/g, proteins 4 kcal/g, and fat 9 kcal/g. The color was measured using a colorimeter (CR 400, Konica Minolta®, USA). Ten measurements were obtained from the muffin crust and crumbs. The L* (lightness), a* (– a* green, + a* red), and b* (– b* blue, + b* yellow) values were recorded. The color change was determined by the following equation:
where L0, a0, and b0 are the values obtained from the control muffin. L, a, and b are the values obtained from the partially substituted muffin with grape pomace.
Freshly baked samples were placed on a cookie rack, cooled at room temperature for 1 h, ground, and frozen at –40°C, then lyophilized (Freezone 6, Labconco®, USA) for 72 h. Samples were powdered and sieved to a particle size of 420 mm. The samples were defatted with hexane at a of 1:10 (w/v) ratio using ultrasound-assisted extraction for 10 min at 25°C and a frequency of 40 kHz (B5000, Branson®, USA), as proposed by Muñoz-Bernal et al. [29].
Phenolic compounds were extracted from the samples using ultrasound-assisted extraction, as described by Muñoz-Bernal et al. [29]. To obtain soluble extracted phenolic compounds, 2 g of the sample was mixed with 50 mL of 80% methanol acidified with 0.2% HCl (v/v), sonicated (B5000, Branson®, USA) for 30 min, and then centrifuged at 2,465 g for 15 min at 4°C (TX-400 rotor, Sorvall 16R, Thermo Scientific®, USA). The supernatant was collected and stored at 4°C, and methanolic extraction was repeated. Both supernatants were mixed and stored at 4°C. The obtained pellet was re-extracted with 70% acetone (v/v), sonicated, and centrifuged under the same conditions as previously described, and both supernatants obtained from acetone were mixed and stored at 4°C. Methanol and acetone from each extract were separately distilled at 45°C and 200 mbar (R-3, Büchi®, Switzerland), and the aqueous phases obtained after distillation were mixed, frozen at –40°C, and lyophilized to obtain a solid. The solid extract was stored in vacuum bags at –20°C in the dark until further analysis. This extract was named soluble phenolic extract.
Basic hydrolysis was performed to obtain non-extractable phenolic compounds. The pellet obtained after acetonic extraction was transferred to a boiling flask and mixed with 20 mL of 3 M NaOH. The mixture was refluxed for 4 h at 80°C with constant agitation. Finally, the pH was adjusted to 2 with 37% HCl, and the supernatant was obtained by centrifugation at 2,465 g for 15 min at 4°C. The supernatant was transferred to a decantation funnel and mixed with 10 mL of ethyl acetate to obtain the organic phase. The aqueous phase was extracted again using ethyl acetate. Both organic phases were combined and distilled at 45°C and 200 mbar. The obtained solid was then stored in vacuum bags at –20°C in the dark until further analysis (bound phenolic extract). The extraction process was performed in triplicate. For the posterior analysis, both solids were dissolved separately in 100% methanol at a final concentration of 2 mg/mL.
Total phenolic content was determined using the Folin-Ciocalteu method [30]. Briefly, 25 mL of the sample (2mg/mL in methanol 100%) or standard was mixed with 100 mL of Na2CO3 (7.5%, w/v) and 125 mL of Folin-Ciocalteu reagent (10% v/v). The reaction was incubated at 45°C for 15 min, and the absorbance was measured at 765 nm (xMark, Biorad®, USA). Gallic acid was used as a standard, and the results were expressed as milligram gallic acid equivalents per gram of fresh weight (mg GAE/g FW). Flavonoids were quantified by the aluminum complexation method [31]; 31 mL of the sample or standard was mixed with 125 mL of distilled water, 9.5 mL of NaNO2 (5% w/v), 9.5 mL of AlCl3 (10% w/v), and 125 mL of NaOH (0.5 M). The reaction mixture was incubated for 30 min at room temperature in the absence of light, and the absorbance was measured at 510 nm. Catechin was used as standard, and results were expressed as milligrams equivalents of catechin per gram of fresh weight (mg CE/g FW). Condensed tannins were determined by the p-dimethylaminocinnamaldehyde (DMAC) method [32]; 50 mL of the sample or standard was mixed with 250 mL of DMAC reagent (0.1% w/v in acidified methanol, 10% HCl v/v). The reaction mixture was incubated for 10 min at room temperature in the absence of light, and the absorbance was measured at 640 nm. Catechin was used as standard, and results were expressed as mg CE/g FW. All analyses were performed in triplicate. For the total phenolic, flavonoid, and condensed tannin contents in the samples, the fractions from soluble extracted phenols and non-extractable phenols were summed.
The FRAP, ABTS+, and DPPH* methods were used to determine the antioxidant activity of the samples. Briefly, to determine the antioxidant activity by the FRAP method [31], 24 mL of the sample or standard was mixed with 180 mL of FRAP reagent (TPTZ 10 mM, FeCl3·6H2O 20 mM, acetate buffer pH 3, in a ratio of 1:1:10 v/v/v). The reaction mixture was incubated at 37°C for 30 min, and the absorbance was measured at 595 nm. Trolox was used as a standard, and the results were expressed as millimoles equivalents of Trolox per gram of fresh weight (mmol TE/g FW). Antioxidant activity was determined using the DPPH* method [31] by mixing 25 mL of the sample or standard with 180 mL of DPPH* reagent (6 mM in pure methanol). The reaction mixture was incubated for 10 min at room temperature in the absence of light, and the absorbance was measured at 517 nm. Trolox was used as a standard, and the results were expressed as mmol TE/g FW. Antioxidant activity by the ABTS+ method [31] was performed by mixing 12 mL of the sample or standard with 285 mL ABTS+ reagent (45 mM in phosphate buffer 0.1 M, pH 4.5, previously oxidized with K2SO4 at room temperature in the absence of light for 16 h). The reaction mixture was incubated for 5 min at room temperature in the absence of light, and the absorbance was measured at 734 nm. Trolox was used as a standard, and the results were expressed as mmol TE/g FW. All analyses were performed in triplicate.
The phenolic profiles of the samples were determined using the method described by Muñoz-Bernal et al. [32]. The samples were dissolved in methanol: acetonitrile (50:50, v/v) to a final concentration of 4 mg/mL. The samples were filtered through a 0.45 mm nylon membrane (Titan 3, Thermo Scientific®, USA). Ultrahigh-performance liquid chromatography (UPLC) was used to analyze the samples (1290 Infinitum series, Agilent Technologies Inc., USA). The system was equipped with a quaternary pump with a built-in degasser, an autosampler with temperature control, and a column compartment with a thermostat. A reverse-phase C18 column (2.1 mm × 50 mm × 1.8 μm) (Zorbax®, Agilent Technologies, Inc., USA) was used to separate the compounds at 25°C. The mobile phase conditions were as follows: mobile phase A consisted of 0.1% formic acid in water, and mobile phase B was composed of 100% acetonitrile. The gradient conditions were as follows: 0–1 min, 10% B; 1–4 min, 30% B; 4–6 min, 38% B; and 6–8.5 min, 60% B; and 8.5–10 min, 10% B. The flow rate was set to 0.4 mL/min, and the sample volume injected was 3 µL. A mass spectrometer system (Agilent 6530 Accurate Mass Q-TOF-MS/MS, Agilent Technologies, Inc., USA) was equipped with an electrospray ionization source (ESI) operated in negative mode. Nitrogen was used as the drying gas at 340°C and 13 L/min, nebulizer gas pressure was 30 psi, capillary voltage was 4,000 V, fragmentor voltage was 175 V, skimmer voltage was 65 V, and mass-to-charge ratio (m/z) scan range was 100–1,100 for MS and 100–1,000 for MS/MS.
Phenolic compound identification in the samples was performed using Mass Hunter Qualitative version B.07.00 (Agilent Technologies Inc., USA), following the method described by Muñoz-Bernal et al. [33]. Briefly, each compound was identified using the retention time and mass spectrometry data. The Molecular Feature Extraction (MFE) tool was used to identify co-eluted compounds to obtain the isotopic distribution, high-resolution exact mass, and fragments (MS2). The retention time, exact mass (± 5 ppm), and fragments of each identified compound were compared with the Metlin database and an internal database for phenolic compounds using the Mass Hunter Personal Compound Database and Library (PCDL) (version B.07.00). Ion signals with an abundance higher than 10,000 counts and a score higher than 75% were positively identified, while those signals below 10,000 counts were considered as noise and with a score lower than 75% were not considered (unknowns).
The quantification of phenolic compounds was performed using external standard calibration curves derived from available standards, with peak areas extracted from the ion chromatogram. Range concentrations were from 0.0007 to 0.1 mg/mL (dissolved in methanol), all of which showed good linearity (R2 ≥ 0.99). The limit of detection (LOD) was three times the signal-to-noise ratio (S/N; S/N = 12,525.6), and the limit of quantitation was ten times the S/N, which were calculated for each standard compound. For compounds whose standard was unavailable, a calibration curve from structurally related compounds was used, and reported as equivalents of that standard, as described by Muñoz-Bernal et al. [33]. All samples were analyzed in triplicate, and results were expressed as μg/g FM.
To determine phenolic releasability during digestion, a static in vitro digestive model was developed following the method proposed by Kopf-Bolanz et al. [34], with slight modifications. For the oral phase, 300 mg of lyophilized ground sample was mixed with 2.25 microliters of distilled water, 3 microliters of synthetic saliva (Table S2), with 62.7 microliters of an enzymatic salivary mixture (Table S3). The mixture was incubated for 5 min at 37°C with shaking at 70 rpm (Dubnoff Shaker Bath, Precision®, USA). For the gastric phase, 6 microliters of synthetic gastric juice (Table S2) with 168.9 microliters of an enzymatic gastric mixture (Table S3) were added. The mixture was then incubated for 2 h at 37°C with shaking at 70 rpm. For the intestinal phase, 6 microliters of synthetic pancreatic juice, 3 microliters of synthetic bile juice (Table S2), with 564.9 microliter of an enzymatic pancreatic mixture and 624.4 microliter of an enzymatic bile mixture (Table S3) were added. The mixture was then incubated for 2 h at 37°C with shaking at 70 rpm. Finally, a simplified simulation of the colonic phase was carried out, for this, 10 microliters of phosphate buffer (0.1 M; pH 4.5) were added and 30 microliters of Viscozyme® L (V2010-50ML, Merck®, USA). The mixture was incubated for 16 h at 37°C with shaking at 100 rpm [35]. After each stage was completed, a 500 mL aliquot was taken for analysis. Total phenolic content and UHPLC-MS/MS were performed at each stage, according to previously described methods. To avoid overestimation of the total phenolic content, carbohydrates and organic acids were removed by reverse solid-phase extraction (SPE, C18) according to the method described by Muñoz-Bernal et al. [29]. The phenolic content in sugar-free samples was determined, and bioaccessibility was calculated using the following equation:
where PCf is the phenolic content after in vitro digestion and PCi is the phenolic content before in vitro digestion (sum of both extractable and non-extractable phenolic compounds).
To determine the glycemic index, the total reducing sugars were quantified using the 3,5-dinitrosalicylic acid (DNS) reagent, according to the method described by Teixeira et al. [36], with slight modifications. The reducing sugar content was determined at each stage of the in vitro digestion system. Briefly, 300 mL of the sample or standard was mixed with 600 mL of the DNS reagent. The reaction mixture was incubated at 100°C (FE-403, Felisa®, Mexico) and then cooled to room temperature. The absorbance was measured at 540 nm. Glucose was used as the standard, and the results were expressed as glucose equivalents per gram of fresh weight (mg GluE/g FW) [29]. The apparent glycemic index was calculated according to a previously described method by Subiria-Cueto et al. [37] and was determined using the following equation:
The data were analyzed using Levene’s test to assess variance equality and subsequently using the Student’s t-test. For the consumer acceptance test, the chi-square test comparison for two proportions was performed, and a one-way analysis of variance with Fisher’s least significant difference (LSD) test was performed. Differences were considered statistically significant at P < 0.05. All statistical analyses were performed using XLSTAT version 2024 software (Addinsoft®, France).
Two levels of enrichment with grape pomace and a control muffin were evaluated in a consumer acceptance test. The test was conducted with 119 habitual consumers of this type of bakery product. Of the total sample, 59.6% were women and 40.4% were men. The 9-point hedonic scale was divided into three acceptance regions: like, neutral, and dislike. In Figure 1a, it can be observed that the control muffin (CM), enriched muffin at 15% (M15), and 20% (M20) were rated in the like region (χ2 = 11.5, P < 0.05). Moreover, according to these results, CM and M15 were similar, whereas M20 differed from CM. In contrast, only 5% of participants evaluated enriched muffins (M15 and M20) in the dislike region (χ2 = 6.7, P < 0.05). The analysis by hedonic scale categories (Figure 1b) showed that CM was rated in the “Like very much” category, whereas M15 and M20 were in the “Like much” and “Like slightly” categories. Consumer acceptance decreased as the enrichment of grape pomace increased in the muffin samples.
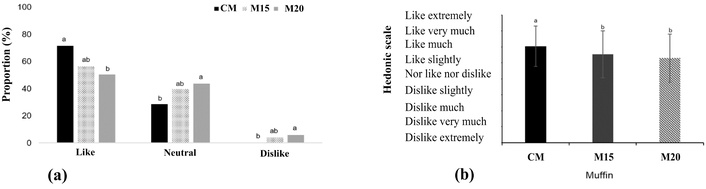
Consumer acceptance test of partially substituted muffins. CM: control muffin. M15: partially substituted muffin with 15% grape pomace. M20: partially substituted muffin at 20%. (a) Likeness region between the different muffin samples. (b) Hedonic scale region by category for each muffin sample. Different letters indicate significant differences (P < 0.05).
Based on the consumer acceptance test results, muffins enriched with 15% grape pomace (M15) were used for subsequent analysis. The physicochemical and phenolic contents of the CM and M15 samples were evaluated to determine the modifications induced by the inclusion of grape pomace. Table 1 presents the results for the CM and M15 samples.
Physicochemical and phenolic content characterization of the control muffin (CM) and enriched grape pomace muffin (M15).
| Parameters | CM | M15 |
|---|---|---|
| Energy content | 296.75 ± 0.98 | 296.78 ± 0.87 |
| Moisture (%) | 37.02 ± 0.15 | 37.29 ± 0.05* |
| Ash (%) | 1.71 ± 0.06 | 1.77 ± 0.02 |
| Lipids (%) | 10.34 ± 0.43 | 10.60 ± 0.19 |
| Proteins (%) | 5.88 ± 0.14 | 5.91 ± 0.21 |
| Total carbohydrates (%) | 45.06 ± 0.33* | 44.43 ± 0.13 |
| Dietary fiber (%) | 3.39 ± 0.13 | 5.71 ± 0.11* |
| pH | 8.12 ± 0.10* | 6.76 ± 0.06 |
| Titratable acidity (mL NaOH 0.1 N) | 0.53 ± 0.23 | 3.53 ± 0.11* |
| Crust color | ||
| L* | 34.60 ± 1.20* | 30.70 ± 0.80 |
| a* | 8.80 ± 0.30* | 6.70 ± 0.20 |
| b* | 17.70 ± 0.70* | 12.00 ± 0.70 |
| ΔE | - | 7.20 ± 0.30 |
| Crumb color | ||
| L* | 31.70 ± 1.10* | 30.80 ± 0.90 |
| a* | 8.70 ± 0.30* | 7.30 ± 0.20 |
| b* | 21.10 ± 1.00* | 16.60 ± 0.80 |
| ΔE | - | 4.80 ± 0.30 |
| Total phenolic content (mg GAE/g FW) | 2.13 ± 0.14 | 3.54 ± 0.28* |
| Flavonoids (mg CE/g FW) | 1.43 ± 0.12 | 2.32 ± 0.16* |
| Condensed tannins (mg CE/g FW) | 0.05 ± 0.01 | 0.26 ± 0.02* |
| Antioxidant activity | ||
| FRAP (mmol TE/g FW) | 7.70 ± 0.50 | 14.60 ± 1.51* |
| DPPH* (mmol TE/g FW) | 0.72 ± 0.04 | 2.32 ± 0.04* |
| ABTS+ (mmol TE/g FW) | 15.30 ± 1.16 | 22.30 ± 2.34* |
Values are expressed as the mean ± SD of three independent samples. CM: control muffin; M15: pomace muffin (15%). * Significant difference between samples (P < 0.05). GAE: gallic acid equivalent. CE: catechin equivalent. TE: trolox equivalent. FW: fresh weight. L*: brightness. a*: (+) red/(–) green coordinates. b*: (+) yellow/ (–) blue coordinates. ΔE: color difference. FRAP: ferric reducing antioxidant power. DPPH*: 2,2-diphenyl-1-picrylhydrazyl radical. ABTS+: 2,2’azino-bis(2-ethylbenzothiazoline-6-sulfonic acid) radical.
The total phenolic content, flavonoids, condensed tannins, and antioxidant capacity were modified by the addition of grape pomace (Table 1). Sample M15 showed an increase in these parameters compared to the CM sample. An increase in phenolic compounds has been previously reported in different bakery products, such as breadsticks, cakes, and muffins, following the addition of grape pomace [7, 8, 11]. To identify the phenolic compounds responsible for this increase in total content and antioxidant activity, the phenolic profiles of the samples were determined (Table 2). Spectral information regarding the phenolic compounds identified in the samples is shown in Table S4. Chromatograms obtained for the CM and M15 samples can be observed in Figure S1 and Figure S2.
Phenolic profiles of samples, control muffin (CM), and muffin enriched with grape pomace flour (M15).
| Compound | CM (mg/g FW) | M15 (mg/g FW) |
|---|---|---|
| Hydroxybenzoic acids and derivatives | ||
| Benzoic acida | 2.94 ± 0.03 | N.D. |
| Gallic acid | < L.O.Q. | < L.O.Q. |
| 3-O-Methylgallic acida | < L.O.Q. | 67.39 ± 1.01 |
| 4-O-Methylgallic acida | < L.O.Q. | < L.O.Q. |
| Pyrogallola | < L.O.Q. | < L.O.Q. |
| Protocatechuic acid | 5.36 ± 0.10 | 6.64 ± 0.49* |
| Protocatechuic aldehydeb | 15.86 ± 0.31 | 15.26 ± 0.34 |
| Pyrocatechuic acidb | N.D. | < L.O.Q. |
| Syringic acid | N.D. | 4.47 ± 0.16 |
| Vanillina | N.D. | 2.88 ± 0.02 |
| Hydroxycinnamic acids and derivatives | ||
| Caffeic acid | < L.O.Q. | < L.O.Q. |
| Ferulic acidc | 1.16 ± 0.02 | 2,031.59 ± 70.57* |
| Isoferulic acidc | < L.O.Q. | 1.01 ± 0.04 |
| m-Coumaric acid | < L.O.Q. | < L.O.Q. |
| p-Coumaric acidd | < L.O.Q. | < L.O.Q. |
| Flavonoids | ||
| Catechin | N.D. | < L.O.Q. |
| Eriodictyole | N.D. | < L.O.Q. |
| Esculetin | ID | ID |
| Hesperetin | 88.79 ± 0.11* | 82.83 ± 0.05 |
| Myricetin | N.D. | < L.O.Q. |
| Naringenin | < L.O.Q. | 217.89 ± 7.11 |
| Norathyriol | N.D. | ID |
| Taxifoline | N.D. | 11.19 ± 0.01 |
| Organic acids | ||
| Citric acid | ID | ID |
| Succinic acid | ID | ID |
The results are expressed as the mean of three independent samples ± standard deviation. * Significant differences between samples (P < 0.05). FW: fresh weight. L.O.Q: under the limit of quantification. N.D.: not detected. ID: compound identified by MS/MS spectral information. The letters indicate the compounds that were quantified by a structurally related compound [a gallic acid, b protocatechuic acid, c caffeic acid, d m-coumaric acid, e naringenin].
As shown in Table 2, the phenolic profile of the muffins was modified by the addition of grape pomace. The addition of grape pomace to muffins resulted in the incorporation of new phenolic compounds, including syringic acid, catechin, taxifolin, and eriodyctiol. In addition to modifying the phenolic profile, it increased the concentrations of compounds, such as protocatechuic acid, ferulic acid, and naringenin.
The bioaccessibility of phenolic compounds at different stages of the in vitro digestive system is presented in Figure 2. During the oral stage, the release of phenolic compounds was low. This behavior is normal because of the short amount of time the food remains in this stage (5 min); moreover, in this stage, α-amylase has little effect on phenolic compounds. During the gastric stage, a greater release of phenolic compounds was observed than during the oral stage. At this stage, there was a greater release from the M15 sample than from the CM. A similar trend was observed during the small intestinal stage, where M15 showed a greater release of phenolic compounds than CM. However, this behavior differs during the large-intestinal phase. At this stage, Viscozyme® L, which contains a mixture of different enzymes derived from Aspergillus spp. [35] that can be present in the microbiota, was used to simulate simplified colonic fermentation activity.
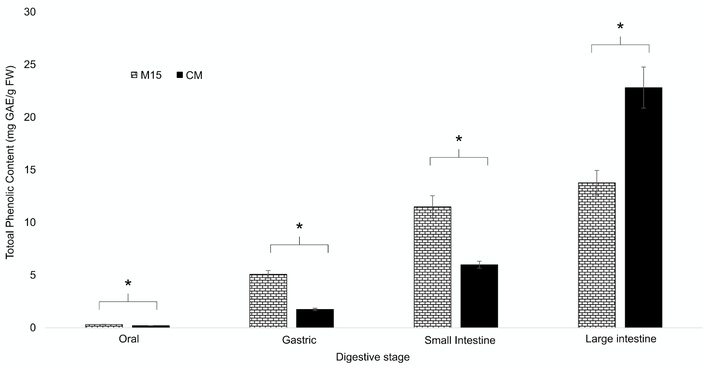
Bioaccessibility of phenolic compounds during each stage of in vitro digestion. The results are expressed as the mean ± SD of three independent experiments. GAE: gallic acid equivalent. FW: fresh weight. CM: control muffin. M15: partially substituted muffin with 15% grape pomace. * Significant differences between samples at each stage (P < 0.05).
The release of reducing sugars at each stage of the in vitro digestive system is shown in Figure 3.
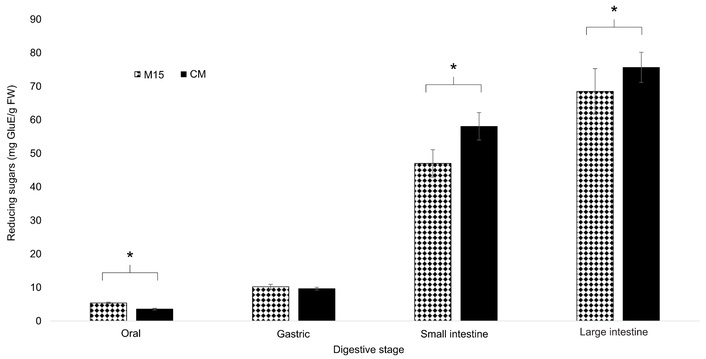
Reducing sugar release at each stage of the in vitro digestion system. The results are expressed as the mean ± SD of three independent experiments. GluE: glucose equivalents. FW: fresh weight. CM: control muffin. M15: partially substituted muffin with 15% grape pomace. * Significant differences between samples at each stage (P < 0.05).
The results showed a greater release of reducing sugars in the CM sample during the small and large intestinal stages. In contrast, the release of reducing sugars was low during the oral and gastric stages. This finding corresponds to the fact that the main action of the enzymes responsible for breaking down carbohydrates occurs during the small intestine stage [37].
Bakery products are considered staple foods worldwide and are characterized by their carbohydrate, protein, and mineral contents [38]. Nevertheless, bakery products have low phenolic and dietary fiber contents. This represents an opportunity to develop different bakery products using grape pomace as a functional ingredient, such as bread [29], breadsticks [12], and muffins [15]. Consumer acceptance is one of the main challenges in the development of novel foods. According to Baldissera et al. [39], several factors can influence the acceptance of novel foods, such as prior knowledge of the benefits of grape pomace, environmental concerns, and personal beliefs. However, the sensory characteristics of food should also be considered. For example, in breadsticks, the addition of grape pomace can modify organoleptic properties, such as acidity, astringency, and bitterness [12]. Figure 1a shows that as the percentage of enrichment increased, the samples decreased in the like region, and the dislike region increased. This result indicates that consumers preferred muffins with a lower enrichment of grape pomace. This behavior agrees with that of a study where two breadsticks enriched with 5% and 10% grape pomace were prepared, and both enrichments were found to be within the limits of acceptability. However, a decrease in acceptability was observed as the percentage of substitution increased, which was attributed to the increase in acidity, bitterness, and astringency perception by the consumers [12].
Another important factor affecting consumer acceptance is the particle size of grape pomace used in food formulations. In this study, the grape pomace used to prepare the M15 and M20 samples was sieved to a particle size of 420 µm, which may have improved consumer acceptance. This decision was based on a previous study, where particle sizes between 425 and 300 µm had less impact on bitterness and acidity than smaller particle sizes (212 and 100 µm) [40]. In a study conducted by Troilo et al. [40], muffins changed in terms of astringency, bitterness, and acidity, and their textural and odor characteristics were affected by the particle size used. However, in this study, the consumer acceptance test conducted using the 9-point hedonic scale did not allow for the determination of the strength of the effect of the addition of grape pomace on the sensory characteristics, such as texture, odor, and taste, of the CM, M15, and M20 samples. To assess the intensity of these changes, a descriptive sensory analysis with trained judges is necessary to evaluate changes in these attributes relative to the CM sample.
Based on the physicochemical composition of the samples, the energy values were similar for the CM and M15 samples. This behavior was also observed for the ash, lipids, and proteins. These results differ from those observed in cakes enriched with grape pomace, where the mineral, lipid, and protein contents increased linearly with increasing grape pomace content relative to the control cake [13]. The increase in ash content in bakery products is mainly related to the minerals present in the pomace, whereas lipids are contributed by the oil present in the grape pomace seeds. Finally, grape pomace is also a rich source of protein, more so than wheat flour [13, 40]. However, the contents of minerals, lipids, and proteins depend on agri-environmental factors, such as grape variety, growing conditions, and soil type. For example, the grape pomace used to prepare the muffins was from the Cabernet Sauvignon variety; in the study by Nakov et al. [13], the pomace used was from the Muscat Hamburg variety, and the muffins prepared by Troilo et al. [40] used grape pomace from the Primitivo variety.
In contrast, the moisture and total carbohydrate contents were modified by the addition of grape pomace (M15). The moisture content of M15 was higher than that of CM (P < 0.05). The moisture content of muffins has been previously determined, and different results have been reported. In some studies, it has been observed that in bakery products, such as cakes, the moisture content tends to increase [13]; this same effect has also been observed in muffins [40]. In another study, muffins enriched with 5% grape pomace of the Malbec variety showed an increase compared to the control [16]. This increase in moisture content can be attributed to the introduction of dietary fiber into the enriched muffins, as fiber has a higher water-binding capacity [12]. The dietary fiber content was modified by adding grape pomace. An increase was observed compared with CM. This result is in line with previous studies in which grape pomace was used as a functional ingredient in biscuits, cakes, and breadsticks [12, 13, 40]. The increase in dietary fiber in M15 is sufficient to label the product as a “source of fiber” or “high fiber” according to the European Regulation [41]. In addition, the inclusion of grape pomace in various foods has been shown to lower the glycemic index [16]. Dietary fiber is also related to the prevention of cardiovascular diseases and functions as a prebiotic for the gut microbiota [13].
The pH and titratable acidity were also modified in the M15 sample; the pH was lower, whereas titratable acidity increased. Changes in these parameters were expected because grape pomace contains organic acids, such as tartaric and citric acids [13], which lower the pH of the muffin samples. Color changes in the samples were also determined, and the results are presented in Table 1. A color model can be used to determine the color change in food products. The L* parameter measures the intensity of the color, with values closer to zero implying a darker color. The a* parameter shows the relationship between green and red, with negative values indicating green and positive values indicating red. The b* parameter indicates the relationship between yellow and blue, with negative values corresponding to blue and positive values to yellow [42]. According to the results, lower values of the parameters L*, a*, and b* were observed in the M15 samples. The value changes occurred in both the crumb and crust. Color changes resulting from the addition of grape pomace have been reported previously [13, 40]. In cookies and sponge cakes enriched with grape pomace at 4%, 6%, 8%, and 10%, the L*a*b* parameters decreased as the grape pomace content increased [42]. Lower lightness (L*) values indicate darker crumbs and crusts in enriched muffins, which have been attributed to Maillard reactions that can occur in the presence of reducing sugars and to increased protein content in enriched bakery products [40, 43, 44]. Moreover, the decrease in the lightness of enriched bakery products has been associated with pigment oxidation [45]. In this study, the grape pomace used to produce the M15 sample is a natural source of anthocyanins that can be oxidized, thereby decreasing lightness. The natural pigments present in byproducts, such as carotenoids from carrots and anthocyanins from grape pomace, are pH-sensitive and can shift the pigment color towards green hues (negative or decrease in a* values) in bakery products [46]. The increase in parameter b* has been related to the presence of eggs, sunflower oil, and margarine in sponge cakes [42]. Eggs and butter are presented in the muffin samples that can be related to the yellowness value observed in CM, but the presence of grape pomace in the M15 sample can mask and reduce the b* parameter. It has also been reported that a reduction in yellowness is more accentuated in the crumbs than the crust of bread enriched with brewers’ spent grains [43], and this effect was also observed in the CM and M15 samples (Table 1). The parameter ΔE (color difference) expresses the effect of grape pomace addition in the muffin sample (M15). According to Mikulec et al. [47], a value greater than 3 indicates perceptible color differences between the two products. In the present study, the ΔE values for the crust and crumbs were greater than 3, indicating a perceptible color change in the M15 sample due to the addition of grape pomace. In crackers, the use of non-conventional flours such as barley, split pea, and grape seed increases ΔE values proportionally as the enrichment of grape seed increases [48], which was attributed to a darkening effect. The changes in color parameters in the M15 samples can be attributed to the combined effects of the Millard and caramelization reactions, oxidation of phenolic compounds, and the pigment composition of the product [48].
As shown in Table 1, the total phenolic content was higher in the M15 sample than in the CM sample. A similar trend was observed for the flavonoids and condensed tannins. In the present study, a dry weight factor (DWF) was determined to enable easy comparison with other studies and express the results per gram of dry weight (g DW); DWF of 0.63 and 0.62 were obtained for CM and M15, respectively. The total phenolic content was 3.38 and 5.70 mg GAE/g DW for CM and M15, respectively. These results are similar to those previously reported for muffins (3.28 mg GAE/g DW), cereal bars (6.27 mg GAE/g DW), and biscuits (6.35 mg GAE/g DW) enriched with grape pomace [16]. The higher value for the obtained muffin can be attributed to the cacao content in the formulated muffin. For total flavonoid content, CM and M15 showed values of 2.26 and 3.74 mg CE/g DW, respectively. These values are consistent with those reported previously for pastry products enriched with grape pomace, such as biscuits (1.28 mg QE/g DW), cakes (0.86 mg QE/g DW), and rolls (1.89 mg QE/g DW) [49]. The difference in total phenolic and flavonoid contents between previous studies and the CM and M15 samples used in the present study can be attributed to the grape variety and other agri-environmental factors, as well as the presence of Cacao in their formulation [16, 49]. The results in Table 1 show an increase in the antioxidant capacity of the M15 samples, which can be attributed to the increase in total phenolic content. A similar trend was reported for cakes enriched with grape pomace, where a correlation between total phenolic content and antioxidant activity was observed [13]. These results demonstrate that adding grape pomace to muffins can increase phenolic compound content and, in turn, antioxidant capacity. The increase in phenolic compounds is significant, as these molecules are known to reduce lipid peroxidation and the formation of rancidity-related products, thereby extending product shelf life [13]. Table 2 presents the principal phenolic compounds that increased after the addition of grape pomace to the muffins. The main changes in the phenolic profile of the enriched muffins (M15) were the increase in phenolic acids and flavonoids content. The phenolic profile of the M15 samples differed from that of the control. The results in Table 2 show that the main changes were in phenolic acids, such as syringic, vanillin, ferulic, and isoferulic acids [13]. This trend has been previously reported for cakes enriched with grape pomace. The addition of phenolic acids, such as syringic acid and ferulic acid, has been reported for biscuits and muffins enriched with grape pomace [16, 50]. One of the most significant changes was the increase in ferulic acid content in muffins enriched with grape pomace. According to Han et al. [51], ferulic acid is one of the most abundant hydroxycinnamic acids in cereals, including wheat, although certain factors, such as thermal processing, reduce its content in baked goods. Another significant increase in naringenin was observed in muffins enriched with grape pomace. These results demonstrate that enriching muffins with grape pomace significantly improved the phenolic profile and content of the muffins.
Bioaccessibility refers to the fraction of bioactive compounds that can be released from the food matrix and solubilized in gastrointestinal fluids [52]. The bioaccessibility fraction of food bioactive compounds is measured using in vitro or ex vivo models. Bioavailability is defined as the fraction of bioactive compounds or their derivatives that can reach target cells, tissues, or organs in the body. Bioavailability is often measured using in vivo studies [52, 53]. For bioaccessibility, different in vitro digestion models have been proposed, statics and dynamics. In vitro digestion models are most commonly used owing to their low cost, ease of use, and reproducibility for assessing the bioaccessibility of phenolic compounds [53, 54].
The results shown in Figure 2 show that during the gastric phase, a higher release of phenolic compounds was observed in M15 than in CM. A similar trend was previously observed in bread samples enriched with grape pomace, where the release was proportional to the enrichment level. Moreover, observed that the main phenolic compounds were anthocyanins and flavonoids [55]. The increase in bioaccessibility during the oral stage can be attributed to the amount of free phenolic compounds incorporated with the enrichment of grape pomace in the M15 sample. According to Nakov et al. [13], wheat flour is characterized by a higher content of phenolic compounds bound to other biomolecules, such as carbohydrates, and therefore shows lower bioaccessibility. Conversely, a greater quantity of free phenolic compounds can be present in grape pomace, allowing them to be easily solubilized in gastric fluid [13, 52]. As shown in Figure 2, the CM sample exhibited a greater release of phenolic compounds than the M15 sample. This behavior differed from that observed in the earlier stages. In a previous study, the stability of phenolic compounds varied across stages of the digestive system. It was determined that phenolic acids are primarily unstable during the intestinal stage and suffer the greatest losses compared with other phenolic fractions [56]. This instability of phenolic acids may explain the reduction in the release of phenolic compounds by sample M15 (Figure 2), since, according to the phenolic profile (Table 2), the main change produced by the enrichment with grape pomace was the modification of phenolic acids. In the small intestine stage, sample M15 showed a bioaccessibility of 130%, whereas sample CM showed a bioaccessibility of 85%. In a previous study, the bioaccessibility of individual phenolic compounds from white bread was measured using a static in vitro model (INFOGEST). The authors used two breads enriched with grape pomace (5% and 10%) from the Corvina variety. During the small intestinal stage, the authors reported higher bioaccessibility percentages for different phenolic subclasses than in the control sample [55]. The bioaccessibility of encapsulated phenolic compounds from an extract of grape pomace added to a Greek-style yogurt was evaluated using an in vitro static model (INFOGEST) and reported that the bioaccessibility of different phenolic compounds increased during the intestinal stage, mainly for syringic acid (10,000%) and anthocyanins (~51%) [57]. This effect is attributed to transformations during digestion that increase syringic acid content and to the protective effect of encapsulation, which enhances the bioaccessibility of phenolic compounds.
According to Morales et al. [58], the bioaccessibility of phenolic compounds differs owing to the use of different models. Furthermore, most studies have observed a bioaccessibility percentage above 100%. This occurs for two main reasons: First, the release of phenolic compounds that are bound to other macromolecules, such as carbohydrates or proteins, during the digestive process; and second, the incorrect quantification of total phenolic compounds in the sample before digestion [58]. However, in the present study, soluble phenolic compounds were extracted as conjugated phenolic compounds using basic hydrolysis to obtain a more accurate estimation of the total phenolic compounds present in the sample. Nonetheless, basic hydrolysis is mainly performed to break glycosidic bonds [59]; therefore, it can be expected that other phenolic compounds bound to different macromolecules may not be released and, consequently, quantified.
It is also important to highlight the behavior of the samples during the simplified simulation of the colonic phase. In this stage, the release of phenolic compounds was greater in the CM sample than that observed in M15. This effect can be explained by the presence of several phenolic compounds bound to soluble dietary fiber that remain unchanged during the intestinal stage because they cannot be released by digestive enzymes, but are released by enzymes present in the microbiota, such as xylanase and esterase [60]. However, one limitation of the present study is the use of Viscozyme® L, which only simulates the stage and does not include all the enzymes that may be present under in vivo conditions. This same behavior in the bioaccessibility of phenolic compounds and fiber has been previously reported in bread enriched with grape pomace. In these cases, when the dietary fiber content was increased, changes in bioaccessibility were observed depending on the type of phenolic compound analyzed [55]. In the study conducted by Rocchetti et al. [55], the main changes in bioaccessibility were observed in anthocyanins, with their bioaccessibility decreasing as the fiber content increased. It has been reported that dietary fiber can modulate the bioaccessibility of compounds through interactions, such as hydrogen bonding. Furthermore, the presence of insoluble dietary fiber confers resistance to enzymatic action, which can contribute to the entrapment of phenolic compounds within the fiber and reduce their bioaccessibility [61].
In this study, the apparent glycemic index was determined, as it has been observed to yield results similar to those reported for the predicted glycemic index [61]. The apparent glycemic index can be used to assess carbohydrate quality in foods and is categorized into three types: high (≥ 70), medium (≥ 55), and low (≤ 55). It can be used as a preliminary test in studies that measure the in vivo glycemic index [62]. The apparent glycemic index values for samples M15 and CM were 24.5% and 25.9%, respectively (P < 0.05). The apparent glycemic index value indicated that sample M15 was low, suggesting that adding grape pomace to the muffin may modify starch digestion during its passage through the digestive tract [63]. According to Sulung et al. [62], there is a correlation between the types of carbohydrates present in the samples and the glycemic index; however, the correlation is less direct for total carbohydrate content. The increase in the glycemic index may depend mainly on the type of starch present in the sample and its digestibility. There are three types of starch: rapidly digested starch, slowly digested starch, and resistant starch, which can affect the apparent glycemic index of the samples [62, 63]. The reduction in the glycemic index through the incorporation of grape pomace in bakery products has already been reported in bakery items, such as bread [55] and pasta [14]. Conventional bakery products are known to have a high glycemic index due to starch degradation, which is attributed to the fine milling of wheat, which exposes starch to faster digestion by increasing its surface area and making it more accessible to enzymes, allowing them to hydrolyze starch and, consequently, release glucose [14, 63]. The reduction in the apparent glycemic index can be attributed to three main factors. The first is the reduction in flour quantity resulting from the substitution of grape pomace. The second is the increase in fiber content, which limits the absorption of water by starch granules. In addition, dietary fiber can limit the action of enzymes and, therefore, starch degradation [14, 55]. Third, the increase in phenolic compounds, such as flavonoids and condensed tannins, which can interact with enzymes such as α-amylase and α-glucosidase, inhibiting their action. These last two points can also explain the low bioaccessibility of phenolic compounds, indicating that the presence of dietary fiber inhibits enzymatic action or that there is a loss of phenolic compounds due to their interaction with gastrointestinal enzymes.
In conclusion, the partial substitution of 15% grape pomace in muffins modified the content of macronutrients and bioactive compounds, mainly phenolic compounds and dietary fiber, as well as the antioxidant capacity. The main phenolic compounds that increased were phenolic acids, such as ferulic and syringic acids, and flavonoids, such as naringenin. Although the enriched product was accepted by consumers, a sensory evaluation with a panel of trained judges is necessary to identify the descriptors and attributes of the new product and to determine its key organoleptic characteristics. However, increasing the phenolic compound content in muffins enriched with grape pomace did not improve bioaccessibility in the in vitro digestion model. This effect may be attributed to interactions with dietary fiber, which can limit the release of phenolic compounds. Finally, the inclusion of grape pomace in muffins resulted in a product with a low apparent glycemic index, representing an improvement over traditional bakery products. However, an in vivo study is necessary to determine whether the enriched muffin can reduce the rapid release of glucose into the blood and to assess whether the results coincide with those observed in vitro. Future studies should be conducted to determine the bioavailability of phenolic compounds in enriched muffins through clinical trials in healthy volunteers.
The supplementary materials for this article are available at: https://www.explorationpub.com/uploads/Article/file/1010172_sup_1.pdf.
ÓAMB thanks the Secretaria de Ciencia y Tecnología (SECIHTI) for the postdoctoral fellowship granted. The authors also thank Grupo Alximia S.A. de C.V. for their support and donation of the samples.
ÓAMB: Writing—original draft, Formal analysis. AAVF: Writing—original draft, Formal analysis. GAMM: Investigation. PYÁR: Investigation. JARC: Investigation. NRMR: Writing—review & editing, Conceptualization, Supervision. EAP: Writing—review & editing, Conceptualization, Supervision, Visualization. All authors read and approved the submitted version.
The authors declare that they have no conflicts of interest.
This study was approved by the Institutional Committee of Ethics and Bioethics of the Universidad Autónoma de Ciudad Juárez (CIEB-2019-1-051).
Informed consent to participate in the study was obtained from all participants.
Not applicable.
The original contributions presented in the study are included in the article, and further inquiries can be directed to the corresponding author.
Not applicable.
© The Author(s) 2026.
Open Exploration maintains a neutral stance on jurisdictional claims in published institutional affiliations and maps. All opinions expressed in this article are the personal views of the author(s) and do not represent the stance of the editorial team or the publisher.
Copyright: © The Author(s) 2026. This is an Open Access article licensed under a Creative Commons Attribution 4.0 International License (https://creativecommons.org/licenses/by/4.0/), which permits unrestricted use, sharing, adaptation, distribution and reproduction in any medium or format, for any purpose, even commercially, as long as you give appropriate credit to the original author(s) and the source, provide a link to the Creative Commons license, and indicate if changes were made.

View: 304
Download: 7
Times Cited: 0
