Original Article

Affiliation:
Institute of Food and Biotechnology, Can Tho University, Can Tho City 90000, Viet Nam
ORCID: https://orcid.org/0009-0008-3291-9579
Affiliation:
Institute of Food and Biotechnology, Can Tho University, Can Tho City 90000, Viet Nam
Affiliation:
Institute of Food and Biotechnology, Can Tho University, Can Tho City 90000, Viet Nam
Affiliation:
Institute of Food and Biotechnology, Can Tho University, Can Tho City 90000, Viet Nam
Affiliation:
Institute of Food and Biotechnology, Can Tho University, Can Tho City 90000, Viet Nam
Affiliation:
Institute of Food and Biotechnology, Can Tho University, Can Tho City 90000, Viet Nam
Affiliation:
Institute of Food and Biotechnology, Can Tho University, Can Tho City 90000, Viet Nam
ORCID: https://orcid.org/0009-0002-8411-2562
Affiliation:
Institute of Food and Biotechnology, Can Tho University, Can Tho City 90000, Viet Nam
ORCID: https://orcid.org/0000-0002-3079-1259
Affiliation:
Institute of Food and Biotechnology, Can Tho University, Can Tho City 90000, Viet Nam
Email: hxphong@ctu.edu.vn
ORCID: https://orcid.org/0000-0003-0220-2979
Explor Foods Foodomics. 2026;4:1010168 DOI: https://doi.org/10.37349/eff.2026.1010168
Received: December 25, 2025 Accepted: May 06, 2026 Published: June 16, 2026
Academic Editor: José Pinela, National Institute of Agrarian and Veterinary Research, Polytechnic Institute of Bragança, Portugal
Aim: Mango (Mangifera indica L.) is a nutrient-rich tropical fruit with high economic value, but it faces significant post-harvest preservation challenges. This study aimed to optimize the fermentation of drinking vinegar from mango to develop products with high nutritional value and desirable sensory properties.
Methods: The effects of the raw material-to-water ratio, ethanol concentration, pH, and TSS on total acid content were determined using the titration method. A Box-Behnken design was applied to optimize inoculum density, fermentation time, and temperature. After fermentation, mango juice was incorporated to enhance flavor, and the product quality was analyzed through physicochemical, microbiological, and antioxidant activity assessments. A consumer preference test was conducted using an untrained sensory panel.
Results: The optimal fermentation conditions were determined as follows: a mango juice-to-water ratio of 1:10 (v/v), ethanol concentration of 4% (v/v), total soluble solids of 10 °Brix, initial pH of 6, and an inoculum level of 1% (v/v), corresponding to a cell density of 6.7 × 10⁵ CFU/mL, at 30.08°C for 9.59 days. Under these conditions, the final product, with 40% juice supplementation, contained 13.30 g/L acetic acid, 18.91 g/L reducing sugars, 52.79% antioxidant capacity, and 827.79 mg GAE/L total phenolic content.
Conclusions: The optimized fermentation conditions for producing drinking vinegar from mango juice can be applied to create high-quality mango vinegar from grade-2 mangoes with desirable nutritional and sensory properties while ensuring food safety.
Mango is a tropical fruit that is highly beneficial for health, as it is rich in macronutrients, micronutrients, and bioactive compounds such as phenolics and polyphenols [1]. In addition to being consumed fresh, mangoes are widely processed for both export and domestic markets. More than 100 countries worldwide cultivate mangoes, with global production concentrated mainly in Asia, particularly in India [2]. Notably, Vietnam is the 13th largest mango producer in the world, with a total planted area of over 87,000 hectares [3]. During transportation and the processing of frozen or dried mango products, a significant amount of shredded flesh is left as a by-product, about 40–50% [1]. The abundant natural sugars, nutrients, vitamins, and minerals in these by-product mangoes create a favorable environment for microbial fermentation.
Vinegar is a traditional acidic condiment produced from various agricultural materials through a two-stage fermentation process involving yeast and acetic acid bacteria. During these stages, various metabolites are formed, which are crucial for the taste and flavor of vinegar. In addition to its sensory properties, vinegar exhibits numerous biological properties, such as antibacterial and antioxidant activities [4, 5]. Previous studies have shown that vinegar production is typically carried out using a co-culture of yeast and acetic acid bacteria, commonly Acetobacter spp., while Komagataeibacter spp. are mainly recognized for their role in bio-cellulose production [6–9]. Among them, K. intermedius demonstrates outstanding advantages, such as higher tolerance to acetic acid and sugar concentrations [10]. Therefore, the physiological characteristics of K. intermedius, particularly its high tolerance to acetic acid and sugar concentrations, suggest its potential application in vinegar fermentation beyond its conventional use.
The production of fruit vinegars is a common approach in the food industry to utilize second-grade fruits. This method effectively uses surplus and lower-grade fruits without compromising the quality of the final product. The acidic nature of fruit vinegar, along with the strong sensory influence of acetic acid on the product’s flavor and aroma, allows for the use of almost any type of fruit in production [11]. Although the production of fruit vinegar has been extensively studied, research focusing on the use of K. intermedius in this process remains limited. Additionally, systematic optimization of fermentation conditions for mango-based drinking vinegar has not been fully explored. This study aims to address these gaps and provide a basis for future applications of K. intermedius in the vinegar industry, as well as for the development of drinking vinegar from various fruit sources.
K. intermedius and the entire study were conducted in a pilot laboratory at the Institute of Food and Biotechnology, Can Tho University, Viet Nam. Mango pulp was collected from local markets in Can Tho City, located at 10°1′49″ N latitude and 105°46′11″ E longitude. Chemicals and reagents, including sodium hydroxide (NaOH), were procured from Cemaco (Viet Nam). 2,2-diphenyl-1-picrylhydrazyl (DPPH) was obtained from Tokyo Chemical Industry (Japan). Gallic acid (C7H6O5) was purchased from Sigma-Aldrich (Germany). Granulated Bien Hoa sugar was bought at a local supermarket (Viet Nam), and all other chemicals and reagents supplied by the pilot plant and employed in the study were of analytical standard.
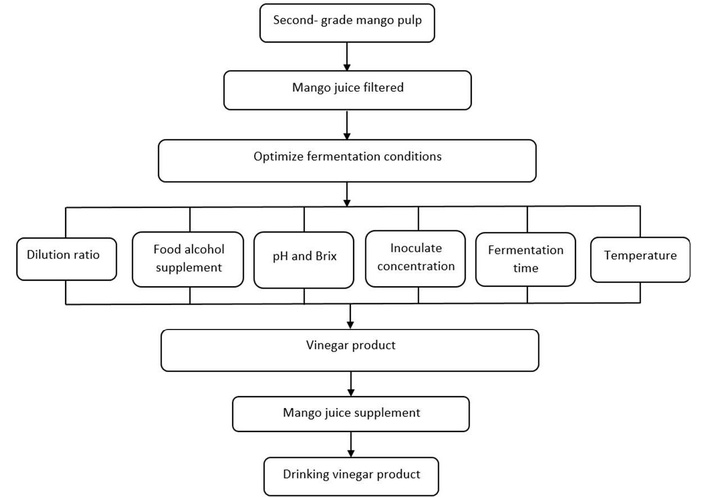
The flow diagram (Figure 1) illustrates the technical route of the study. Fully ripe fruits that are no longer visually perfect (e.g., scratched, small, or unevenly ripened) but free from rot or mold are selected. The selected fruits are then washed, seeds and skin removed, and the pulp is crushed and filtered to obtain mango juice for fermentation. K. intermedius was cultured in liquid YPDG medium at 30°C to reach a concentration of 107 CFU/mL.
Mango juice was first diluted with RO water at volume ratios of 1:8, 1:10, and 1:12 (v/v). After adjusting the dilution ratios between mango juice and water, food-grade ethanol (96%) was added to each dilution at concentrations of 2%, 3%, 4%, and 5% (v/v) to serve as a fermentation substrate. In total, 12 treatments were prepared, and each treatment was conducted in triplicate. Each treatment was adjusted to pH 5 using either sodium carbonate (Na2CO3) or citric acid (C6H8O7), and the soluble solids content was standardized to 10 °Brix. After standardization, all treatments were sterilized by adding sodium metabisulfite (NaHSO3) at 140 mg/L for 2 hours. K. intermedius was inoculated at 1% (v/v), and fermentation was carried out at room temperature (28–32°C) under static conditions, covered with alcohol-sterilized gauze, and monitored for 7 days. Two indicators, including pH value and acetic acid content, were measured to evaluate the initial fermentation conditions.
The effects of pH and total soluble solids (TSS, °Brix) on vinegar fermentation were then investigated. Based on the results of the previous experiment, the raw material-to-water ratio and ethanol concentration were fixed. The mixtures were adjusted to pH values of 4, 5, and 6, and TSS levels of 5, 10, and 15 °Brix. Each treatment was conducted in triplicate. Subsequent procedures were performed following the method described above. After 7 days of fermentation, pH and acetic acid content were measured for all treatments.
The conditions for mango vinegar fermentation, including the raw material-to-water ratio, ethanol concentration, pH, and TSS, were determined and fixed based on the results of preliminary experiments. To optimize the fermentation process for drinking vinegar, three independent variables including inoculum density (105–107 CFU/mL), fermentation time (4–10 days), and temperature (30–37°C), were investigated using Response Surface Methodology (RSM) based on a Box-Behnken design (Table 1). The Box–Behnken design consisted of 17 experimental runs, including 5 replicated center points to estimate pure experimental error and assess the adequacy of the fitted model. The experimental runs were conducted in a randomized order, and subsequent procedures were carried out following the method described above under the specified fermentation conditions. The experimental data, including pH and acetic acid content after fermentation, were recorded and analyzed using Design-Expert software (version 11.0). Treatments with higher acetic acid content were selected for validation experiments to compare the experimental values with the predicted values, thereby assessing the accuracy and reproducibility of the regression model. The optimal condition was defined as the one yielding the highest acetic acid production and was subsequently applied to further experiments.
Coded and three variable levels.
| Coded | Factors | Unit | Levels | ||
|---|---|---|---|---|---|
| –1 | 0 | +1 | |||
| A | Inoculum density | CFU/mL | 1.0 × 10⁵ | 5.05 × 10⁶ | 1.0 × 10⁷ |
| B | Fermentation time | day | 4 | 7 | 10 |
| C | Temperature | °C | 30 | 33.5 | 37 |
After determining the optimal fermentation conditions, mango juice was incorporated to enhance the flavor profile of the vinegar. The fermented vinegar was pasteurized at 80°C for 10 minutes to inactivate microbial activity and ensure product sterility. Separately, mango juice was treated with sodium metabisulfite (NaHSO3) at a concentration of 140 mg/L for 2 hours under clean air conditions to preserve its quality and prevent microbial contamination. The treated mango juice was then added to the vinegar at concentrations of 30%, 40%, and 50% (v/v). Each treatment was conducted in triplicate. The proportion of mango juice added was determined based on the preference of untrained panelists in the sensory evaluation, as well as physicochemical parameters, including pH, acetic acid content, reducing sugar content, and total phenolic content, and antioxidant capacity.
Product quality evaluation was conducted based on the optimized fermentation conditions and appropriate levels of mango juice addition. Under the optimized conditions, mango vinegar fermentation was performed at the laboratory scale to assess process scalability using fermentation volumes of 100 mL and 1,000 mL. In addition to evaluating physicochemical parameters and sensory characteristics, the final product was analyzed for lead content and microbiological parameters, including total aerobic microorganisms, total yeast, Coliforms, Escherichia coli, Streptococcus faecalis, Pseudomonas aeruginosa, Staphylococcus aureus, and Clostridium perfringens, which were analyzed by Avatek Laboratory (Ho Chi Minh City, Viet Nam). The product was also evaluated for biological activity, including total phenolic content and antioxidant capacity.
The pH of the mixture was measured using a pH meter (PH-20, Sartorius, Germany). TSS (°Brix) was determined using a refractometer (Master-M, Atago, Japan). Acetic acid content was determined by the Therner titration method [12]. Total phenolic content was determined using the Folin-Ciocalteu method, with absorbance measured at 765 nm [13]. Reducing sugar content was determined using the DNS method, with absorbance measured at 540 nm [14]. Antioxidant capacity was determined using the DPPH free radical scavenging assay, with absorbance measured at 517 nm [15]. Twenty untrained panelists from the Institute of Food and Biotechnology, Can Tho University (Viet Nam), evaluated the sensory attributes of the product according to quality criteria (scored on a scale of 0–5), modified based on the Vietnamese Standard TCVN 12828:2019 and QCVN 6-2:2010/BYT for non-alcoholic beverages [16, 17].
The collected data were initially processed using Microsoft Excel (Office 16.0, Microsoft Corp., USA), followed by statistical analysis performed with Statgraphics Centurion 19 (Statgraphics Technologies, Inc., USA). The fermentation factors were optimized using the Box-Behnken design in Design-Expert 11.0 software (Stat-Ease, Inc., Minneapolis, USA). One-way analysis of variance (ANOVA) was conducted to assess the significance of differences among treatment means. Comparisons between means were conducted using Tukey’s Honestly Significant Difference (HSD) test and the Least Significant Difference (LSD) method. Differences between mean values were considered statistically significant at p < 0.05.
As shown in Table 2, the pH value and acetic acid concentration after fermentation were affected by the ratio of mango-to-water and food-grade ethanol (96%). The pH values decreased after fermentation, ranging from 2.95 to 3.69, and pH and acid content exhibited an inverse relationship. Among the different dilution ratios, the combination with 4% (v/v) ethanol resulted in the highest acid content, suggesting that acetic acid bacteria could survive and function optimally under this condition. Statistical analysis revealed that treatments 3 and 7 demonstrated outstanding acid content, with values of 8.65 g/L and 7.85 g/L, respectively, which were significantly different from the other treatments. Treatment 7, with the appropriate parameters of a 1:10 (v/v) material-to-water ratio and 4% (v/v) ethanol, was selected.
The effects of mango-to-water ratio and ethanol concentration on the fermentation process (after 7 days).
| Treatment | Material-to-water ratio (v/v) | Ethanol (% v/v) | Post-fermentation pH | Acetic acid content (g/L) |
|---|---|---|---|---|
| 1 | 1:8 | 2 | 3.31 ± 0.05 | 3.75 ± 0.30def |
| 2 | 1:8 | 3 | 3.22 ± 0.04 | 5.20 ± 0.96cd |
| 3 | 1:8 | 4 | 2.95 ± 0.02 | 8.65 ± 0.90a |
| 4 | 1:8 | 5 | 3.10 ± 0.11 | 7.25 ± 0.88ab |
| 5 | 1:10 | 2 | 3.52 ± 0.11 | 2.65 ± 0.46efg |
| 6 | 1:10 | 3 | 3.31 ± 0.10 | 4.15 ± 1.01cde |
| 7 | 1:10 | 4 | 2.96 ± 0.07 | 7.85 ± 0.71a |
| 8 | 1:10 | 5 | 3.63 ± 0.15 | 2.20 ± 0.23efg |
| 9 | 1:12 | 2 | 3.69 ± 0.07 | 1.55 ± 0.43g |
| 10 | 1:12 | 3 | 3.22 ± 0.02 | 5.15 ± 0.61cd |
| 11 | 1:12 | 4 | 3.19 ± 0.02 | 5.75 ± 0.53bc |
| 12 | 1:12 | 5 | 3.62 ± 0.06 | 2.05 ± 0.53fg |
Note: Values in the table represent the mean of three replicates. In the same column, values with the same superscript letters are not significantly different at the 95% confidence level (p < 0.05).
The resulting acid content after 7 days of fermentation is presented in Table 3. Treatments at 5 °Brix with pH 5–6, show relatively high acetic acid production (4.30–4.80 g/L). In contrast, increasing TSS to 15 °Brix generally reduced acetic acid formation. After 7 days of fermentation, treatment 6 with 10 °Brix and pH 6 produced the highest acetic acid content (8.95 g/L), which was identified as suitable for mango vinegar fermentation. Statistical analysis confirmed that this treatment yielded significantly higher acetic acid levels compared with the other treatments (p < 0.05).
Effect of soluble solids and pH on fermentation (after 7 days).
| Treatment | TSS (°Brix) | pH | Post-fermentation pH | Acetic acid content (g/L) |
|---|---|---|---|---|
| 1 | 5 | 4 | 3.57 ± 0.02 | 2.40 ± 0.26cde |
| 2 | 5 | 5 | 3.25 ± 0.06 | 4.30 ± 1.05bc |
| 3 | 5 | 6 | 3.22 ± 0.02 | 4.80 ± 0.52b |
| 4 | 10 | 4 | 3.76 ± 0.01 | 1.10 ± 0.09e |
| 5 | 10 | 5 | 3.43 ± 0.10 | 2.55 ± 0.39cde |
| 6 | 10 | 6 | 2.96 ± 0.03 | 8.95 ± 1.62a |
| 7 | 15 | 4 | 3.74 ± 0.05 | 1.30 ± 0.30de |
| 8 | 15 | 5 | 3.33 ± 0.06 | 3.15 ± 0.54bcd |
| 9 | 15 | 6 | 3.24 ± 0.06 | 4.05 ± 0.39bc |
Note: Values in the table represent the mean of three replicates. In the same column, values with the same superscript letters are not significantly different at the 95% confidence level (p < 0.05).
The optimal conditions for acetic acid production during vinegar fermentation were determined by investigating three factors: inoculum density, fermentation time, and temperature. These variables were designed and optimized based on the Box-Behnken model, and the results are presented in Table 4.
Acetic acid content and pH after fermentation under different experimental conditions based on the Box-Behnken design.
| Treatment | Factors | Monitoring parameters | |||
|---|---|---|---|---|---|
| Inoculum density (CFU/mL) | Fermentation time (day) | Temperature (°C) | Post-fermentation pH | Acetic acid content (g/L) | |
| 1 | 5.05 × 10⁶ | 10 | 30 | 2.53 | 14.35 |
| 2 | 5.05 × 10⁶ | 7 | 33.5 | 3.31 | 3.85 |
| 3 | 1.0 × 10⁵ | 10 | 33.5 | 3.18 | 9.50 |
| 4 | 1.0 × 10⁵ | 7 | 30 | 2.31 | 15.65 |
| 5 | 1.0 × 10⁷ | 10 | 33.5 | 3.60 | 2.65 |
| 6 | 5.05 × 10⁶ | 7 | 33.5 | 3.51 | 4.00 |
| 7 | 1.0 × 10⁷ | 4 | 33.5 | 3.79 | 1.80 |
| 8 | 1.0 × 10⁷ | 7 | 37 | 3.12 | 7.60 |
| 9 | 5.05 × 10⁶ | 10 | 37 | 3.54 | 2.65 |
| 10 | 5.05 × 10⁶ | 4 | 37 | 3.73 | 1.10 |
| 11 | 5.05 × 10⁶ | 4 | 30 | 3.72 | 1.90 |
| 12 | 5.05 × 10⁶ | 7 | 33.5 | 3.58 | 3.85 |
| 13 | 5.05 × 10⁶ | 7 | 33.5 | 3.61 | 1.30 |
| 14 | 1.0 × 10⁷ | 7 | 30 | 2.84 | 7.00 |
| 15 | 1.0 × 10⁵ | 4 | 33.5 | 3.67 | 1.30 |
| 16 | 5.05 × 10⁶ | 7 | 33.5 | 3.47 | 2.70 |
| 17 | 1.0 × 10⁵ | 7 | 37 | 3.27 | 2.75 |
Analysis of variance (ANOVA) was used to assess the statistical significance of the quadratic regression model (Table 5), and the response surface graph (Figure 2) demonstrates that multiple factors influence acid formation during fermentation. Following the regression equation, the optimal conditions for acetic acid production can be determined. The acetic acid content (g/L) was modeled as a function of inoculum density (A, CFU/mL), fermentation time (B, day), and fermentation temperature (C, °C) using the following coded equation (1):
Analysis of variance for the Box-Behnken Design experimental results.
| Source | Sum of squares | df | Mean of squares | F-value | p-value | Prob > F |
|---|---|---|---|---|---|---|
| Model | 308.82 | 9 | 34.31 | 26.59 | 0.0001 | Significant |
| A-Inoculum density | 13.78 | 1 | 13.78 | 10.68 | 0.0137 | |
| B-Fermentation time | 66.41 | 1 | 66.41 | 51.47 | 0.0002 | |
| C-Temperature | 74.73 | 1 | 74.73 | 57.91 | 0.0001 | |
| AB | 13.51 | 1 | 13.51 | 10.47 | 0.0143 | |
| AC | 43.23 | 1 | 43.23 | 33.50 | 0.0007 | |
| CB | 29.70 | 1 | 29.70 | 23.02 | 0.0020 | |
| A2 | 16.93 | 1 | 16.93 | 13.12 | 0.0085 | |
| B2 | 7.48 | 1 | 7.48 | 5.79 | 0.0470 | |
| C2 | 42.91 | 1 | 42.91 | 33.26 | 0.0007 | |
| Residual | 9.03 | 7 | 1.29 | |||
| Lack of fit | 3.71 | 3 | 1.24 | 0.93 | 0.5048 | Not significant |
| Pure error | 5.33 | 4 | 1.33 | |||
| Cor Total | 317.86 | 16 | ||||
| Std. Dev. | 1.14 | R2 | 0.9716 | |||
| Mean | 4.96 | Adj R2 | 0.9350 | |||
| C. V. % | 22.91 | Pred R2 | 0.7873 | |||
| PRESS | 67.61 | Adeq R2 | 17.891 | |||
df: degree of freedom; Adeq: adequate. Significant at 5% level (p < 0.05).
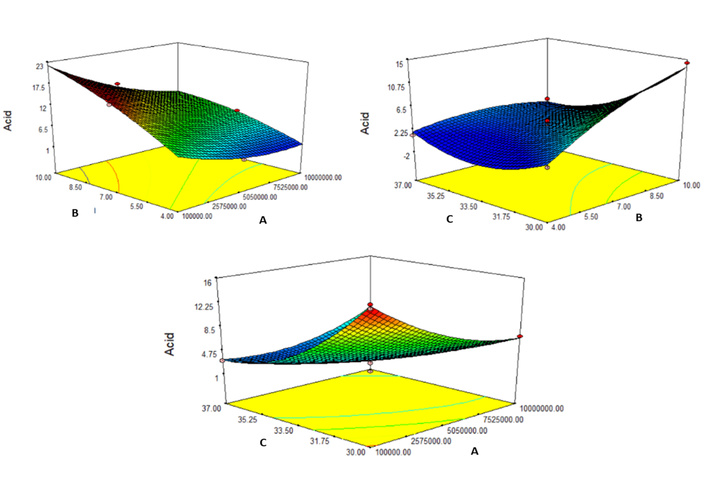
Response surface plots in three dimensions (3D) with factors of inoculum density (A), fermentation time (B), and fermentation temperature (C) on the acetic acid content produced.
Acetic acid content (g/L) = 3.14 – 1.31 × A + 2.88 × B – 3.06 × C – 1.84 × A × B + 3.29 × A × C – 2.73 × B × C + 2.01× A2 – 1.33 × B2 + 3.19 × C2 (1)
Numerical optimization was performed using Design-Expert 11.0 to maximize acetic acid production, as shown in Table 6. The software generated multiple candidate solutions with a desirability value of 1.000. Among these solutions, three representative conditions were selected for experimental validation because they provided high predicted acetic acid yields while remaining within practical operating ranges. The actual acetic acid content measured in these trials was slightly lower than the predicted values, with deviations ranging from 0.41 to 0.46 g/L. Among the tested combinations, the condition of 6.7 × 10⁵ CFU/mL, 9.59 days, and 30.08°C produced the highest and most optimal acid content.
Fermentation results from optimal treatment.
| Treatment | Fermentation condition | Acetic acid content (g/L) | |||
|---|---|---|---|---|---|
| Inoculum density (CFU/mL) | Fermentation time (day) | Temperature (°C) | Predicted | Actual | |
| 1 | 6.7 × 10⁵ | 9.59 | 30.08 | 19.96 | 19.55 ± 0.62a |
| 2 | 11.3 × 10⁵ | 9.55 | 30.03 | 19.21 | 18.75 ± 0.46b |
| 3 | 10.3 × 10⁵ | 9.22 | 30.15 | 18.38 | 17.90 ± 0.40ab |
Note: Values in the table represent the mean of three replicates. In the same column, values with the same superscript letters are not significantly different at the 95% confidence level (p < 0.05). Different temperature values were normalized to a reference temperature of 30°C.
The addition of mango juice at varying levels significantly affects the final product. Key factors such as acid content, pH, antioxidant capacity, reducing sugar content, and total phenolic content are influenced by the different rates of mango juice addition, as shown in Table 7. The reducing sugar content increased significantly from 3.23 g/L in the control sample (without mango juice) to 23.83 g/L when 50% mango juice was added. When the total phenolic content increased from 538.97 mg GAE/L to 973.18 mg GAE/L due to the addition of 50% mango juice, the antioxidant capacity of the vinegar also rose significantly from 29.51% to 56.61%. Sensory evaluation in Table 8 shows no significant differences in color, clarity, taste, or aroma among the three mango-juice ratios. The 40% mango juice sample received the highest taste score (4.65/5). Therefore, the 40% mango juice formulation was considered the most suitable because it provided a balanced flavor while preserving the characteristic properties of the vinegar.
The acid content, pH, antioxidant capacity, reducing sugar content, and total phenolic content at different supplemented mango juice ratios.
| Mango juice ratio(% v/v) | Acid content (g/L) | Final pH | Reducing sugar content (g/L) | Antioxidant capacity (%) | Total phenolic(mg GAE/L) |
|---|---|---|---|---|---|
| 0 | 19.80 ± 0.45a | 2.18 ± 0.01 | 3.23 ± 0.36d | 29.51 ± 0.94d | 538.97 ± 23.45d |
| 30 | 14.00 ± 0.61b | 2.38 ± 0.02 | 14.18 ± 0.55c | 41.50 ± 1.49c | 631.07 ± 15.79c |
| 40 | 12.85 ± 0.35c | 2.51 ± 0.01 | 18.98 ± 1.88b | 52.74 ± 1.04b | 880.85 ± 33.08b |
| 50 | 11.80 ± 0.31d | 2.78 ± 0.13 | 23.83 ± 2.85a | 56.61 ± 1.45a | 973.18 ± 8.89a |
Note: Values in the table represent the mean of three replicates. In the same column, values with the same superscript letters are not significantly different at the 95% confidence level (p < 0.05).
Sensory evaluation after mango addition at different ratios.
| Mango juice ratio (% v/v) | Color | Clarity | Taste | Smell | Average score |
|---|---|---|---|---|---|
| 30 | 4.45 ± 0.89a | 4.55 ± 0.69a | 3.80 ± 1.19b | 4.50 ± 0.69a | 4.34 |
| 40 | 4.55 ± 0.69a | 4.40 ± 0.68a | 4.65 ± 0.59a | 4.55 ± 0.60a | 4.54 |
| 50 | 4.45 ± 0.60a | 4.15 ± 0.93a | 3.90 ± 0.97b | 4.55 ± 0.76a | 4.24 |
Note: Values in the table represent the mean of three replicates. In the same column, values with the same superscript letters are not significantly different at the 95% confidence level (p < 0.05).
Fermentation at 100 mL and 1,000 mL scales, under the optimal conditions from Design-Expert 11.0, is shown in Table 9. Before supplementation, the 1,000 mL treatment showed slightly lower acid content (18.85 g/L) and higher reducing sugar content (3.99 g/L) compared with 100 mL (19.80 g/L and 3.22 g/L, respectively), while antioxidant capacity and total phenolic content were lower (26.58% and 514.63 mg GAE/L) than those of the 100 mL treatment (29.52% and 564.85 mg GAE/L). After supplementation, both volumes exhibited a clear reduction in acid content (12.30–13.30 g/L) but a substantial increase in reducing sugars (18.91–18.95 g/L). Similarly, antioxidant capacity nearly doubled (49.20–52.79%), and total phenolic content rose significantly, reaching 820.55–827.79 mg GAE/L.
Acid content, pH, antioxidant capacity, reducing sugar content, total phenolic content before and after mango supplementation at laboratory scale.
| Volume (mL) | Analytical parameters | ||||
|---|---|---|---|---|---|
| Acid content (g/L) | pH | Reducing sugar content (g/L) | Antioxidant capacity (%) | Total phenolic (mg GAE/L) | |
| Before the supplementation of mango juice | |||||
| 100 | 19.80 ± 0.45a | 2.16 ± 0.02 | 3.22 ± 0.35a | 29.52 ± 0.94a | 564.85 ± 1.00a |
| 1,000 | 18.85 ± 0.74a | 2.19 ± 0.05 | 3.99 ± 0.17a | 26.58 ± 1.64a | 514.63 ± 6.59b |
| After the supplementation of mango juice | |||||
| 100 | 13.30 ± 0.48A | 2.47 ± 0.04 | 18.91 ± 0.16A | 52.79 ± 0.54A | 827.79 ± 29.19A |
| 1,000 | 12.30 ± 0.45A | 2.65 ± 0.12 | 18.95 ± 1.09A | 49.20 ± 1.04A | 820.55 ± 28.78A |
Note: The average values with the same letters in small (a, b) or capital (A, B) in the same column are not significantly different at the 95% confidence level (p < 0.05).
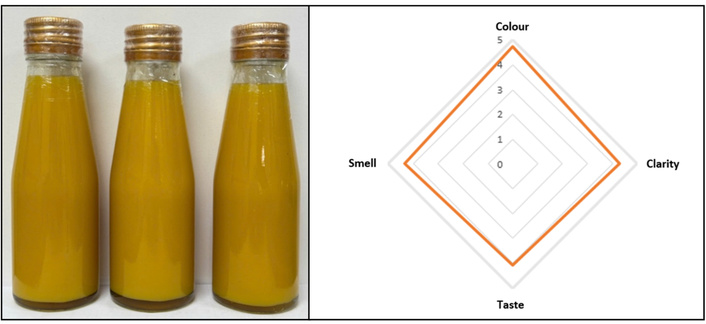
The microbiological and heavy metal analyses, along with sensory evaluation of the mango vinegar product, are indicated in Table 10 and Figure 3, respectively. All parameters complied with the permissible limits established in QCVN 6-2:2010/BYT for non-alcoholic beverages [17]. These findings affirm that the mango vinegar product is distinguished not only by its safety but also by its appealing taste.
Regulatory maximum limits in accordance with QCVN 6-2:2010/BYT.
| Parameters | Unit | Testing method | Result | Maximum permissible limits as stipulated in QCVN 6-2:2010/BYT |
|---|---|---|---|---|
| Total aerobic microbial count | CFU/mL | TCVN 4884–1:2015(ISO 4833–1:2013) | 1.0 × 10² | 100 |
| Coliforms | CFU/mL | TCVN 6848:2007(ISO 4833:2006) | < 1 | Not permitted |
| Escherichia coli | CFU/mL | TCVN 7924–2:2008(ISO 16649–2:2001) | < 1 | Not permitted |
| Streptococci faecal | CFU/mL | NMKL 68, 5th ed., 2011 | < 1 | Not permitted |
| Pseudomonas aeruginosa | CFU/mL | AVA-KN-PP.VS/055(ISO 16266:2006) | < 1 | Not permitted |
| Staphylococcus aureus | CFU/mL | AOAC 975.55 | < 1 | Not permitted |
| Clostridium perfringens | CFU/mL | TCVN 4991:2005(ISO 7937:2004) | < 1 | Not permitted |
| Total mold count | CFU/mL | TCVN 8275–1:2010(ISO 21527–1:2008) | 0.9 × 101 | 10 |
| Lead (Pb) | mg/L | AVA-KN-PP.QP/072 (AOAC 2015.01) | KPH (LOD = 0.003) | 0.05 |
In this study, yeasts were not included in the fermentation process, as the experimental design focused specifically on acetic acid production from an ethanol-supplemented substrate, which serves as an essential precursor in the early stages of acetic acid production, typically ranging from 2–10% (v/v). By directly providing ethanol, the role of K. intermedius could be clearly evaluated under controlled conditions, minimizing variability associated with simultaneous alcoholic fermentation. In recent studies, fermentation was most efficient at 3–4% ethanol with acetic acid concentrations ranging from 4.15 ± 1.01 to 8.65 ± 0.90 g/L, whereas 2% was insufficient and 5% inhibited bacterial growth. These findings are consistent with previous studies reporting that elevated ethanol levels negatively affect bacterial growth and metabolic activity [18, 19]. While some studies have reported higher acetic acid production at elevated ethanol levels, for instance, Le and Hoang found that mango vinegar achieved maximum acid contents of 3.314% at 4% ethanol and 3.403% at 8% ethanol after 8 days of fermentation using Acetobacter aceti [8]. In contrast, Islam et al. demonstrated optimal performance at lower ethanol concentrations, with the highest acetic acid production reaching 7 g/L at 2% ethanol using Acetobacter spp. [20]. Therefore, the observed optimal range in this study reflects the adaptation of the selected strain and fermentation conditions. Appropriate dilution of nutrient is also necessary for an efficient fermentation process. When mango juice is diluted to a suitable level, it helps maintain moderate viscosity while ensuring sufficient concentrations of substrates and essential nutrients for bacterial growth and metabolism. The effect of dilution is not limited to acetic acid fermentation but has also been reported in lactic acid and ethanol processes [21, 22]. As shown in Table 2, treatments 3 and 7 exhibited significantly higher acid content, at 8.65 g/L and 7.85 g/L, respectively, which were statistically higher than those of the other treatments. However, considering both fermentation performance and economic efficiency, treatment 7 can be considered the most suitable, as this dilution ratio provides greater economic benefits compared to treatment 3. Several studies have shown that both substrate concentration and initial pH significantly influence acetic acid fermentation by directly affecting microbial growth and metabolic activity [23, 24]. Table 3 illustrated that after 7 days of fermentation, acidity ranged from 1.10 to 2.40 g/L at an initial pH of 4, whereas significantly higher production was observed at pH 5 and 6, with the highest acetic acid concentrations at pH 6. This is consistent with Divyashree et al., who reported that acetic acid bacteria grow optimally within a pH range of 5.0–6.5 [25]. This observation is further supported by Tran et al., who reported that acerola cherry vinegar fermented at 20.26 °Brix and pH 6.5 achieved an acid yield of 5.88% (w/v) after 7 days [26]. Similarly, Kang et al. demonstrated that acidity developed more efficiently at moderate sugar concentrations (5–10 °Brix) compared with lower or higher levels (1 and 14 °Brix) [27]. These findings are consistent with our results, shown in Table 3, where acidity increased at moderate sugar concentrations (5–10 °Brix), with the highest acid production observed at 10 °Brix (8.95 g/L). In contrast, higher concentrations (15 °Brix) resulted in reduced acid formation, likely due to metabolic inhibition or dehydration stress in acetic acid bacteria [28]. Similarly, glucose tolerance studies in balsamic vinegar strains showed that high glucose levels around 25% inhibited most AAB growth [29]. In this study, K. intermedius utilized glucose, the natural sugar present in mango juice, to produce gluconic acid and ethanol as a substrate for acetic acid production. In addition, sucrose was supplemented, and K. intermedius was able to utilize it through levansucrase activity [30]. This metabolic flexibility may contribute to efficient acetic acid production and the simultaneous formation of bacterial cellulose, highlighting its potential for integrated and value-added fermentation processes. However, the sucrose utilization pathway was not directly quantified or confirmed, and no specific metabolites (e.g., levan or gluconic acid) were measured to validate the proposed mechanism in this study. In addition, enzyme activity (levansucrase) and carbon flux distribution were not analyzed, limiting the ability to fully interpret substrate utilization. Therefore, further studies are required to elucidate the metabolic pathways involved and to optimize the application of K. intermedius in future bioprocesses. The optimal conditions for acetic acid fermentation were identified to include mango juice diluted at a ratio of 1:10 (v/v), ethanol supplementation at 4%, total soluble solids (TSS) were adjusted to 10 °Brix, and an initial pH of 6.
Optimizing vinegar fermentation requires careful control of inoculum concentration, temperature, and fermentation time. Inoculum concentration plays a crucial role in fermentation, as an appropriate density ensures efficient ethanol-to-acetic acid conversion while suppressing undesirable microorganisms [31, 32]. Moderate temperatures support optimal microbial metabolism and enzyme activity, particularly pyrroloquinoline quinone-dependent alcohol dehydrogenase (PQQ-ADH), which is essential for ethanol oxidation in Komagataeibacter spp., microorganisms known for their tolerance to acidic and relatively high-temperature environments [33, 34]. When inoculum density and temperature are optimized, bacterial biomass and enzymatic activity increase rapidly, accelerating ethanol conversion and shortening fermentation time [35]. Liu et al. used Fuji apples as raw materials to produce apple cider vinegar and applied RSM to optimize the fermentation process [36]. Under optimal conditions, the total acidity reached 62.22 g/L, which was very close to the value predicted by the model. Other studies have also applied RSM to optimize fermentation factors in processes such as banana vinegar, mulberry fruit vinegar, and cocoa pod shell vinegar, demonstrating the suitability, reliability, and high reproducibility of this modeling approach [37–39]. In the present study, ANOVA of the Box-Behnken design was performed to evaluate the significance of the regression model and its linear, interaction, and quadratic terms. Table 5 shows that the model was highly significant (p-value = 0.0001, p < 0.05) [40], while the “Lack of Fit” test was non-significant (F = 0.93, p > 0.10), indicating a good fit of the model to the experimental data. The coefficient of determination (R2 = 0.9716) demonstrated a strong correlation between predicted and experimental values, supporting the adequacy of the model for response prediction [41]. Experimental data were recorded and analyzed using Design-Expert 11.0 to establish a multivariate regression equation (equation (1)), from which the optimal conditions for acetic acid production were determined. In this model, A represents inoculum density (CFU/mL), B represents fermentation time (day), and C represents fermentation temperature (°C) (Table 1). The terms AB, AC, and BC denote the interaction effects between variables, while A2, B2, and C2 represent the quadratic effects. Furthermore, the response surface plots (Figure 2) and the comparison between predicted and experimental results for the optimal treatment (Table 6) indicated that a lower inoculum density (105 CFU/mL), moderate temperature (30°C), and a fermentation duration of 7–10 days yielded the highest acetic acid production (up to 15.65 g/L), whereas higher densities or shorter fermentation times resulted in much lower acetic acid production (< 2 g/L). These results highlight the importance of balancing time, temperature, and bacterial concentration to maximize acetic acid production while minimizing undesirable conditions. Similarly, a previous study on vinegar production from liquid jaggery using RSM identified temperature, inoculum concentration, and fermentation time as key factors affecting acetic acid production, achieving a maximum concentration above 3.5% (w/v). This agreement further supports the critical role of these operational parameters in optimizing vinegar fermentation systems [42]. Verifying experiments performed under three optimized conditions showed that the actual acetic acid contents were slightly lower than predicted, with deviations ranging from 0.41 to 0.46 g/L, indicating that the regression model is accurate, reliable, and suitable for predicting acetic acid production. Among the three optimal treatments, the combination of 6.7 × 10⁵ cells/mL, 9.59 days, and 30.08°C produced the highest acetic acid content, reaching 19.55 g/L, which was slightly higher than that of the other treatments. Therefore, this condition was selected as the standard for subsequent experiments. This result is consistent with the prediction of the Box-Behnken model, indicating both high acetic acid production efficiency and good reliability of the statistical model.
The production of vinegar from various kinds of fruits has become increasingly popular due to its high nutritional value. Nevertheless, in most studies, no additional processing steps are applied after the completion of acetic fermentation. In this study, an additional step was introduced by supplementing mango juice into the final vinegar [43–45]. Mangoes are nutrient-dense fruits rich in vitamins that boost the immune system, support recovery, act as antioxidants, and promote eye and skin health [46]. At a supplementation level of 50%, reducing sugar increased from 3.23 to 23.83 g/L, total phenolic content from 538.97 to 973.18 mg GAE/L, and antioxidant capacity from 29.51% to 56.61%, although acetic acid concentration decreased. Sensory evaluation indicated that 40% mango juice provided the best balance of flavor (score 4.65/5), whereas 30% perceived as overly acidic and 50% masked the characteristic vinegar taste. These findings suggest that moderate addition of mango juice enhances both nutritional value and consumer acceptability.
Before mango juice supplementation, fermentation at 100 mL and 1,000 mL under optimal conditions yielded similar acid contents (19.80 and 18.85 g/L), with only slight differences in antioxidant capacity and reducing sugar. The higher residual sugar at 1,000 mL suggested reduced substrate utilization, likely due to uneven static fermentation. A significant decrease in total phenolic content (564.85 to 514.63 mg GAE/L) and a slight reduction in antioxidant capacity (29.52% to 26.58%) were observed when scaling up, indicating possible losses of bioactive compounds during larger-scale fermentation. After adding 40% (v/v) mango juice, both fermentation volumes still maintained high acidity (13.30 g/L at 100 mL and 12.30 g/L at 1,000 mL) and strong antioxidant capacity, with the 100 mL sample consistently showing slightly higher phenolic and antioxidant values, though differences were not significant. Overall, mango juice supplementation enhanced product functionality, and scaling from 100 to 1,000 mL did not significantly affect the main quality parameters, though smaller volumes favored better retention of bioactive compounds. The individual fermentation metabolites were not characterized in detail, as the main focus was on process optimization and evaluation of physicochemical and functional properties. Although the results demonstrated efficient acetic acid production and improved functional attributes, a comprehensive analysis of metabolic compounds would provide deeper insight into the fermentation behavior of K. intermedius. Therefore, future studies should investigate the metabolic profile and key bioactive compounds to better elucidate the underlying mechanisms and further optimize the fermentation process.
Besides the assessment of physicochemical parameters and sensory evaluation, the final product was also analyzed for lead content and microbiological parameters. Microbiological and heavy metal analyses, which are obligatory parameters for non-alcoholic beverages, were analyzed according to the safety standards of QCVN 6-2:2010/BYT. The results in Table 10 demonstrated that the mango drinking vinegar is safe for consumption and has promising potential as a high-value functional product [17]. Sensory evaluation showed high acceptance, with scores for clarity (4.30/5), color (4.75/5), smell (4.06/5), and taste (4.35/5). Although taste received the lowest score, dilution before consumption could enhance overall flavor perception.
The optimal conditions for mango vinegar fermentation were successfully established, enabling efficient acetic acid production while maintaining desirable functional properties and stable performance at the laboratory scale, demonstrating feasibility for scale-up. The use of K. intermedius is particularly recommended, not only for its recognized ability to produce bacterial cellulose but also for its high acetic acid production efficiency, strong tolerance to acidic conditions, and stable fermentation performance compared to conventional acetic acid bacteria. Furthermore, the addition of mango juice after fermentation significantly enhanced the functional properties of the final product, especially antioxidant capacity and phenolic content. Overall, these findings highlight the strong potential of mango drinking vinegar as a functional beverage and provide a promising approach for the value-added utilization of mango resources. Further studies on bioactive compounds, health-promoting effects, and process optimization for cost efficiency are needed to support commercialization.
CFU: colony-forming unit
GAE: gallic acid equivalent
RSM: Response Surface Methodology
TSS: total soluble solids
VTHL: Conceptualization, Investigation, Formal analysis, Writing—original draft. THTT: Investigation, Validation. NKH: Investigation, Formal analysis. AVTV: Investigation, Validation. KML: Investigation, Formal analysis. QTG: Formal analysis, Validation. CML: Methodology, Validation, Supervision. TNN: Conceptualization, Validation, Supervision. PXH: Conceptualization, Writing—review & editing, Supervision. All authors read and approved the submitted version.
The authors declare that they have no conflicts of interest.
The Vietnamese national law does not require ethical approval for sensory evaluation. There are no human ethics committees or formal documentation procedures available for sensory evaluation. The experimental protocol involving sensory evaluation was in accordance with Vietnamese standards and operational guidelines.
Informed consent to participate in the study was obtained from all participants.
Not applicable.
The raw data supporting the conclusions of this manuscript will be made available by the authors, without undue reservation, to any qualified researcher.
The research work was funded by Can Tho University (project code: [TSV2024-212]). The funder had no role in study design, data collection and analysis, decision to publish, or preparation of the manuscript.
© The Author(s) 2026.
Open Exploration maintains a neutral stance on jurisdictional claims in published institutional affiliations and maps. All opinions expressed in this article are the personal views of the author(s) and do not represent the stance of the editorial team or the publisher.
Copyright: © The Author(s) 2026. This is an Open Access article licensed under a Creative Commons Attribution 4.0 International License (https://creativecommons.org/licenses/by/4.0/), which permits unrestricted use, sharing, adaptation, distribution and reproduction in any medium or format, for any purpose, even commercially, as long as you give appropriate credit to the original author(s) and the source, provide a link to the Creative Commons license, and indicate if changes were made.

View: 351
Download: 8
Times Cited: 0