 Original Article

Affiliation:
1Faculty of Food Science and Nutrition, Universiti Malaysia Sabah, Kota Kinabalu 88400, Sabah, Malaysia
Affiliation:
1Faculty of Food Science and Nutrition, Universiti Malaysia Sabah, Kota Kinabalu 88400, Sabah, Malaysia
ORCID: https://orcid.org/0000-0001-7512-7397
Affiliation:
2Food Safety and Security Research Laboratory, Faculty of Food Science and Nutrition, Universiti Malaysia Sabah, Kota Kinabalu 88400, Sabah, Malaysia
ORCID: https://orcid.org/0000-0003-4143-4975
Affiliation:
2Food Safety and Security Research Laboratory, Faculty of Food Science and Nutrition, Universiti Malaysia Sabah, Kota Kinabalu 88400, Sabah, Malaysia
ORCID: https://orcid.org/0000-0002-6682-207X
Affiliation:
3Faculty of Science and Technology, Universiti Malaysia Sabah, Kota Kinabalu 88400, Sabah, Malaysia
ORCID: https://orcid.org/0000-0002-3726-6828
Affiliation:
4Faculty of Engineering Technology and Science, Higher College of Technology (HCT), Abu Dhabi P.O Box 25026, United Arab Emirates
ORCID: https://orcid.org/0000-0003-4886-496X
Affiliation:
2Food Safety and Security Research Laboratory, Faculty of Food Science and Nutrition, Universiti Malaysia Sabah, Kota Kinabalu 88400, Sabah, Malaysia
Email: idamsah@ums.edu.my
ORCID: https://orcid.org/0000-0001-8637-5257
Explor Foods Foodomics. 2026;4:1010169 DOI: https://doi.org/10.37349/eff.2026.1010169
Received: February 15, 2026 Accepted: May 08, 2026 Published: June 17, 2026
Academic Editor: Zuhaib F Bhat, Livestock Products Technology, SKUAST-Jammu, India
Aim: This study aimed to evaluate the effects of incorporating tarap flour (TF) at 0–20% substitution levels into high-protein wheat flour blends on dough rheology, bread quality, nutritional composition, and consumer acceptance.
Methods: Composite flours containing 0–20% TF were prepared and assessed using farinograph and texture profile analysis to characterise dough rheology. Bread produced from these flours was evaluated for physical properties, crumb texture, crust colour, and proximate composition. Sensory evaluation and a consumer test (n = 100) were conducted to determine acceptability and purchase intention.
Results: Increasing TF levels significantly increased dough consistency (464.16–522.25 Farinograph Unit (FU)) while decreasing water absorption (58.70–55.30%), dough development time (6.68–4.51 min), and dough stability (8.90–4.54 min). Dough hardness rose from 1.42 to 2.02 N. Higher TF substitution increased loaf weight (144.3–148.8 g) but reduced loaf volume (662–517 cm3) and specific volume (4.58–3.47 cm3/g), with crumb hardness increasing from 12.56 to 22.35 N. Crusts became darker as lightness decreased (61.09–48.13) and browning index increased (20.65–48.20). Nutritionally, TF increased ash, crude fibre, carbohydrate, and total dietary fibre, while slightly lowering protein and fat. Sensory scores were highest at 5% TF and lowest at 20% TF. Consumer testing indicated moderate market potential, with 57% willingness to purchase.
Conclusions: Limited substitution of wheat flour with TF, particularly at around 5%, can produce bread with improved fibre and mineral content while maintaining acceptable technological and sensory quality. Higher substitution levels negatively affect dough performance and consumer acceptance, indicating that moderate inclusion is most suitable for product development.
The food processing industry continues to grow, and consumer demand for ready to eat foods, particularly bakery products, has increased, with baked goods increasingly formulated using composite flours to meet evolving preferences for convenient and nutritious products [1–3]. The use of composite flour has become an attractive option for bakery producers, driven largely by economic factors such as reducing reliance on imported raw materials like wheat flour, and research has shown that composite flour blends can improve nutritional and functional attributes of bakery products, including bread [4, 5]. Consequently, composite flour production represents a practical alternative while also encouraging diversification of flours derived from local agricultural resources to enhance nutritional quality and product variety in bakery applications [6–8].
The utilisation of local agricultural sources such as fruits, vegetables, herbs, and tuber crops has been increasingly promoted by small and medium enterprises in the development of innovative food products, as composite flour research continues to emphasise functional and nutritional enrichment from diverse raw materials. Previous studies have highlighted the potential of composite flour derived from various underutilised crops, including legumes, tubers, and pseudocereals, for enhancing the quality of baked goods such as bread through improved nutrient profiles and functional properties [9–12]. Composite flour development not only emphasises product quality but also nutritional value that can benefit consumer health, with research demonstrating that blending locally sourced flours can increase dietary fibre, protein, and bioactive compounds in bakery products [13–15]. This has contributed to the diversification of bakery products in the market, particularly bread, as producers explore composite formulations that respond to both health trends and sustainability goals [16].
Bread is one of the most widely consumed bakery products, as modern consumers increasingly prefer foods that are convenient, portable, and quick to consume, and it remains a staple carbohydrate source in global diets [17]. Bread is typically produced from wheat flour, sugar, salt, yeast, and water, with wheat flour’s gluten proteins imparting the structural and textural qualities characteristic of leavened bread [18]. To ensure the commercial viability of composite-flour-based bread, systematic scientific studies are required to determine optimal processing methods and formulation strategies for producing high-quality bread, and recent research has focused on formulating functional bread blends using alternative flours from legumes, tubers, and other sources to improve nutritional profiles while maintaining sensory acceptability [19–23]. This has led many researchers to investigate the use of composite flour in bread production. Previous studies suggest that wheat flour substitution up to approximately 10–20% can produce acceptable bread quality without significantly compromising sensory attributes [24]. However, higher substitution levels often negatively affect bread quality due to gluten dilution and weakened dough structure, leading to changes in loaf volume and texture that challenge acceptability [25].
Tarap (Artocarpus odoratissimus), a fruit native to Borneo, remains underutilised despite emerging evidence of its nutritional and compositional potential. Recent research highlights the fruit’s value as a source of carbohydrates, minerals, phytochemicals, and other bioactive compounds that could support food product development and nutritional applications [26, 27]. Converting tarap into flour provides an opportunity to develop value-added bakery products while promoting the use of indigenous crops. Therefore, this study aims to evaluate the effects of incorporating tarap composite flour in bread production on rheological, physical, and sensory properties. A consumer acceptance test was also conducted to assess product quality and potential market acceptance.
Tarap fruits were sourced from several locations in Sabah, Malaysia (Sipitang, Tamparuli, Papar, Kota Belud, and Telipok). A total of 50 mature-green fruits were selected using predefined morphological and maturity criteria to ensure uniformity. Fruits were identified as mature-green based on an average diameter of 15–25 cm, greenish peel colour, and coarse but sparsely distributed surface hairs. Additional maturity indicators included the absence of a strong ripe aroma and the production of a firm, dull sound when lightly tapped. The edible pulp was firm and low in juiciness, confirming suitability for flour processing. Pulp from all fruits was pooled across locations, thoroughly homogenised, and used as a representative sample to minimise location-related variability.
For flour preparation, the fruits were cut open, and the pulp was separated from the core and seeds, then sliced into smaller pieces. The pulp was washed with water and soaked in 0.05% sodium bicarbonate solution for 5 minutes before draining. The pooled pulp was homogenised prior to drying to minimise variability between fruits and ensure a representative flour sample. The treated pulp was dried in a cabinet oven at 40°C for 12 hours. The dried material was milled and sieved to a particle size of < 250 µm.
The resulting tarap flour (TF) was used to prepare composite flours for bread production. High-protein wheat flour (Bake With Me Sdn. Bhd.) served as the base flour, and TF was incorporated at substitution levels of 5–20%, as presented in Table 1. The selection of TF substitution levels (5–20%) was based on preliminary trials conducted prior to the main experiment. These trials indicated that substitution levels below 5% produced minimal observable effects on dough and bread characteristics, while levels above 20% resulted in poor dough handling and undesirable bread quality. Therefore, the range of 5–20% was selected to ensure measurable effects while maintaining acceptable processing and product quality. To ensure consistency, all flours were sieved (< 250 µm) prior to blending. The measured flours were then thoroughly homogenised using a mechanical mixer according to the specified formulations. Finally, the composite flours were properly labelled and stored in airtight containers until further analysis and bread making.
Formulation of tarap composite flour.
| Sample | Tarap flour (%) | High-protein wheat flour (%) |
|---|---|---|
| TCF0 | 0 | 100 |
| TCF1 | 5 | 95 |
| TCF2 | 10 | 90 |
| TCF3 | 15 | 85 |
| TCF4 | 20 | 80 |
TCF: tarap composite flour.
Tarap composite bread was prepared using tarap composite flour, water, sugar, dry yeast, and salt. Bread was produced using high-protein tarap composite flour formulations (TCF0–TCF4) as described in Table 2, following the AACC [28] straight-dough method. The ingredient formulation for tarap composite bread is presented in Table 2.
Formulation of tarap composite bread (based on 100% composite flour).
| Sample | High-protein wheat flour (%) | Tarap flour (%) | Total composite flour (%) | Water (%) | Salt (%) | Dry yeast (%) | Sugar (%) | Vegetable oil |
|---|---|---|---|---|---|---|---|---|
| TCF0 | 100 | 0 | 100 | 63.0 | 1.5 | 1.0 | 1.5 | 2.0 |
| TCF1 | 95 | 5 | 100 | 63.0 | 1.5 | 1.0 | 1.5 | 2.0 |
| TCF2 | 90 | 10 | 100 | 63.0 | 1.5 | 1.0 | 1.5 | 2.0 |
| TCF3 | 85 | 15 | 100 | 63.0 | 1.5 | 1.0 | 1.5 | 2.0 |
| TCF4 | 80 | 20 | 100 | 63.0 | 1.5 | 1.0 | 1.5 | 2.0 |
TCF: tarap composite flour. All formulations were standardised to a 100% composite flour basis, with other ingredients kept constant.
Dry yeast and sugar were first activated in a small amount of warm water and allowed to stand for 5 minutes until foam formation was observed. The activated yeast mixture was then added to the sieved composite flour in a mixer (Kenwood, UK). Water was gradually added while mixing at low speed for 1 minute. Salt and vegetable oil were subsequently incorporated, and mixing continued at low speed for 1 minute, followed by medium speed for 2 minutes, and finally at high speed until full dough development was achieved. The dough was then subjected to bulk fermentation (first fermentation) by resting in the mixing bowl, covered with a damp cloth at room temperature (~27–30°C) for 10 minutes. After rounding, the dough was allowed to rest again for 10 minutes (intermediate proofing). The dough was then moulded and placed into greased baking tins. Final proofing (second fermentation) was carried out at 38°C for 1 hour 30 minutes. Baking was performed in a preheated oven at 190°C (bottom heat) and 210°C (top heat) for 35 minutes, or until a skewer inserted into the centre came out clean.
Farinograph analysis was conducted using a Brabender Farinograph (Farinograph-E, Brabender GmbH & Co. KG, Duisburg, Germany) in accordance with AACC [28] standard methods. Approximately 300 g of flour sample was weighed and placed in the mixing bowl. Water addition was automatically recorded by the instrument to achieve optimum dough consistency. Mixing was performed at 63 rpm at 30°C. Water absorption, dough development time, and dough stability were recorded.
Dough texture properties were evaluated using a texture profile analyser (Stable Microsystem, UK) equipped with a 5-kg load cell. A cylindrical probe (36 mm diameter) was used, and measurements were conducted in triplicate. Peak force was recorded as dough hardness. A 25 mm cylindrical probe was used to determine stickiness, the maximum negative force recorded during probe withdrawal from the sample and expressed in Newtons (N).
The proximate composition of the bread samples was analysed following standard AOAC [29] methods, with all determinations conducted in triplicate and results expressed on a wet-weight basis. Moisture content was determined using 2.00 ± 0.10 g of sample dried in a hot-air oven at 105°C for 24 h until constant weight. Ash content was measured using 2.00 ± 0.10 g of sample, which was first charred and then incinerated in a muffle furnace at 550°C in accordance with AOAC 900.02A. Protein content was analysed from 1.00 ± 0.05 g of sample using the Kjeldahl method (AOAC 955.04), where nitrogen obtained after digestion, distillation, and titration was converted to crude protein using a factor of 4.7. Fat content was determined from 2.00 ± 0.10 g of sample using a Soxhlet 2050 extraction system with petroleum ether (40–60°C) as the solvent. Crude fibre was quantified through sequential digestion with 1.25% H2SO4 and 1.25% NaOH, followed by drying at 100°C and ashing at 550°C to constant mass. Total carbohydrate content was estimated by difference (Nitisewojo, 1995) by subtracting the percentages of moisture, ash, protein, and fat from 100%. Total dietary fibre was determined using enzymatic–gravimetric procedures based on AOAC 991.43 and 985.29 and AACC 32-07.01 and 32-05.01, employing a Megazyme total dietary fibre assay kit (Megazyme International, Wicklow, Ireland).
Bread loaves were allowed to cool at room temperature for 1 h prior to analysis. Loaf weight was recorded using a digital balance, while loaf volume was determined by the rapeseed displacement method according to AACC [28]. Specific volume (cm3/g) was calculated as the ratio of loaf volume to loaf weight, and bread density (g/cm3) was expressed as the ratio of loaf weight to loaf volume. Crust colour was measured using a Minolta CM-5/CR-type spectrophotometer (Minolta, Japan). Colour values were recorded in the CIE L*a*b* colour space, where L* denotes lightness, a* represents redness–greenness, and b* indicates yellowness–blueness. Measurements were performed under a D65 illuminant with a 2° standard observer in accordance with CIE colour measurement recommendations. TPA was conducted on bread samples on the same day of baking. Slices (2 cm thick) were taken from the central portion of each loaf. Bread hardness was defined as the peak force during the first compression cycle (first bite) and reported in Newtons.
A hedonic sensory evaluation was conducted according to the protocols described by Mamat et al. [30] to determine the most preferred bread formulation based on multiple sensory attributes. Fifty semi-trained panelists were recruited from students of the Faculty of Food Science and Nutrition (FSMP), Universiti Malaysia Sabah. The panelists included both male and female participants, aged between 18 and 40 years. Panelists were provided with bread samples and a hedonic evaluation form. Samples were evaluated for colour, taste, texture, hardness, and overall acceptability using a 7-point hedonic scale ranging from 1 (dislike extremely) to 7 (like extremely), with intermediate points representing dislike moderately (2), dislike slightly (3), neutral (4), like slightly (5), and like moderately (6). All bread samples were prepared on the same day as the sensory evaluation to ensure freshness and consistency. The formulation receiving the highest overall acceptability score was selected as the optimal bread formulation.
A consumer acceptance test was conducted on the final bread product derived from the optimal formulation identified in the hedonic test. The purpose of this test was to evaluate general consumer acceptance and estimate purchase potential. The consumer test was carried out at Gaya Street Market, Kota Kinabalu, Sabah, Malaysia, involving 100 randomly selected participants representing diverse demographic backgrounds. Participants were clearly informed about the study objectives, evaluation procedures, and their right to withdraw at any time, and verbal informed consent was obtained prior to participation. Respondents were asked about their purchase intention and perceived market potential if the product were commercialised.
All analyses were conducted in triplicate unless otherwise stated. Proximate and physical analyses were performed in triplicate using a completely randomised design, and results were expressed as mean ± standard deviation. Sensory evaluation was conducted using fifty semi-trained panelists, and mean scores were used to determine the most preferred formulation and attributes. All data were analysed using one-way analysis of variance (ANOVA) at a 5% significance level (p < 0.05), followed by Tukey’s post hoc test for multiple comparisons. Statistical analyses were performed using SPSS version 27.0.
Farinograph measurements showed that dough consistency increased as the proportion of TF increased, with values rising from 464.16 FU (Farinograph Unit) in TCF0 to 522.25 FU in TCF4 (Table 3). Significant differences (p < 0.05) were observed at higher substitution levels. Water absorption decreased progressively from 58.70% to 55.30%, with significant reductions at higher TF incorporation. Dough development time declined from 6.68 min to 4.51 min, and dough stability decreased from 8.90 min to 4.54 min, both showing significant differences among formulations. Taken together, these farinograph results indicate clear changes in dough mixing behaviour as TF substitution increased.
Rheological properties of tarap composite flour dough.
| Sample | Consistency (FU) | Water absorption (%) | Dough development time (min) | Dough stability (min) |
|---|---|---|---|---|
| TCF0 | 464.16 ± 1.89b | 58.70 ± 1.01 | 6.68 ± 0.08a | 8.90 ± 1.09a |
| TCF1 | 484.05 ± 2.04ab | 58.50 ± 0.04 | 6.12 ± 0.11a | 7.20 ± 1.25ab |
| TCF2 | 505.00 ± 2.15a | 57.10 ± 0.11 | 5.52 ± 0.14a | 6.00 ± 0.34b |
| TCF3 | 518.50 ± 4.60a | 56.00 ± 0.09 | 5.08 ± 0.27b | 5.85 ± 0.26b |
| TCF4 | 522.25 ± 2.22a | 55.30 ± 0.28 | 4.51 ± 0.17c | 4.54 ± 0.15c |
Values are expressed as mean (n = 3) ± standard deviation. Different superscript letters within the same column indicate significant differences at p < 0.05. TCF: tarap composite flour; TCF0: 0% tarap flour; TCF1: 5% tarap flour; TCF2: 10% tarap flour; TCF3: 15% tarap flour; TCF4: 20% tarap flour; FU: Farinograph Unit.
Consistent with the farinograph findings, TPA of the dough showed changes with increasing TF incorporation. Dough hardness increased progressively from 1.42 N in TCF0 to 2.02 N in TCF4 (Table 4). However, based on the statistical analysis, TCF0 and TCF1 were not significantly different (p > 0.05), while TCF2, TCF3, and TCF4 exhibited significantly higher hardness values (p < 0.05) compared to the lower substitution levels. For adhesiveness, values increased from 40.80 N to 60.02 N with increasing TF substitution. TCF0, TCF1, and TCF2 did not differ significantly from each other (p > 0.05), whereas TCF4 showed significantly higher adhesiveness (p < 0.05). TCF3 displayed intermediate behaviour and was not significantly different from either the lower or higher substitution groups. These results indicate that significant changes in dough texture properties become more pronounced at higher TF substitution levels (> 10% for hardness and > 20% for adhesiveness), which may subsequently influence the physical characteristics of the baked bread.
Texture profile analysis (TPA) of tarap composite flour dough.
| Sample | Hardness (N) | Stickiness (N) |
|---|---|---|
| TCF0 | 1.42 ± 0.24b | 40.80 ± 0.20b |
| TCF1 | 1.65 ± 0.35b | 43.10 ± 0.42b |
| TCF2 | 1.87 ± 0.20a | 48.55 ± 0.58b |
| TCF3 | 1.95 ± 0.74a | 52.60 ± 0.12ab |
| TCF4 | 2.02 ± 0.21a | 60.02 ± 0.25a |
Values are expressed as mean (n = 3) ± standard deviation. Different superscript letters within the same column indicate significant differences at p < 0.05. TCF: tarap composite flour; TCF0: 0% tarap flour; TCF1: 5% tarap flour; TCF2: 10% tarap flour; TCF3: 15% tarap flour; TCF4: 20% tarap flour.
Table 5 presents the physical characteristics of tarap composite bread, including loaf weight, volume, specific volume, and density. Bread weight increased from 144.3 g in the control to 148.8 g at 20% substitution, with significant differences appearing at the highest level. In contrast, bread volume decreased progressively from 662 cm3 to 517 cm3, with significant reductions as substitution increased. Specific volume declined from 4.58 to 3.47 cm3/g, while density increased from 0.21 to 0.28 g/cm3, although density differences were not statistically significant. Alongside these structural changes, noticeable differences were also observed in bread appearance.
Weight, volume, specific volume, and density of tarap composite bread.
| Sample | Weight (g) | Volume (cm3) | Specific volume (cm3/g) | Density (g/cm3) |
|---|---|---|---|---|
| TCF0 | 144.3 ± 0.08c | 662 ± 1.11a | 4.58 ± 0.14a | 0.21 ± 0.06 |
| TCF1 | 145.0 ± 0.04bc | 628 ± 0.54ab | 4.33 ± 0.06a | 0.23 ± 0.03 |
| TCF2 | 145.4 ± 0.15bc | 605 ± 0.32b | 4.16 ± 0.04ab | 0.24 ± 0.10 |
| TCF3 | 146.1 ± 0.24b | 574 ± 0.61c | 3.92 ± 0.05bc | 0.25 ± 0.08 |
| TCF4 | 148.8 ± 0.26a | 517 ± 1.05d | 3.47 ± 0.11c | 0.28 ± 0.05 |
Values are expressed as mean (n = 3) ± standard deviation. Different superscript letters within the same column indicate significant differences at p < 0.05. TCF: tarap composite flour; TCF0: 0% tarap flour; TCF1: 5% tarap flour; TCF2: 10% tarap flour; TCF3: 15% tarap flour; TCF4: 20% tarap flour.
Crust colour measurements showed that lightness (L*) decreased from 61.09 to 48.13 with increasing TF levels, with significant reductions beginning at 10% substitution. Redness (a*) increased from 0.92 to 4.23, and yellowness (b*) increased from 11.07 to 16.68, both showing significant differences across substitution levels (Table 6). The browning index increased from 20.65 to 48.20, with significant differences among samples. In parallel with colour changes, mechanical texture of the bread crumb was also affected. Bread hardness increased with higher TF incorporation, ranging from 12.56 N to 22.35 N, with significant differences observed from 10% substitution onward (Figure 1). Beyond physical and textural attributes, TF substitution also influenced the nutritional composition of the bread.
Crust colour parameters of tarap composite bread.
| Sample | L* | a* | b* | Browning index |
|---|---|---|---|---|
| TCF0 | 61.09 ± 1.29a | 0.92 ± 1.61d | 11.07 ± 1.41b | 20.65 ± 1.42e |
| TCF1 | 57.23 ± 1.26a | 1.55 ± 1.16c | 12.89 ± 1.15b | 26.98 ± 1.18d |
| TCF2 | 52.34 ± 1.19b | 2.86 ± 1.05b | 13.53 ± 1.10ab | 33.36 ± 1.97c |
| TCF3 | 49.02 ± 1.35b | 3.11 ± 1.28ab | 14.08 ± 1.13a | 37.89 ± 1.57b |
| TCF4 | 48.13 ± 1.04c | 4.23 ± 1.14a | 16.68 ± 1.04a | 48.20 ± 1.44a |
Values are expressed as mean (n = 10) ± standard deviation. Different superscript letters within a column indicate significant differences at p < 0.05. TCF: tarap composite flour; TCF0: 0% tarap flour; TCF1: 5% tarap flour; TCF2: 10% tarap flour; TCF3: 15% tarap flour; TCF4: 20% tarap flour.
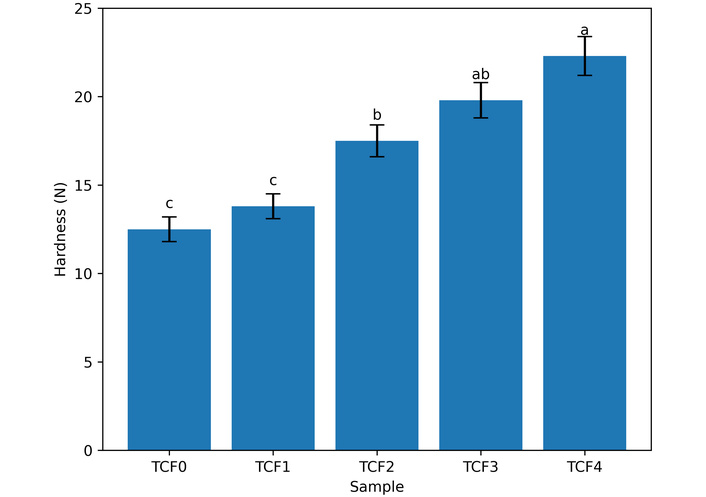
Bread hardness of composite flour samples. Values are presented as mean (n = 3) ± standard deviation. Bars with different letters indicate significant differences (p < 0.05). TCF: tarap composite flour.
Proximate composition and total dietary fibre of composite tarap bread (%) are summarised in Table 7. Moisture content decreased from 40.32% to 33.22%, with significant differences between the highest and lowest substitution levels. Protein content declined slightly from 10.13% to 9.76%, and fat content decreased from 1.14% to 0.92%. Ash content increased from 1.21% to 1.44%, and crude fibre increased from 10.42% to 10.81%. Carbohydrate content increased from 36.78% to 43.85%, showing significant differences. Total dietary fibre increased from 10.52% to 11.91%, although differences were not statistically significant. These compositional changes were accompanied by differences in sensory perception.
Proximate composition and total dietary fibre of composite tarap bread (%).
| Sample | Moisture | Ash | Crude fibre | Protein | Fat | Carbohydrate | Total dietary fibre |
|---|---|---|---|---|---|---|---|
| TCF0 | 40.32 ± 0.55a | 1.21 ± 0.03 | 10.42 ± 0.06b | 10.13 ± 0.11 | 1.14 ± 0.55 | 36.78 ± 0.13c | 10.52 ± 0.04 |
| TCF1 | 38.60 ± 0.34a | 1.26 ± 0.02 | 10.59 ± 0.13b | 10.09 ± 0.25 | 1.08 ± 0.06 | 38.38 ± 0.11bc | 10.96 ± 0.05 |
| TCF2 | 36.24 ± 0.87ab | 1.32 ± 0.04 | 10.62 ± 0.35b | 10.02 ± 0.17 | 1.06 ± 0.96 | 40.74 ± 0.19b | 11.38 ± 0.03 |
| TCF3 | 35.56 ± 0.72ab | 1.38 ± 0.03 | 10.69 ± 0.23b | 9.97 ± 0.31 | 0.98 ± 0.31 | 41.42 ± 0.12b | 11.72 ± 0.03 |
| TCF4 | 33.22 ± 0.85b | 1.44 ± 0.05 | 10.81 ± 0.25a | 9.76 ± 0.12 | 0.92 ± 0.24 | 43.85 ± 0.10a | 11.91 ± 0.04 |
Values are expressed as mean (n = 3) ± standard deviation. Different superscript letters within the same column indicate significant differences (p < 0.05). TCF: tarap composite flour; TCF0: 0% tarap flour; TCF1: 5% tarap flour; TCF2: 10% tarap flour; TCF3: 15% tarap flour; TCF4: 20% tarap flour.
Sensory scores differed significantly among samples (Table 8) and generally declined as the level of TF increased. The control (TCF0) and bread with 5% TF (TCF1) recorded the highest ratings for texture (6.22–6.29), taste (6.67–6.88), colour (6.22–6.74), and overall acceptability (6.33–6.48), with no significant differences between them (p > 0.05). Bread containing 5% TF achieved the highest overall acceptability, with most respondents rating it between “moderately liked” and “liked.” From TCF2 onwards, significant reductions were observed in most attributes: texture decreased from 5.89 (TCF2) to 3.67 (TCF4), taste from 5.59 to 3.70, colour from 4.20 to 3.13, and overall acceptability from 5.70 to 3.48. Bread containing 20% TF (TCF4) consistently received the lowest scores for all attributes. Perceived hardness also differed significantly among samples, showing a continuous decline from the highest score in TCF0 (6.50) to the lowest in TCF4 (2.11).
Sensory evaluation of composite tarap bread.
| Sample | Texture | Taste | Hardness | Colour | Overall acceptability |
|---|---|---|---|---|---|
| TCF0 | 6.22 ± 0.11a | 6.67 ± 0.09a | 6.50 ± 0.15a | 6.74 ± 0.06a | 6.33 ± 0.07a |
| TCF1 | 6.29 ± 0.09a | 6.88 ± 0.04a | 5.89 ± 0.08b | 6.22 ± 0.17a | 6.48 ± 0.06a |
| TCF2 | 5.89 ± 0.05a | 5.59 ± 0.15b | 4.89 ± 0.04c | 4.20 ± 0.05b | 5.70 ± 0.04b |
| TCF3 | 4.13 ± 0.06b | 4.74 ± 0.11c | 3.44 ± 0.16d | 3.89 ± 0.04c | 4.25 ± 0.07c |
| TCF4 | 3.67 ± 0.13c | 3.70 ± 0.08d | 2.11 ± 0.05e | 3.13 ± 0.08d | 3.48 ± 0.14d |
Values are expressed as mean (n = 50) ± standard deviation. Different superscript letters within the same column indicate significant differences (p < 0.05). TCF: tarap composite flour; TCF0: 0% tarap flour; TCF1: 5% tarap flour; TCF2: 10% tarap flour; TCF3: 15% tarap flour; TCF4: 20% tarap flour.
To further validate these findings, consumer acceptance was evaluated under real-market conditions (Figure 2). Evaluation of the overall acceptability of composite tarap bread (Figure 2A) showed that 68% of respondents liked the bread, 13% were uncertain in their evaluation, and 19% did not like the bread produced. Furthermore, 57% of respondents indicated that they would purchase composite tarap bread if marketed, while 23% were unsure and 20% stated that they would not purchase the bread (Figure 2B). Overall, consumer acceptance was considered moderate.
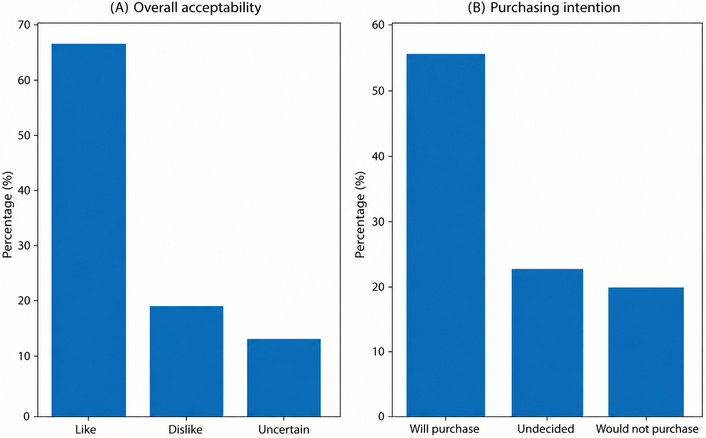
Consumer evaluation of composite tarap bread (n = 100). (A) Distribution of consumer liking toward composite tarap bread. (B) Consumer purchase intention for composite tarap bread if introduced to the market.
The rheological behaviour of tarap composite dough reflects the compositional differences introduced by TF, particularly its lower protein content relative to wheat flour. Proteins, especially glutenin and gliadin, play a central role in governing dough viscoelasticity, structure, and mixing tolerance in wheat-based systems, as gluten formation and hydrogen bonding strongly influence the dough’s ability to develop a cohesive and extensible network during mixing [31]. As TF substitution increased, farinograph measurements showed a progressive rise in dough consistency, indicating that protein dilution altered the balance of the dough matrix. With less gluten available to form a continuous viscoelastic network, the dough system likely became less extensible and more resistant to deformation, which is expressed instrumentally as higher apparent consistency. This increase in consistency, together with the observed reductions in water absorption, dough development time, and stability, can be attributed to gluten dilution and reduced protein–water interactions, as non-gluten components from TF compete for water and disrupt the formation of a continuous viscoelastic network.
This behaviour is consistent with the gluten dilution mechanism described earlier, where reduced protein availability limits water–protein interactions and hydration capacity [32]. The shorter dough development times recorded at higher TF levels further suggest that a weaker and less continuous protein network formed, requiring less time to reach peak consistency. In parallel, the decline in dough stability indicates reduced resistance to mechanical mixing, consistent with weakened gluten networks observed in substituted dough systems [33].
The observed changes in water absorption capacity of the tarap composite dough reflect the influence of flour composition on hydration behaviour, a result that aligns with current understanding of dough rheology. This behaviour reflects altered water distribution in the dough system, as non-gluten components compete with proteins and starch for available water. In addition, the lower protein content of TF compared to wheat flour further limits water-binding capacity, contributing to the overall decline in water absorption observed with increasing substitution levels. For example, Zhao et al. [34] reported that the addition of dietary fibre to wheat flour significantly modified water absorption and elasticity in dough, likely because fibre competes with gluten for water and disrupts normal hydration patterns in composite dough systems.
Similarly, studies on legume- and root-based composite flours have demonstrated that increased fibre and non-gluten fractions alter water binding and mixing characteristics, leading to lowered water absorption and changes in rheological behaviour relative to 100% wheat dough [22, 35]. The concurrent reductions in dough development time and dough stability further support the interpretation that compositional shifts specifically lower protein and modified water interactions weaken the dough’s capacity to form and sustain a strong gluten network during mixing.
Shorter dough development times and reduced dough stability at higher TF inclusion indicate the formation of a weaker and less cohesive gluten network that reaches its optimum more quickly but with lower structural strength. With fewer gluten-forming proteins available, the dough requires less time to develop yet becomes less tolerant to continued mixing and breaks down more easily under mechanical work. Because dough stability is a common indicator of gluten strength and mixing tolerance, its decline with increasing TF reflects reduced structural resilience and greater susceptibility to overmixing. Similar reductions in dough stability and development properties have been reported when wheat flour is partially substituted with non-wheat flours, reflecting gluten dilution and compositional effects on the protein network [32]. Such responses are typical in composite doughs where non-gluten flours introduce starches and fibre that compete for water and physically interrupt gluten continuity, limiting hydration and cross-linking of gluten strands. Together, gluten dilution and altered water distribution yield doughs that are less elastic and more fragile, a pattern widely observed in studies on wheat–non-wheat composite flour systems [36].
TPA further supports the influence of protein dilution and altered hydration on the structure of composite dough. In this study, TPA results showed that dough hardness and adhesiveness increased progressively with higher TF incorporation. This pattern aligns with established evidence that reducing the proportion of gluten-forming proteins, which are hydrophilic components that help create a cohesive and elastic network, generally results in dough that is firmer and less extensible [37]. Research on composite flours (e.g., wheat blended with legume or root crop flours) has similarly reported increases in dough firmness and changes in viscoelastic behaviour when gluten dilution occurs, linking greater hardness to the reduction of gluten network continuity and shifts in water distribution within the dough matrix [35, 38, 39]. The increased hardness observed may also be associated with reduced gluten elasticity and the presence of fibre-rich components, which promote a more compact and less extensible dough structure.
The increase in adhesiveness at higher TF levels also aligns with the known effects of altered water distribution in composite systems. With reduced water-holding capacity due to lower gluten content and increased non-gluten components (such as fibre and starch), more free water remains in the dough, contributing to stickier behavior during handling and increasing measured adhesiveness. Similar responses have been observed in studies replacing portions of wheat flour with non-gluten alternatives, where increased dough stickiness was attributed to limited protein hydration and the presence of free water in the system [40, 41].
The physical characteristics of bread made from composite flour clearly reflect the structural impact of gluten dilution. In this study, increases in TF substitution were accompanied by progressive decreases in loaf volume and specific volume and an increase in bread density. These trends are consistent with the central role of the gluten network in capturing fermentation gases and forming an elastic matrix that allows dough expansion during baking; when gluten is diluted by non-gluten components, gas retention is compromised and loaf expansion is reduced. Similar reductions in specific volume and overall loaf size have been documented in recent composite flour studies where wheat flour was partially substituted with alternative ingredients, resulting in decreased physical quality due to weakened gluten structure and disrupted gas-holding mechanisms (e.g., lower specific volume and firmer, denser crumb in breads with higher non-wheat proportions) [42]. Dahdah et al. [43] reported that as substitution levels of non-gluten flours increase, loaf volume tends to decline, and the resulting bread exhibits a more compact and dense structure, highlighting the importance of gluten continuity for optimal bread. This reduction in loaf volume and specific volume is directly linked to decreased gas retention capacity, as weakening of the gluten network limits the ability of the dough to trap and retain carbon dioxide during fermentation and baking.
Crust colour development in composite bread appears strongly influenced by formulation-driven compositional shifts, including increased carbohydrate, fibre, and natural pigments from TF. In the present results, higher TF substitution was associated with progressively darker crust colour (lower L* values) and higher redness (a*) and yellowness (b*) values, as well as an increased browning index. These changes align with known nonenzymatic browning mechanisms such as the Maillard reaction between reducing sugars and amino groups during baking, which produces brown melanoidin pigments and is a major contributor to crust colour formation in baked goods [44].
Studies on composite breads have similarly reported that adding non-wheat components with higher sugar and pigment contents leads to darker crust colour and increased browning intensity compared with 100% wheat bread, indicating that flour composition can significantly alter colour development during baking [45]. Additionally, the presence of natural pigments and differences in carbohydrate fractions can contribute to intensified redness and yellowness as substitution increases, supporting the interpretation that both Maillard reaction products and inherent colour compounds in TF influence crust colour progression in composite bread systems.
Bread crumb firmness is strongly influenced by both gluten structure and starch behaviour in baked products. In the present study, crumb hardness increased progressively with higher TF substitution indicating a firmer crumb structure at higher TF levels. This aligns with research showing that starch retrogradation, the process where gelatinised starch molecules, particularly amylopectin, reorganise and recrystallise contributes to increased firmness in baked products as they cool and age, particularly when gluten structure is weakened or diluted by non-wheat components [46].
The dilution of gluten proteins by TF likely reduces the continuity and elasticity of the protein network, which decreases gas retention during baking and leads to smaller gas cells and a denser crumb matrix that is measured as higher hardness. The presence of fibre from TF may further contribute to this effect by interfering with gas cell expansion and promoting the formation of a denser crumb structure. This interpretation is consistent with findings that reduced gluten strength and altered protein–starch interactions can accelerate texture firming in composite or fibre-rich breads [47]. Additionally, studies have shown that retrogradation of amylopectin which occurs as starch molecules reassociate after baking is a primary mechanism behind crumb hardening and increased firmness in starch-based foods, reinforcing the link between starch structural changes and harder crumb texture at higher substitution levels [48]. It should be noted that the water content was kept constant across all formulations and was not adjusted according to the water absorption capacity of the composite flours. As a result, the dough and bread characteristics may not represent fully optimised conditions for each substitution level. Adjusting water levels based on farinograph measurements could potentially improve dough handling and bread quality, particularly at higher TF substitution levels.
From a nutritional perspective, the incorporation of TF shifted the bread’s compositional profile toward higher ash, crude fibre, carbohydrate, and total dietary fibre contents, while reducing protein and fat levels. The increase in ash content can be attributed to the higher mineral content of TF compared to wheat flour. Similarly, the rise in crude fibre and total dietary fibre is associated with the naturally higher fibre fraction present in tarap pulp, which contributes additional non-digestible carbohydrates to the formulation. The increase in total carbohydrate content is likely due to the higher carbohydrate composition of TF. In contrast, the observed reduction in protein content is mainly due to the dilution of wheat gluten proteins as TF replaces part of the wheat flour. Likewise, the decrease in fat content may be related to the relatively lower lipid content of TF compared to wheat flour, resulting in an overall reduction in fat proportion in the composite bread. These compositional shifts reflect the inherent nutritional profile of TF and the substitution effect, where wheat flour is progressively replaced by a fibre- and mineral-rich ingredient. This pattern is consistent with published findings that partial substitution of wheat flour with alternative plant-based flours rich in fibre and micronutrients generally increases the mineral and dietary fibre content of bread products. For example, composite breads enriched with millet and sorghum flours showed elevated dietary fibre and mineral levels compared with 100% wheat bread, illustrating that non-wheat inclusions can enhance nutritional properties even as protein and fat proportions change with substitution levels [49].
Similarly, composite bread studies have reported increased ash and dietary fibre contents due to the high mineral and indigestible carbohydrate fractions of substitute flours, supporting the idea that these ingredients can improve bakery product functionality and potential health benefits [4]. Higher total dietary fibre in composite bread aligns with broader evidence indicating that enrichment with high-fibre flours contributes beneficial digestive effects and can help position such products as value-added or functional foods. Although some composite breads may show reduced protein relative to a wheat control due to gluten dilution, this is a well-recognised outcome when substituting wheat with plant-derived flours, and does not necessarily detract from the overall nutritional value when balanced by gains in fibre and minerals [18].
Sensory responses indicate that consumer perception is closely tied to the structural and compositional changes induced by flour substitution. In the present study, increasing TF levels were associated with progressive declines in texture, taste, colour, and overall acceptability, while the lowest substitution level (TCF1) remained comparable to the control. Excessive gluten dilution is known to produce denser crumb structures and darker crusts, which can negatively influence consumer perception. Similar trends have been reported in recent composite-bread studies, where higher levels of non-wheat flour led to lower sensory scores due to changes in crumb firmness and colour, whereas moderate substitution-maintained acceptability [50, 51]. These findings support the idea that limited substitution can preserve bread structure while introducing novel sensory notes. Maintaining this balance between familiarity and innovation is widely recognised as a key factor in successful composite bread development [13].
The observed drop in scores for hardness, texture, and overall acceptability with increasing TF substitution also matches recent studies showing that consumers are sensitive to changes in crumb softness and elasticity, attributes that are directly influenced by gluten network integrity and water distribution in the dough matrix [36]. Conversely, moderate substitution levels appear capable of balancing familiarity with novel sensory characteristics, suggesting that a limited inclusion of TF can enhance nutritional value and introduce unique flavour/aroma without severely compromising acceptability [52].
Consumer testing further illustrates the practical implications of reformulating bread with TF. In the present results, a moderate level of overall acceptance was observed, with a majority of respondents indicating they “like” or “will buy” the composite bread, while smaller proportions were uncertain or not willing to purchase. This pattern reflects the importance of aligning sensory attributes with consumer expectations in product development. Although consumers may be open to novel bakery products, they often prefer familiar texture and flavour profiles similar to conventional wheat bread, as shown by recent sensory research on composite flours where moderate substitution-maintained acceptability but higher inclusion reduced consumer liking. Consumer evaluation remains an essential step in assessing market potential and guiding formulation optimisation, particularly when innovation (e.g., introduction of unique aroma or texture from local ingredients) must be balanced with baseline sensory expectations [23].
Moderate acceptance levels, such as the approximately 57–60% “like” or “would buy” responses seen here, have also been noted in other composite bread products that incorporate alternative flours with distinct sensory profiles, highlighting that familiarity bias toward conventional bread can temper consumer enthusiasm even when nutritional or novel flavour attributes are present. This suggests that while some hesitation is expected, targeted formulation adjustments (e.g., optimising crumb softness or aromatic balance) may enhance consumer appeal without eroding the functional benefits introduced by TF enrichment. Overall, the consumer testing supports the discussion that innovation in bakery product development must carefully integrate sensory quality with market expectations to realise both acceptance and niche potential.
The incorporation of TF demonstrates meaningful potential as a partial wheat flour substitute in breadmaking, particularly for developing bakery products that utilise local, underexploited crops. The study confirms that careful control of substitution levels is essential to maintain technological functionality and consumer appeal. TF offers opportunities for nutritional enrichment and product diversification while supporting local agricultural sustainability. Future research should focus on improving dough functionality at higher substitution levels, for example through the use of gluten enhancers, enzymes, or hydrocolloids to strengthen the dough network. Optimisation of particle size and pre-treatment methods for TF may also enhance its baking performance. Shelf-life studies and staling kinetics would provide valuable insights into storage stability. In addition, broader consumer studies across different demographic groups and market settings are recommended to better assess commercialisation potential. Exploring the application of TF in other bakery products could further expand its utilisation and economic value.
FU: Farinograph Unit
TF: tarap flour
TPA: texture profile analysis
NM: Investigation, Writing—original draft. MER: Validation, Methodology. AHAA: Funding acquisition, Visualization. NMR: Validation, Formal analysis. MSS: Visualization, Methodology. NRP: Validation, Formal analysis. HM: Conceptualization, Writing—review & editing, Supervision. All authors read and approved the submitted version.
The authors declare that they have no conflicts of interest.
This study involved human participants in sensory and consumer acceptance evaluations. The study was conducted in accordance with institutional guidelines of Universiti Malaysia Sabah. Due to the low-risk, non-invasive nature of the study, it was considered exempt from formal ethical review under institutional practice. All participants were fully informed about the study objectives, procedures, and their right to withdraw at any time without penalty. Written informed consent was obtained from all participants prior to participation. No personal or sensitive data were collected, and participant confidentiality was maintained throughout the study.
Written informed consent was obtained from all participants prior to their inclusion in the study. The study involved low-risk, non-clinical food tasting activities conducted as part of routine teaching and learning. Participants were fully informed about the study objectives, evaluation procedures, and their right to withdraw at any time without penalty before providing their consent.
Informed consent to publication was obtained from relevant participants.
The raw data supporting the conclusions of this manuscript will be made available by the authors, without undue reservation, to any qualified researcher.
This work was supported by research grant [FRGS-EC/1/2024/STG04/UMS/02/7]. The funders had no role in study design, data collection and analysis, decision to publish, or preparation of the manuscript.
© The Author(s) 2026.
Open Exploration maintains a neutral stance on jurisdictional claims in published institutional affiliations and maps. All opinions expressed in this article are the personal views of the author(s) and do not represent the stance of the editorial team or the publisher.
Copyright: © The Author(s) 2026. This is an Open Access article licensed under a Creative Commons Attribution 4.0 International License (https://creativecommons.org/licenses/by/4.0/), which permits unrestricted use, sharing, adaptation, distribution and reproduction in any medium or format, for any purpose, even commercially, as long as you give appropriate credit to the original author(s) and the source, provide a link to the Creative Commons license, and indicate if changes were made.

View: 358
Download: 12
Times Cited: 0
