Protocol


Affiliation:
1Infection, Immunity and Inflammation Department, Great Ormond Street Institute of Child Health, University College London, WC1N 1EH London, United Kingdom
2Department of Clinical Pharmacy, College of Pharmacy, Princess Nourah Bint Abdulrahman University, Riyadh 11564, Saudi Arabia
Email: naaalabdulkarim@hotmail.com
ORCID: https://orcid.org/0000-0002-5887-8583


 ,
,
Affiliation:
1Infection, Immunity and Inflammation Department, Great Ormond Street Institute of Child Health, University College London, WC1N 1EH London, United Kingdom
3Department of Pharmacy, Great Ormond Street Hospital for Children NHS Foundation Trust, WC1N 3JH London, United Kingdom
ORCID: https://orcid.org/0000-0002-4561-7173
Explor Drug Sci. 2026;4:1008167 DOI: https://doi.org/10.37349/eds.2026.1008167
Received: May 09, 2026 Accepted: June 11, 2026 Published: July 15, 2026
Academic Editor: Jinwei Zhang, Chinese Academy of Sciences, China
The article belongs to the special issue Precision Dosing: From Therapeutic Drug Monitoring to AI-Driven Personalization
PKPDindex() is a free and open-source R package for analysing pharmacokinetic/pharmacodynamic (PK/PD) indices, including AUC/MIC, Cmax/MIC, and T>MIC. Development was motivated by previously identified inconsistencies in PK/PD index modelling and reporting practices. The package fits eight variations of the Emax model to data and compares model performance using the Akaike information criterion (AIC) and R2 values. As input, the package requires a dataset containing PK/PD indices and a response variable. As output, it generates tables summarising all fitted models, identifies the best-fitting model for each index, and produces customisable plots of model fits with parameter estimates. PKPDindex() is freely available on CRAN (https://CRAN.R-project.org/package=PKPDindex).
The pharmacokinetic and pharmacodynamic (PKPD) index describes the relationship between a drug’s concentration and its therapeutic effect [1]. The most commonly applied indices include the ratio of the area under the concentration–time curve to the minimum inhibitory concentration (AUC/MIC), the ratio of the maximum drug concentration to the MIC (Cmax/MIC), and the proportion of time during which drug concentrations exceed the MIC (T>MIC). These indices are essential to antimicrobial pharmacology, guiding dose selection, regimen optimization, and translational research across preclinical and clinical studies.
The PKPD indices are typically derived from dose fractionation studies, in which different dosing regimens are tested to determine the effect of the drug [2, 3]. Using these data, an Emax model can be fitted to describe the relationship between drug exposure and antibacterial response. Key parameters of the Emax model include E0 (baseline effect without the drug), Emax (maximum effect the drug can achieve), EI50 (the value of the PK/PD index associated with 50% of the maximum effect), and γ (Hill coefficient, which determines the steepness of the curve) [4, 5]. The Emax model has eight possible variations, depending on whether the baseline effect is fixed or estimated to determine whether the drug has an inhibitory or stimulatory effect. Each of these models can be fitted to AUC/MIC, Cmax/MIC, and T>MIC to find the best index [4].
A recent systematic review highlighted the lack of a standardized approach to identifying the optimal PK/PD index [6]. In most published studies, R2 values are used to identify the best model and the optimal PK/PD index. However, R2 only reflects how well the model fits the data, without considering model complexity or the number of parameters [7, 8]. Consequently, reliance on R2 alone may favor more complex models and can lead to suboptimal model selection. For nonlinear Emax models, information-based criteria such as Akaike’s Information Criterion (AIC) and Bayesian Information Criterion (BIC) [9, 10] provide a more robust basis for model comparison because they consider both model fit and complexity [6, 8, 11, 12].
Despite the importance of accurately fitting Emax models to identify the optimal PK/PD index, no existing R/CRAN package provides a comprehensive method to fit all eight possible models and select the best one based on appropriate criteria. The aim was to develop an R package for public use, that offers a systematic and standardized method for fitting Emax models and finding the optimal PK/PD index.
PKPDindex() provides a tool for fitting Emax models to PKPD data. This package examines the relationship between drug concentration and biological response by applying a set of predefined Emax models to the provided dataset. It allows customization in terms of model selection, parameter initialization, and plot settings.
PKPDindex() is implemented in R and available through CRAN. Users require an R installation and PKPDindex package to perform the analyses described in this protocol. The package can be installed directly from https://CRAN.R-project.org/package=PKPDindex.
The PKPDindex() requires a dataset containing PKPD indices and a corresponding response variable that reflects the antimicrobial effect. Data should be provided as a standard R data frame, with each row representing an experimental condition or individual observation.
The PKPDindex() converts all column names to lowercase to prevent case-sensitivity issues. It also checks the presence of both the y_column (default name: “response”) and the predictor columns x_columns (default column name: auc_mic, cmax_mic, t_mic). If the dataset uses different column names, users can specify them manually within the function.
The y_column should be the log10-transformed change in cfu/mL (Δlog10 cfu/mL). Alternatively, users may supply raw cfu/mL counts at the initial CFU_init and 24-hour CFU_24 time points, in which case the function will automatically calculate the Δlog10 cfu/mL.
The user must calculate the x_columns from their PK model before analysis, since the function does not generate them. These include area under the concentration–time curve divided by the MIC auc_mic, peak drug concentration divided by the MIC cmax_mic, and time the drug concentration stays above the MIC t_mic.
The package validates that the required columns are present and contain numeric data. It does not automatically screen for zero values, skewness, or outliers. Model fitting failures are captured and reported in the output.
The PKPDindex() package defines eight nonlinear Emax models (m1–m8) (Table 1), each representing different combinations of key parameters: E0, Emax, EI50, and Hill coefficient. These models vary based on whether E0 and Emax are fixed or estimated during the fitting process. Additionally, some models incorporate the Hill coefficient to account for sigmoidal (S-shaped) dose-response curves. This flexibility allows the selection of the most appropriate model based on the complexity of the data and the biological system under study.
Emax model variants (m1–m8) defined in the PKPDindex() package.
| Formula | Model | Estimated parameter | Fixed parameter | Includes Hill coefficient |
|---|---|---|---|---|
| m1 | EI50 | E0, Emax | No | |
| m2 | EI50, “γ” | E0, Emax | Yes | |
| m3 | EI50, Emax | E0, “γ” | No | |
| m4 | EI50, Emax, “γ” | E0 | Yes | |
| m5 | EI50, E0 | Emax, “γ” | No | |
| m6 | EI50, E0, “γ” | Emax | Yes | |
| m7 | EI50, E0, Emax | “γ” | No | |
| m8 | EI50, E0, Emax, “γ” | None | Yes |
The eight Emax model variants represent alternative assumptions regarding baseline effect (E0), maximum effect (Emax), and the shape of the exposure–response relationship (Hill coefficient). In practice, there is no universally preferred model, and model selection should be driven by the observed data rather than predefined biological assumptions. Simpler models may be adequate when data are limited or do not support estimation of additional parameters, whereas more complex models may better capture nonlinear exposure-response relationships when sufficient information is available. The PKPDindex() package therefore fits all model variants and uses objective model-selection criteria to identify the most appropriate model for a given dataset.
Parameter initialization sets the starting values for Emax model fitting. By default, the Hill coefficient (γ) is initialized to 1, corresponding to the standard hyperbolic Emax model. This provides a neutral starting value for model fitting. E0 and Emax depend on the characteristics of the specific dataset. Therefore, users are required to specify initial values for E0 and Emax (E0_fix, Emax_fix) based on prior knowledge and data characteristics. Once these values are provided, the package automatically estimates an approximate EI50 starting value from the observed data. Alternatively, users may supply initial EI50 values through the EI50_init argument.
The EI50 estimate is derived from the PK/PD index value associated with a response halfway between the baseline effect (E0) and the maximum effect (Emax), calculated as:
Prepare a dataset containing the response variable and one or more PK/PD indices. By default, the response variable should be stored in a column named response and PK/PD indices in columns named auc_mic, cmax_mic, and t_mic. Alternative column names can be specified through the y_column and x_columns arguments. For demonstration purposes, the example dataset included with the package can be loaded using:
If different column names are used, they can be specified as follows:
Before fitting the models, provide values for E0_fix and Emax_fix. Optional starting values for EI50 may also be supplied through the EI50_init argument. If EI50_init is omitted, the package will estimate starting values automatically. For example, the initial parameter values can be defined as follows:
Execute the PKPDindex() function using the prepared dataset and specified initial parameter values. The package applies the nls() nonlinear least squares method in R to fit the models to the dataset. It iterates through each model, adjusts the parameters, and calculates the AIC and R2 to assess the model fit.
The control settings for the NLS algorithm were configured as follows: The maximum number of iterations (maxiter = 500), the fitting tolerance (tol = 1e–5) and the minimum step size factor (minFactor = 1e–7). Users can modify these control settings to accommodate different data characteristics.
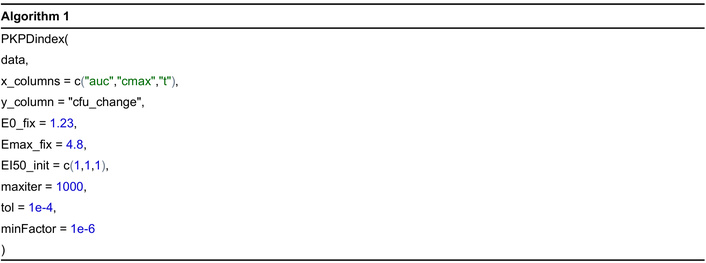
The package incorporates error handling to capture and report fitting failures, ensuring the analysis proceeds without interruption. Model fitting failures may occur when the nonlinear least squares algorithm is unable to identify parameter estimates that adequately describe the data, for example, because of insufficient information in the dataset, poor convergence, highly variable observations, or unsuitable starting values. Models that fail to converge are retained in the output and reported with a “Failure” status, while AIC, R2, and parameter estimates are reported as NA. Such models are excluded from best-model selection. The current version of the package relies on the convergence assessment provided by the underlying nls() algorithm and does not perform formal sensitivity analyses of starting parameter values, apply parameter bounds or constraints, or conduct additional evaluations of local minima, parameter identifiability, or fit stability. Users may specify alternative starting values through the function arguments and should assess the biological plausibility of fitted parameter estimates when interpreting results (Algorithm 1).
Model evaluation in the PKPDindex() package is based on two key performance metrics: the AIC and R2. AIC is used for model comparison, as it balances goodness-of-fit with model complexity. A lower AIC value indicates a better model fit. R2 is also calculated to provide an additional measure of how well the model explains the variability in the response data, with higher values indicating better explanatory power.
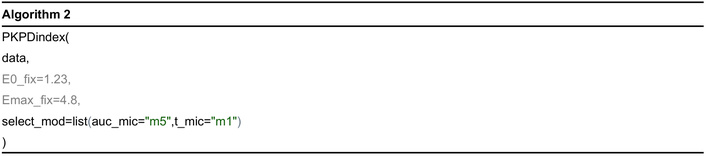
The model with the lowest AIC is selected as the best model for each PK/PD index. However, all model fits are summarized in the output, including their AIC, R2, and success status, enabling transparent evaluation. The package also offers a model manual selection using the select_mod argument (Algorithm 2).
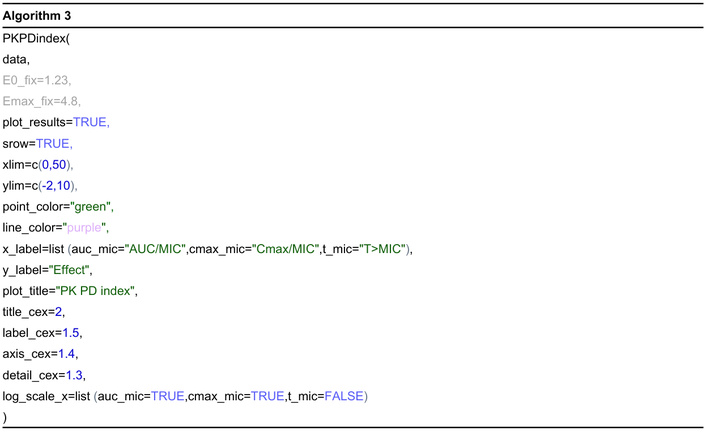
The function allows users to generate and customize the appearance of plots, including the colors of the data points point_color and fitted lines line_color, as well as adjust the axis limits (xlim and ylim), axis labels (x_label and y_label), and plot titles plot_title. Font sizes for titles title_cex, axis labels label_cex, axis tick labels axis_cex, and model annotation details detail_cex can also be adjusted. In addition, a log10 transformation can be applied to the x-axis for each PK/PD index through the argument log_scale_x to better visualize wide concentration ranges (Algorithm 3).
The PKPDindex() generates a list containing three key components. The All_Model_Results element provides a detailed summary of all models fitted for each PK/PD index, including performance metrics such as AIC, R2, and parameter estimates, along with the fit status for each model. The Best_Models component summarizes the best-fitting model for each index, including the key parameters (E0, Emax, Hill coefficient, EI50) and corresponding evaluation metrics AIC and R2 values. Lastly, the Plots element contains a list of plots for the best-fitting models. Table 2 shows an example of All_Model_Results output.
Example of the All_Model_Results output from the PKPDindex().
| PK/PD index | Model | AIC | R2 | E0 | Emax | gam | EI50 | Success |
|---|---|---|---|---|---|---|---|---|
| AUC/MIC | m1 | 36.82 | 71.33% | 1.5 | 4.8 | 1 | 34.62 | Success |
| AUC/MIC | m2 | 32.18 | 79.43% | 1.5 | 4.8 | 0.66 | 38.24 | Success |
| AUC/MIC | m3 | 34.93 | 76.40% | 1.5 | 3.6 | 1 | 16.53 | Success |
| AUC/MIC | m4 | 33.58 | 80.04% | 1.5 | 10.71 | 0.47 | 572.63 | Success |
| AUC/MIC | m5 | 32.4 | 79.20% | 0.89 | 4.8 | 1 | 70.56 | Success |
| AUC/MIC | m6 | 33.28 | 80.33% | 1.11 | 4.8 | 0.79 | 60.74 | Success |
| AUC/MIC | m7 | 33.1 | 80.51% | 1 | 3.71 | 1 | 36.52 | Success |
| AUC/MIC | m8 | 33.52 | 81.99% | 0.65 | 2.21 | 5.14 | 23.11 | Success |
| Cmax/MIC | m1 | 65.56 | –20.66% | 1.5 | 4.8 | 1 | 12.65 | Success |
| Cmax/MIC | m2 | 58.87 | 21.85% | 1.5 | 4.8 | 0.28 | 29.23 | Success |
| Cmax/MIC | m3 | 60.96 | 13.25% | 1.5 | 1.95 | 1 | 0.16 | Success |
| Cmax/MIC | m4 | NA | NA | NA | NA | NA | NA | Failure |
| Cmax/MIC | m5 | 56.39 | 30.99% | 0.31 | 4.8 | 1 | 56.2 | Success |
| Cmax/MIC | m6 | 57.37 | 34.40% | 0.12 | 4.8 | 2.08 | 39.28 | Success |
| Cmax/MIC | m7 | NA | NA | NA | NA | NA | NA | Failure |
| Cmax/MIC | m8 | NA | NA | NA | NA | NA | NA | Failure |
| T>MIC | m1 | 78.02 | –124.92% | 1.5 | 4.8 | 1 | 59.18 | Success |
| T>MIC | m2 | NA | NA | NA | NA | NA | NA | Failure |
| T>MIC | m3 | 60.52 | 15.15% | 1.5 | 1.86 | 1 | 0.07 | Success |
| T>MIC | m4 | NA | NA | NA | NA | NA | NA | Failure |
| T>MIC | m5 | NA | NA | NA | NA | NA | NA | Failure |
| T>MIC | m6 | NA | NA | NA | NA | NA | NA | Failure |
| T>MIC | m7 | 62.47 | 15.36% | 1.3 | 1.66 | 1 | 0.09 | Success |
| T>MIC | m8 | NA | NA | NA | NA | NA | NA | Failure |
The table lists all fitted Emax model variants for each PK/PD index, including the model’s name, Akaike Information Criterion (AIC), and R2. Parameter estimates for each model E0 (baseline effect), Emax (maximum effect), gam (Hill coefficient), and EI50 (PK/PD index producing 50% of the maximal effect), are also shown, along with the success of model fitting. EI50 is expressed in the same unit as the corresponding PK/PD index.
When plot_results=TRUE, the PKPDindex() automatically generates plots that visualize the relationship between each PK/PD index (AUC/MIC, Cmax/MIC, T>MIC) and the pharmacodynamic response. Figure 1 shows an example of the expected plot output. For each index, the function displays the best-fitting model curve alongside the observed data points, allowing direct visual assessment of model performance. Each plot also displays the fitted model's key parameters and performance metrics including AIC, R2, E0, Emax, γ, and EI50, which are annotated directly on the graph.
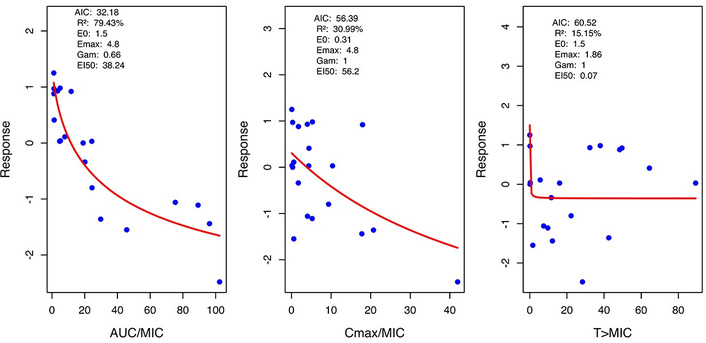
Example of output plot from the PKPDindex(). The plot shows the optimal Emax models selected for each PK/PD index based on the lowest AIC values. Model performance is summarised by the corresponding R2, E0, Emax, Hill coefficient, and EI50 estimates displayed on each plot.
AUC/MIC: area under the concentration–time curve to the minimum inhibitory concentration
Cmax/MIC: maximum drug concentration to the minimum inhibitory concentration
PK/PD: pharmacokinetic/pharmacodynamic
T>MIC: time above minimum inhibitory concentration
The authors would like to thank University College London (UCL) for providing access to research databases and necessary materials.
NA: Conceptualization, Methodology, Software, Validation, Formal analysis, Writing—original draft, Writing—review & editing. JFS: Conceptualization, Supervision, Validation, Writing—review & editing. The authors read and approved the submitted version.
The authors declare that they have no conflicts of interest.
Not applicable.
Not applicable.
Not applicable.
The PKPDindex package, including the example datasets and source code used in this protocol, is publicly available through the Comprehensive R Archive Network (CRAN) at https://CRAN.R-project.org/package=PKPDindex. All data described in this manuscript are available within the package and can be accessed by users through CRAN.
NA received a scholarship funded by Princess Nourah bint Abdulrahman University. JFS was supported by a UK Medical Research Council fellowship (MR/008665/1). The funders had no role in study design, data collection and analysis, decision to publish, or preparation of the manuscript.
© The Author(s) 2026.
Open Exploration maintains a neutral stance on jurisdictional claims in published institutional affiliations and maps. All opinions expressed in this article are the personal views of the author(s) and do not represent the stance of the editorial team or the publisher.
Copyright: © The Author(s) 2026. This is an Open Access article licensed under a Creative Commons Attribution 4.0 International License (https://creativecommons.org/licenses/by/4.0/), which permits unrestricted use, sharing, adaptation, distribution and reproduction in any medium or format, for any purpose, even commercially, as long as you give appropriate credit to the original author(s) and the source, provide a link to the Creative Commons license, and indicate if changes were made.



View: 2007
Download: 21
Times Cited: 0