 Original Article


Affiliation:
Mahmood Clinical Pharmacology Consultancy, Rockville, MD 20850, USA
Email: Iftekharmahmood@aol.com


Explor Drug Sci. 2026;4:1008160 DOI: https://doi.org/10.37349/eds.2026.1008160
Received: March 03, 2026 Accepted: April 20, 2026 Published: May 27, 2026
Academic Editor: Xiqun Jiang, Nanjing University, China
Aim: Two empirical methods were used to predict the absolute bioavailability (F) of medicines in adults and children following oral administration in the absence of intravenous (IV) dosing. This study systematically evaluates the predictive performance of Equation 1 to predict F in adults and children.
Methods: Equation 3 [F = Q/(Q + CLoral)] was used for the prediction of F in adults and children. In Equation 3, clearance is the observed oral clearance following oral administration of a medicine and Q is either liver blood or plasma flow rate. The predictive performance of Equation 3 was evaluated in adults and children for three categories of medicines; medicines which are mainly metabolized in the liver, medicines which are metabolized both in the liver and the gut, and medicines which are mainly renally excreted. From the literature, oral clearance and F values for adults and children were obtained. The predictive performance of these two methods (blood or plasma flow rate) was assessed by comparing the predicted F of the medicines used in this study with the observed F (obtained from clinical studies).
Results: More than 90% predicted F values were within 0.5–2-fold prediction error in adults and children by both methods for all three categories of medicines. Plasma flow rate provided slightly better results than the blood flow rate.
Conclusions: The proposed methods indicate that the estimation of F of medicines in adults and children is possible with reasonable accuracy (within 0.5–2-fold prediction error). The method is useful to estimate F, especially in children, because it is not ethical to administer medicines by both IV and oral routes to children just for the sake of estimating F.
Absolute bioavailability (F) is defined as the fraction of a dose that reaches the systemic circulation following extravascular administration, such as oral, intramuscular, or subcutaneous administration of a medicine as compared to an intravenous (IV) dose [1]. F is equal to 1 following IV administration of a medicine because the entire amount of the dose reaches the systemic circulation [1].
F is estimated following IV and oral administration of a medicine. F is the ratio of area under the curve (AUC) following oral and IV administration, adjusted for differences in the dose. For example, following an IV and oral administration of a medicine, the F of a medicine can be estimated from Equation 1.
Where AUC is the AUC following IV and oral administration.
In Equation 1, AUC can be replaced by clearance (CL) since CL = dose/AUC, and Equation 1 can be written as follows:
Clinical pharmacokinetic (PK) studies following oral and IV administration are conducted for the estimation of F in adults and children. There are, however, many instances when it is not possible to administer a medicine by both oral and IV routes to estimate F. Therefore, methods have been proposed to estimate F following only the oral route of administration [2, 3]. The method utilizes oral clearance (without administration of an IV dose) of a medicine, and then, using the liver blood flow, F is estimated [2, 3].
This method is useful not only for the estimation of F in adults but also possibly in children (not evaluated before). It is unethical to administer a medicine to children both by IV and oral route just for the estimation of F. Therefore, the oral route of administration without giving an IV dose can be helpful to estimate F in children.
Many factors impact the oral absorption of medicines in adults and children. These factors are related to the anatomical and physiological characteristics of the gastrointestinal tract, dietary habits, blood flow through the gut and the liver, and the enzymatic activities of metabolizing enzymes in the liver and the gut [4]. All of these physiological factors, along with the formulation of medicines, become more complicated in the pediatric population. The impact is more pronounced on younger children, such as neonates and toddlers [4]. Hence, the rate and the extent of absorption of a medicine vary from one age group to another, impacting the bioavailability of medicines.
Previously, Mahmood [5] predicted the F of medicines in children using predicted pediatric clearance from adult clearance. The predicted F in children by Mahmood’s proposed [5] method was within 0.5–1.5-fold prediction error for 93% of observations (n = 28 data points).
The proposed method of Gibaldi et al. [2] and Perrier et al. [3] has not been systematically evaluated. Therefore, the objective of this study was to assess the predictive performance of the method proposed by Gibaldi et al. [2] and Perrier et al. [3] for the prediction of F of medicines in adults and children. Their proposed method only requires oral clearance of medicines without administering an IV dose. The following three categories of medicines were used to assess the predictive performance of the method for the estimation of F in adults and children.
Medicines metabolized only in the liver (adults);
Medicines metabolized both in the liver and the gut (adults);
Medicines excreted by the renal route (adults);
In children, all three categories of medicines were pooled together since there was not enough data in children to categorize them separately.
Equation 3 was used to predict F following oral administration in adults and children [2, 3].
In Equation 3, Q is the liver blood flow (1,600 mL/min in adults) [6], and CLoral is the clearance following oral administration of a medicine.
Although Equation 3 was advocated for liver blood flow, in this study, liver plasma flow (850 mL/min in adults) was also used (in Equation 3) mainly because the concentrations of most medicines are measured in plasma.
The predictive performance of the proposed method was assessed by comparing the predicted F of medicines used in this study with the observed F (obtained from clinical studies). Medicines used in this analysis for the prediction of F were obtained from the literature (F studies). In these studies, subjects received both IV and oral doses; the studies were cross-over, and with matching age. The exception being itraconazole and ibuprofen bioavailability studies in children. The oral and IV data were obtained from two different studies (matching age and dose adjusted) and were not cross-over (S81, S82, S85, S86, References in supplementary materials).
In order to determine the liver blood flow in children of different ages, an allometric model was developed. The liver blood flow values were obtained from Björkman [6] from neonates to adults and the following allometric Equation 4 using body weight and the liver blood flow was developed to predict liver blood flow in children of different age groups.
Allometrically predicted liver blood flow was then used in Equation 3 to predict F in children of different age groups.
In Equation 3, in place of liver blood flow, liver plasma flow rate (850 mL/min in adults) and allometrically derived plasma flow rate in children (neonates to adolescents) were also used. The following allometric model using body weight and the plasma flow rate (55% of blood flow) was developed to predict plasma flow rate in children of different age groups.
Allometrically predicted liver plasma flow rate was then used in Equation 3 to predict F in children of different age groups.
There are medicines that are metabolized both in the liver and the gut. This may lead to reduced F for medicines that are metabolized in the liver as well as in the gut, as compared with those medicines that are only metabolized in the liver [7]. Therefore, the predictive power of the proposed method (Equation 3) for such medicines (metabolism both in the liver and the gut) was also evaluated.
The predictive power of the proposed method was compared with the observed F values (obtained from clinical studies). Prediction fold-errors of 2 (0.5–2), 0.5–1.5 (a 50% prediction error on either side of 1), and 0.7–1.3 (a 30% prediction error on either side of 1) were used for the assessment of the predictive performance of the proposed method (Equation 3) [8, 9]. In this study, a 0.5–2-fold prediction error was considered a good prediction of F, mainly due to the wide variability in the observed F values across the age groups. The predicted fold-error was calculated as follows:
Several statistical parameters, such as average fold error (AFE), absolute AFE (AAFE), bias, and root mean square error (RMSE), were also used (besides prediction fold errors) for comparison purposes (prediction of F between blood and plasma flow rates).
AFE, which is the log-transformed (log10) ratio of the predicted and observed AUC, was calculated using Equation 7. An AFE value of 1.0 indicates no prediction error.
where n is the number of observations.
AAFE was estimated using Equation 7, but all negative values were converted to positive values.
The RMSE was calculated as follows:
In this study, there were 32 medicines in adults that are mainly metabolized in the liver (Table S1) with 33 observations (data points) (two data points for voriconazole; one for extensive and the other for poor metabolizers). There were 20 medicines with 20 observations in adults that are metabolized in both the liver and the gut (Table S2). There were 22 medicines (22 observations) in adults, which are mainly renally excreted (Table S3). In children, there were 18 medicines (35 observations due to different age groups) (Table S4). In children, all three categories of medicines were pooled together since there was not enough data in children for age stratification. The ages of the children ranged from preterm to adolescence. The results of the study are presented separately for adults and children to evaluate the impact of age on the prediction of F by Equation 3. In Tables 1, 2, 3, and 4, the results of the study in terms of prediction fold-error in adults and children using Equation 3 are summarized. In Tables S1–S4, the values of oral clearance, observed and predicted F values for the studied medicines are provided. The relationship between predicted and observed F values from liver blood or plasma flow rate is shown in Figures 1, 2, 3, 4, 5, 6, 7, and 8.
Within fold-error and statistical analysis for the prediction of absolute bioavailability in adults (medicines metabolized in the liver) (n = 33).
| Fold-error and statistical analysis | ||
|---|---|---|
| Fold-error | LBF | LPF |
| 0.5–2 | 33 (100.0%) | 32 (97.0%) |
| 0.5–1.5 | 30 (90.9%) | 32 (97.0%) |
| 0.7–1.3 | 27 (81.8%) | 26 (78.8%) |
| > 2 | 0 (0.0%) | 0 (0.0%) |
| < 0.5 | 0 (0.0%) | 1 (3.0%) |
| Bias | 3.6 | –6.3 |
| RMSE | 10.2 | 11.0 |
| AFE | 1.10 | 0.87 |
| AAFE | 1.25 | 1.15 |
LBF: liver blood flow; LPF: liver plasma flow; AFE: average fold error; AAFE: absolute AFE; RMSE: root mean square error. % is of total observations.
Within fold-error and statistical analysis for the prediction of absolute bioavailability in adults (medicines metabolized in the liver and the gut) (n = 20).
| Fold-error and statistical analysis | ||
|---|---|---|
| Fold-error | LBF | LPF |
| 0.5–2 | 20 (100.0%) | 20 (100.0%) |
| 0.5–1.5 | 15 (75.0%) | 20 (100.0%) |
| 0.7–1.3 | 9 (45.0%) | 15 (75.0%) |
| > 2 | 0 (0.0%) | 0 (0.0%) |
| < 0.5 | 0 (0.0%) | 0 (0.0%) |
| Bias | 9.7 | –1.2 |
| RMSE | 14.7 | 11.9 |
| AFE | 1.30 | 0.91 |
| AAFE | 1.33 | 1.26 |
LBF: liver blood flow; LPF: liver plasma flow; AFE: average fold error; AAFE: absolute AFE; RMSE: root mean square error. % is of total observations.
Within fold-error and statistical analysis for the prediction of absolute bioavailability in adults (medicines excreted renally) (n = 22).
| Fold-error and statistical analysis | ||
|---|---|---|
| Fold-error | LBF | LPF |
| 0.5–2 | 22 (100.0%) | 22 (100.0%) |
| 0.5–1.5 | 19 (86.4%) | 20 (90.9%) |
| 0.7–1.3 | 14 (63.6%) | 18 (81.8%) |
| > 2 | 0 (0.0%) | 0 (0.0%) |
| < 0.5 | 0 (0.0%) | 0 (0.0%) |
| Bias | 11.6 | 0.6 |
| RMSE | 18.2 | 14.7 |
| AFE | 1.21 | 1.03 |
| AAFE | 1.26 | 1.22 |
LBF: liver blood flow; LPF: liver plasma flow; AFE: average fold error; AAFE: absolute AFE; RMSE: root mean square error. % is of total observations.
Within fold-error and statistical analysis for the prediction of absolute bioavailability in children (n = 35).
| Fold-error and statistical analysis | ||
|---|---|---|
| Fold-error | LBF | LPF |
| 0.5–2 | 33 (94.3%) | 35 (100.0%) |
| 0.5–1.5 | 23 (65.7%) | 31 (88.6%) |
| 0.7–1.3 | 18 (51.4%) | 28 (80.0%) |
| > 2 | 2 (5.7%) | 0 (0.0%) |
| < 0.5 | 0 (0.0%) | 0 (0.0%) |
| Bias | 15.2 | 4.7 |
| RMSE | 21.1 | 15.0 |
| AFE | 1.32 | 1.11 |
| AAFE | 1.37 | 1.19 |
LBF: liver blood flow; LPF: liver plasma flow; AFE: average fold error; AAFE: absolute AFE; RMSE: root mean square error. % is of total observations.
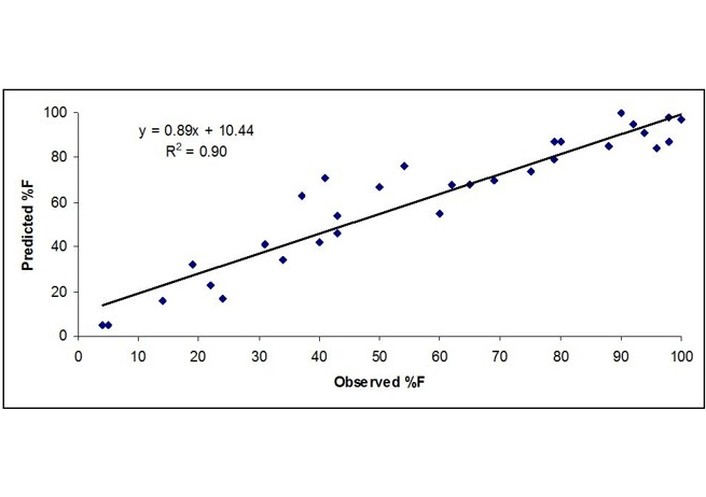
Observed vs. predicted %F in adults for drugs metabolized in the liver based on blood concentrations.
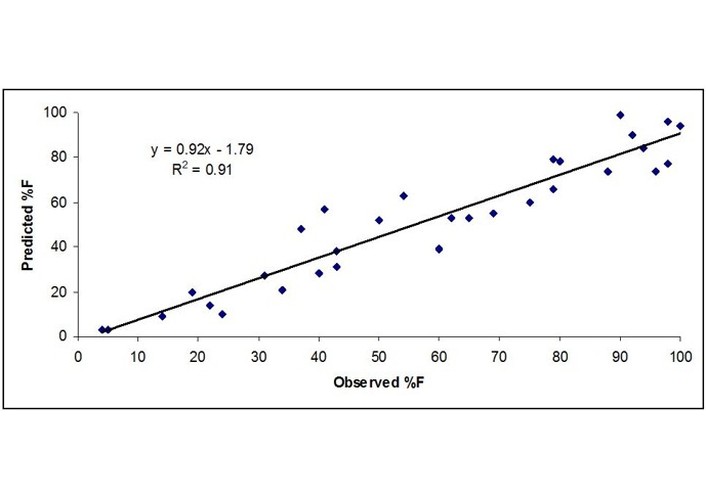
Observed vs. predicted %F in adults for drugs metabolized in the liver based on plasma concentrations.
Observed vs. predicted %F in adults for drugs metabolized in the liver and the gut based on blood concentrations.
Observed vs. predicted %F in adults for drugs metabolized in the liver and the gut based on plasma concentrations.
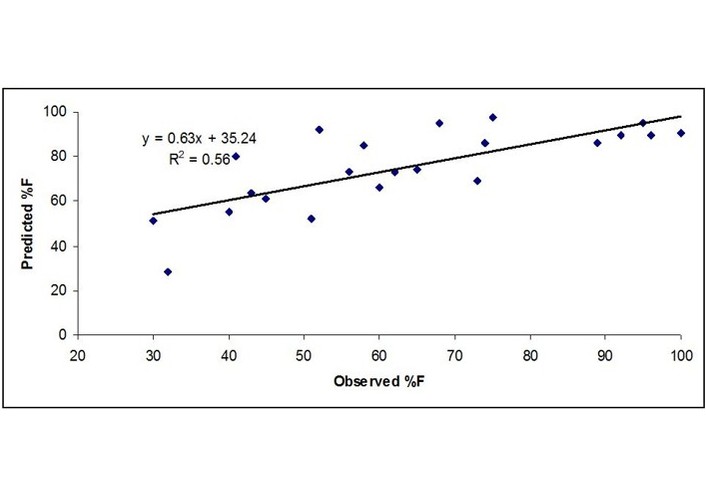
Observed vs. predicted %F in adults for renally excreted drugs based on blood concentrations.
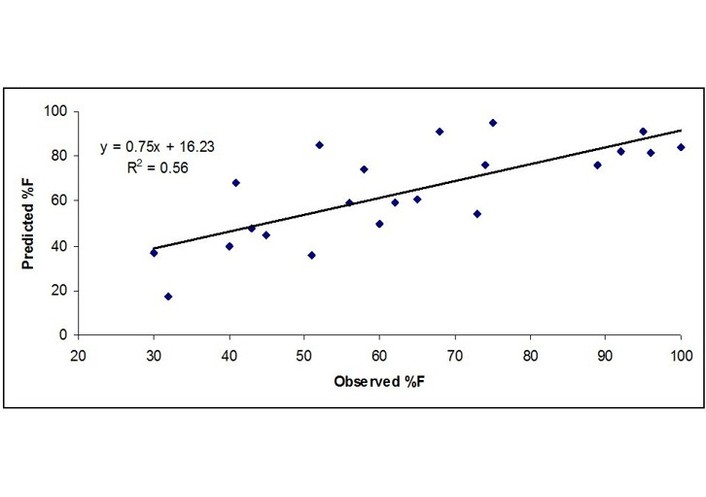
Observed vs. predicted %F in adults for renally excreted drugs based on plasma concentrations.
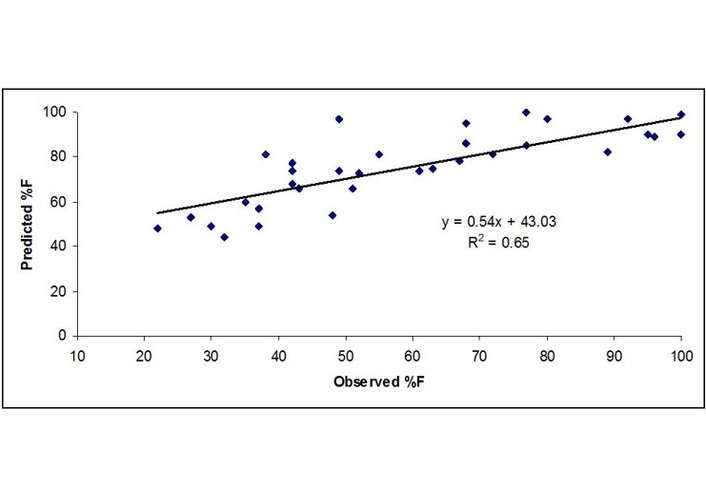
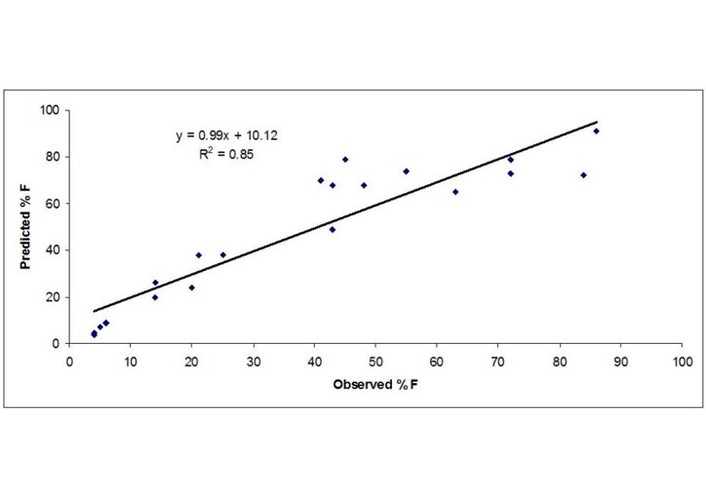
Observed vs. predicted %F in children for drugs mainly metabolized based on blood concentrations.
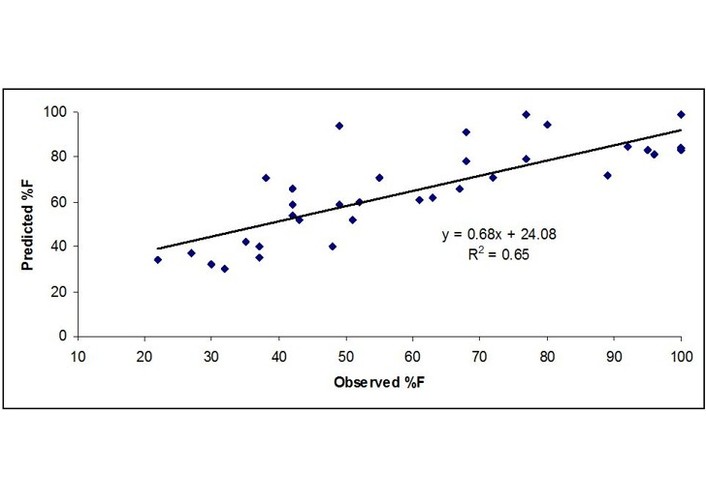
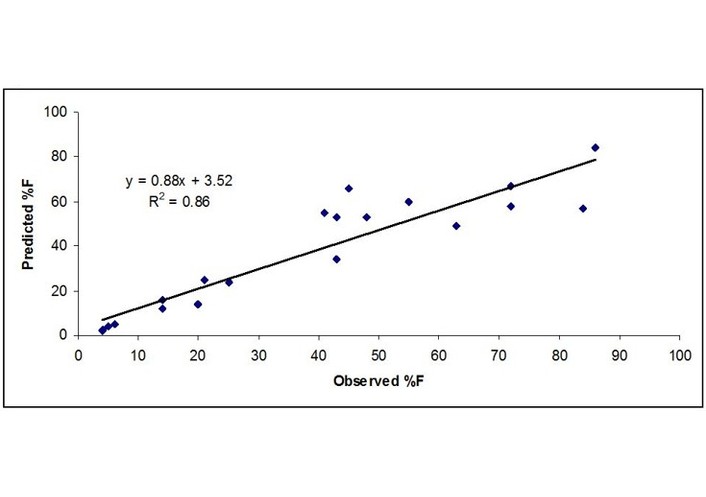
Observed vs. predicted %F in children for drugs mainly metabolized based on plasma concentrations.
Following oral administration and from liver blood flow (n = 33), 100%, 90.9%, and 81.8% observations were within 0.5–2, 0.5–1.5, and 0.7–1.3-fold prediction error, respectively. No observation was > 2-fold or < 0.5-fold prediction error (Table 1). The AFE, AAFE, bias, and RMSE were 1.10, 1.25, 3.6, and 10.2, respectively (Table 1).
Following oral administration and from liver plasma flow 97.0%, 97.0%, and 78.8% observations were within 0.5–2, 0.5–1.5, and 0.7–1.3-fold prediction error, respectively. One observation was < 0.5-fold prediction error (Table 1). The AFE, AAFE, bias, and RMSE were 0.87, 1.15, –6.3, and 11.0, respectively (Table 1).
Fold-error, AFE, bias, and RMSE values were almost similar for the prediction of F in adults by blood or plasma flow rate, indicating that both methods can be used to predict F in adults for medicines that are metabolized in the liver.
Following oral administration and from liver blood flow (n = 20), 100%, 75%, and 45% observations were within 0.5–2, 0.5–1.5, and 0.7–1.3-fold prediction error, respectively. No observation was > 2-fold or < 0.5-fold prediction error (Table 2). The AFE, AAFE, bias, and RMSE were 1.3, 1.33, 9.7, and 14.7, respectively (Table 2).
Following oral administration and from liver plasma flow (n = 20), 100%, 100%, and 75% observations were within 0.5–2, 0.5–1.5, and 0.7–1.3-fold prediction error, respectively. No observation was > 2-fold or < 0.5-fold prediction error (Table 2). The AFE, AAFE, bias, and RMSE were 0.91, 1.26, –1.2, and 11.9, respectively (Table 2).
Based on the fold-prediction-error, AFE, bias, and RMSE values, the results indicated that a slightly better prediction of F was obtained using plasma flow rate than the blood flow rate for this class of medicines (Table 2). AFE was very close to 1.0 for plasma flow rate-based prediction of F, whereas F was comparatively over-predicted (AFE = 1.3) based on blood flow rate.
Following oral administration and from liver blood flow (n = 22), 100%, 86.4%, and 63.6% observations were within 0.5–2, 0.5–1.5, and 0.7–1.3-fold prediction error, respectively. No observation was > 2-fold or < 0.5-fold prediction error (Table 3). The AFE, AAFE, bias, and RMSE were 1.21, 1.26, 11.6, and 18.2, respectively (Table 3).
Following oral administration and from liver plasma flow (n = 22), 100%, 90.9%, and 81.8% observations were within 0.5–2, 0.5–1.5, and 0.7–1.3-fold prediction error, respectively. No observation was > 2-fold or < 0.5-fold prediction error (Table 3). The AFE, AAFE, bias, and RMSE were 1.03, 1.22, 0.6, and 14.7, respectively (Table 3).
In terms of 0.5–2 and 0.5–1.5-fold prediction error, the prediction of F was comparable between blood and plasma flow rates, indicating that both methods can be used to predict F in adults for medicines which are renally excreted.
In children (n = 35), following oral administration of medicines from liver blood flow, 94.3%, 65.7%, and 51.4% observations were within 0.5–2-fold, 0.5–1.5-fold, and 0.7–1.3-fold prediction error, respectively. Two observations were predicted by more than a 2-fold prediction error (Table 4). The AFE, AAFE, bias, and RMSE were 1.32, 1.37, 15.2, and 21.1, respectively (Table 4).
Following oral administration from liver plasma flow (n = 35), 100%, 88.6%, and 80.0% observations were within 0.5–2-fold, 0.5–1.5-fold, and 0.7–1.3-fold prediction error, respectively. No observation was > 2-fold or < 0.5-fold prediction error (Table 4). The AFE, AAFE, bias, and RMSE were 1.11, 1.19, 4.7, and 15.0, respectively (Table 4).
Based on fold-prediction-error, AFE, AAFE, bias, and RMSE values, the results indicated that a better prediction of F in children was obtained using plasma flow rate rather than the blood flow rate (Table 4). AFE was only 11% (1.11) higher for the plasma flow rate-based prediction of F, and the blood flow rate-based prediction of F was higher by 32% (1.32).
The predictive power of Equation 3 was as good in children as in adults. In other words, age had no impact on the predictive power of Equation 3 for the prediction of F. Overall, the results of this study indicated that an acceptable (within 0.5–2 or 0.5–1.5-fold prediction error) prediction of F can be obtained from blood flow rate, but a slightly more accurate prediction of F can be obtained from plasma flow rate. When the prediction error range was tightened to 0.7–1.3, the prediction of F was more accurate from plasma flow rate than from blood flow rate.
Across all categories of medicines in adults and children, there were 110 observations, of which 108 (98%) and 87 (79%) observations were within 0.5–2-fold and 0.5–1.5-fold prediction error, respectively, when F was predicted from liver blood flow rate. Whereas, out of 110 observations, 109 (99%) and 103 (94%) observations were within 0.5–2-fold and 0.5–1.5-fold prediction error, respectively, when F was predicted from liver plasma flow rate.
Bioavailability is an important PK parameter, and in early drug development, F is regularly estimated. Low bioavailability (< 20%) of a medicine can be of concern because either the medicine has to be administered by the IV route or, if given by the extravascular route (mainly oral), higher doses are needed, which may not always be feasible. Clinical PK studies are conducted to estimate the F of a compound that requires both IV and oral or other routes of extravascular administration. For ethical reasons, children cannot be given a medicine by both IV and oral routes or by any other route of administration just for the sake of estimation of F. Furthermore, due to the formulation issue(s), a compound may not be administered both parentally and orally in adults or children. Under these circumstances, one would like to have some sense of the F without taking the traditional route.
The proposed method in this manuscript is helpful in the estimation of F following oral administration in adults and children. F is not age dependent; hence, F can be similar, higher, or lower in children across the age groups compared with adults. Many factors, such as age-dependent organ weights, enzymatic activity, and blood flow, can impact the metabolism of a medicine, which in turn can impact F [4, 10, 11].
Clearance of a medicine is a function of maturation of organs, and clearance increases with increasing age [10, 11]. Clearance and many physiological parameters, such as organ weights, blood flow, enzymatic activities, etc., are allometrically related to body weight or age (since age is well correlated with body weight) with variable exponents [10, 11]. The exponents of allometry are not fixed and widely vary and are data dependent [10, 11]. In this study, blood or plasma flow in children was determined allometrically using Equation 4 or Equation 5.
According to Equation 3, two parameters are required to estimate F, namely the oral clearance of a medicine and the liver or plasma blood flow rate. Application of liver blood flow in Equation 3 did provide a fairly good estimate of F (98% observations were within 0.5–2-fold prediction error), whereas 99% observations were within 0.5–2-fold prediction error when plasma flow rate was used in Equation 3. In terms of 0.5–2-fold prediction error, there was no difference in the prediction of F using blood or plasma flow rate in Equation 3. When the acceptance criteria were narrowed down to 0.5–1.5 or 0.7–1.3-fold, the accuracy of the prediction of F gradually decreased for both methods (Tables 1–4). In terms of 0.5–1.5-fold and 0.7–1.3-fold prediction error, there were 79% and 62% observations when the blood flow rate in Equation 3 was used. An improved prediction of F was noted when plasma flow instead of blood flow rate was used. In terms of 0.5–1.5-fold and 0.7–1.3-fold prediction error, there were 94% and 79% observations when the plasma flow rate in Equation 3 was used. This improvement in the prediction of F may be because the concentrations of medicines are mostly measured in plasma rather than blood.
F for a given medicine widely varies. This can be seen from the standard deviation around the mean values and the range (Tables S1–S4). Considering this high variability, a prediction error of 0.5–2-fold or 0.5–1.5-fold in the estimation of F from Equation 3 should be considered reasonably accurate.
In this study, in adults, there were three categories of medicines: (I) medicines metabolized only in the liver, (II) medicines metabolized by both the liver and the gut, and (III) medicines exclusively excreted in the urine. For all three categories of medicines, Equation 3 provided similar results (in terms of 0.5–2-fold prediction error) when blood or plasma flow rate was used (Tables 1–3). In children, F was predicted more accurately by plasma flow rate than by blood flow rate (Table 4).
It is interesting to note that Equation 3 predicted F with a similar degree of accuracy (in terms of 0.5–2-fold prediction error) for medicines metabolized in the liver or metabolized both in the liver and the gut (Tables 1 and 2) when liver blood flow was used. When the acceptance criteria were narrowed down to 0.5–1.5 or 0.7–1.3-fold, the accuracy of the prediction of F decreased for drugs metabolized by the liver and the gut as compared with drugs metabolized only in the liver when liver blood flow rate was used (Tables 1 and 2). On the other hand, Equation 3 predicted F with a similar degree of accuracy for medicines metabolized in the liver or metabolized both in the liver and the gut when liver plasma flow rate was used (Tables 1 and 2). The reason may be due to the overall clearance mechanism, either from the liver alone or from the liver and the gut together.
In short, the prediction of F requires both IV and oral clearance (or AUCs), but this study indicates that it is possible to predict F with a fair degree of accuracy just from oral clearance. Considering high variability in the observed F of medicines especially, in children, the methods (liver blood or plasma flow rate) as described in this study provide reasonably accurate estimates of F. Although, in Equation 3, liver blood flow rate was advocated but this study indicates that liver plasma flow rate provides slightly better results than the liver blood flow rate, especially in children. The predicted F values using blood flow rate were slightly higher than the predicted F values using plasma flow rate, but both methods reconciled well with the observed F. One can use both liver blood flow and plasma flow rates, and in this way, one can get a range of predicted F. The method may be useful to estimate F in children, where due to ethical reasons as well as the unavailability of a particular formulation of a product (IV or oral), F cannot be estimated in a clinical setting for children.
AAFE: absolute average fold error
AFE: average fold error
AUC: area under the curve
F: absolute bioavailability
IV: intravenous
PK: pharmacokinetic
RMSE: root mean square error
The supplementary tables for this article are available at: https://www.explorationpub.com/uploads/Article/file/1008160_sup_1.pdf.
IM: Conceptualization, Investigation, Data curation, Visualization, Formal analysis, Writing—original draft, Writing—review & editing. The author read and approved the submitted version.
The author has no conflicts of interest.
Since this study analyzed secondary data, ethical approval is not required.
Not applicable.
Not applicable.
The data and the references are provided in the main text and supplementary files.
No funding was received from any source.
© The Author(s) 2026.
Open Exploration maintains a neutral stance on jurisdictional claims in published institutional affiliations and maps. All opinions expressed in this article are the personal views of the author(s) and do not represent the stance of the editorial team or the publisher.
Copyright: © The Author(s) 2026. This is an Open Access article licensed under a Creative Commons Attribution 4.0 International License (https://creativecommons.org/licenses/by/4.0/), which permits unrestricted use, sharing, adaptation, distribution and reproduction in any medium or format, for any purpose, even commercially, as long as you give appropriate credit to the original author(s) and the source, provide a link to the Creative Commons license, and indicate if changes were made.



View: 2246
Download: 20
Times Cited: 0


