Original Article

Affiliation:
1V. I. Vernadsky Institute of Geochemistry and Analytical Chemistry, Russian Academy of Sciences, 119334 Moscow, Russia
Email: tak1907@mail.ru
ORCID: https://orcid.org/0000-0001-7812-9195
Affiliation:
2Voronezh State Medical University named after N. N. Burdenko, 394036 Voronezh, Russia
ORCID: https://orcid.org/0000-0003-2147-2886
Affiliation:
3Voronezh State University of Engineering Technologies, 394036 Voronezh, Russia
4MIP OOO “Sensorika–New Technologies”, 394036 Voronezh, Russia
Email: rumarkhanov@gmail.com
ORCID: https://orcid.org/0000-0001-5113-6096
Affiliation:
3Voronezh State University of Engineering Technologies, 394036 Voronezh, Russia
Explor Dig Dis. 2025;4:100591 DOI: https://doi.org/10.37349/edd.2025.100591
Received: March 05, 2025 Accepted: August 10, 2025 Published: September 14, 2025
Academic Editor: Tzi-Bun Ng, The Chinese University of Hong Kong, China
The article belongs to the special issue Helicobacter Pylori and Infection: Genomics, Diagnosis, Pathogenesis, Antibiotic Resistance, Microbiota, Cancer, Prevention and Therapeutics
Aim: The current state of the problem of stomach and duodenal diseases presupposes a mandatory examination of patients for the presence of Helicobacter pylori infection. Highly specific and sensitive diagnostic methods are known and applied, however, the problem of removal from clinical laboratories, isolation, including during a pandemic, dictates the search for new solutions.
Methods: Mobile diagnostic solutions based on portable devices with highly sensitive quartz piezoelectric sensors were investigated using a variety of devices (1–8 sensor elements) and data processing algorithms.
Results: A three-year volunteer monitoring study demonstrated that sensor arrays are informative for exhaled air and volatile skin compound analysis, enabling both point diagnostics and long-term tracking.
Conclusions: The study demonstrates the significant potential of sensor libraries in non-invasive diagnostics, particularly through the innovative application of facial skin projection for volatile marker detection. Three diagnostic approaches have been presented for assessing stomach and esophageal conditions via non-invasive monitoring of exhaled air composition and volatile skin compounds. The authors’ extensive experience in breath urease testing for both adults and children enabled purposeful modifications of diagnostic devices and data processing algorithms. A three-year volunteer monitoring study during anti-Helicobacter therapy and dietary interventions revealed high stability and informativeness of the urease test utilizing chemical sensor arrays. Notably, this research represents the first demonstration of facial organ projection as a method for stomach condition assessment and volatile molecule monitoring without sample collection, showcasing promising prospects for future diagnostic applications.
Diseases of the stomach and esophagus—including Helicobacter pylori (H. pylori) infections, mucositis, ulcers, and malignancies—represent serious global health challenges. H. pylori is recognized as one of the most prevalent and clinically significant pathogenic microorganisms worldwide. In 1994, the World Health Organization classified H. pylori as a group I carcinogen. Recent studies have also suggested potential associations between H. pylori infection and ischemic heart disease, hypertension, Raynaud’s phenomenon, migraine, bronchial asthma, and other conditions.
The simplification and cost reduction of chemical analytical instruments are key objectives in modern analytical chemistry. Advances in chemistry, physics, electronics, and mathematics have enabled the creation of miniature, low-cost, and user-friendly analytical tools whose performance rivals that of conventional instrumental methods. Test systems are prime examples of such tools, and their development—based on sensitive and selective chemical reactions—continues to expand in response to growing demand.
False-positive diagnostic outcomes can lead to unwarranted prescriptions of expensive treatments that may produce adverse effects; therefore, enhancing diagnostic reliability is of paramount importance. Noninvasive diagnostics and disease monitoring offer clear advantages, including painless sampling, the absence of unpleasant sensations, and complete protection against pathogen transmission (e.g., HIV, viral hepatitis). Among noninvasive approaches, sensor technologies for analyzing volatile compounds (VCs) in exhaled breath, saliva, and sweat have emerged as particularly promising.
Exhaled breath is one of the most commonly studied matrices in noninvasive diagnostics due to its ease of collection and the absence of reagents, test tubes, needles, or laboratory personnel. In a typical protocol, the patient exhales into a dedicated device, and analytes are detected using various analytical methods. H. pylori—spiral, microaerophilic bacteria—colonize the gastric mucosa upon ingestion. Their hallmark is the production of highly active urease, which alters local gastric acidity [1, 2]. The urease breath test, one of the most widely used noninvasive assays, involves administration of radiolabeled or non-radiolabeled urea; elevated H. pylori loads catalyze urea decomposition to ammonia and carbon dioxide, detectable in the patient’s exhaled air [3–5].
We have previously compared invasive and noninvasive diagnostic modalities for H. pylori infection [6], evaluating assays such as Christensen’s medium test, a rapid four-hour urease test, a one-minute rapid urease assay (CLO test), the Campy test, express tests (e.g., Biohit), and others. These assays vary in execution time (1 minute to 24 hours), medium (liquid or solid), and storage stability, which determines shelf life. Most urease assays demonstrate high sensitivity (85–98%) and, by some reports, specificity up to 100%. Their advantages—simplicity, low cost, and rapid results—facilitate “test-and-treat” clinical workflows, underpinning their widespread adoption in routine practice [7]. Chromogastroscopy further enhances diagnostic sensitivity and specificity, albeit at the expense of longer examination times [8]. Canadian and European guidelines particularly recommend noninvasive H. pylori diagnostics for pediatric populations [9].
Among serological methods, the enzyme-linked immunosorbent assay (ELISA) remains the most widely used worldwide [10–13]. Polymerase chain reaction (PCR) targeting the ureC gene fragment also permits detection of H. pylori, with fluorescence intensity enabling semi-quantitative estimation of bacterial load [14].
Recent years have seen growing interest in minimally invasive and noninvasive methods based not only on breath but also on saliva, sweat, and skin secretions. Sensor-based platforms—particularly arrays of piezoelectric quartz crystal microbalance (QCM) sensors—are of special interest due to their high sensitivity and selectivity. QCM sensors detect volatile organic and inorganic compounds (ICs) in exhaled breath by measuring frequency shifts associated with analyte adsorption. Sensor performance depends on coating materials, which may include synthetic polymers, nanomaterials, or natural biopolymers such as chitosan and alginate to confer selective binding. We demonstrated [6] that arrays of relatively nonspecific sensors can accurately detect ammonia and acetone—with specificity and sensitivity up to 96% and 90%, respectively—without elaborate sample preparation.
Concurrently, the composition of dermal sweat has been investigated for gastrointestinal disease diagnostics. Inflammatory processes alter sweat composition, enabling indirect assessment of gastric and intestinal health [15]. Although gas chromatography is commonly employed for sweat analysis, QCM sensor arrays have also yielded promising results. Priority volatile biomarkers for gastrointestinal and other pathologies are summarized in Table 1. Biomarkers—quantitative and objective indicators of disease presence, severity, therapeutic efficacy/toxicity, and patient stratification in clinical trials—are central to diagnostic development [16, 17].
Biomarkers—quantitative and objective indicators of disease presence, severity, therapeutic efficacy/toxicity, and patient stratification in clinical trials—are central to diagnostic development.
| Metabolites | Bioassay: disease/metabolic disorder/pathogenic condition |
|---|---|
| Acetaldehyde | Blood: aldehyde dehydrogenase deficiency, alcoholism |
| Propanol-1 | Saliva: celiac disease |
| Exhaled air: cancer | |
| Blood: diabetes | |
| Butanol-1 | Blood: diabetes |
| Propanone-2 | Blood: alcohol intoxication, kidney disease, pancreatic cancer |
| Exhaled air: allergic asthma, asthma | |
| Urine: breast cancer, lung cancer, diabetes | |
| Butanone-2 | Blood: alcohol intoxication |
| Exhaled air: asthma, cancer | |
| Urine: breast cancer | |
| Butanoic acid | Exhaled air: asthma |
| Saliva: dental caries | |
| Urine: AIDS, eosinophilic esophagitis | |
| 2-Hydroxypropanoic acid | Bile: malignant neoplasms of the liver and biliary tract |
| Blood: esophageal cancer, colorectal cancer, pancreatic cancer; insulin-dependent diabetes mellitus, myoclonic epilepsy and ragged red fiber disease, gastric esophageal cancer, acute ethanol intoxication, childhood liver failure syndrome | |
| Cell cytoplasm: oxygen starvation | |
| Urine: bladder cancer, colorectal; propionic acidemia, type 1 diabetes | |
| Butoxy-butane-1 | It is not a natural metabolite of the body and is only found in people who are exposed to this compound or its derivatives (poisoning) |
| Methanamine | Blood: uremia |
| Urine: eosinophilic esophagitis | |
| Acetone | Exhaled air samples |
| Diabetes, gastritis [15] | |
| Ethanol | Exhaled air, sweat |
| H. pylori infection, alcohol exposure [18] | |
| Isoprene | Sweat (with changes in metabolism) |
| Oncological diseases [18] | |
| Hydrogen | Exhaled air (after a balanced diet) |
| Indigestion of food |
H. pylori: Helicobacter pylori.
Over the past 15 years, our research group has refined a urease breath test protocol to assess infection activity based on exhalation changes [6]. The successful development of a portable “electronic nose” (EN) equipped with six multi-selective piezoelectric sensors has advanced point-of-care diagnostics. Ongoing research aims to enhance information yield, extend diagnostic scope, and improve specificity and sensitivity. Since 2017, portable ENs have also been adapted for noninvasive detection of excreted pharmaceuticals via skin contact [19].
The COVID-19 pandemic (2020–2023) underscored the urgent need for mobile diagnostic tools: stress, fear, and isolation exacerbated chronic conditions, notably duodenal ulcerations in the elderly. This paper presents our study of breath urease testing and detection of key H. pylori metabolites—alone and in combination with other biomarkers—in pulmonary and dermal exhalations using portable QCM-based devices with varied coating phases (see Figure 1). The study objectives were to:
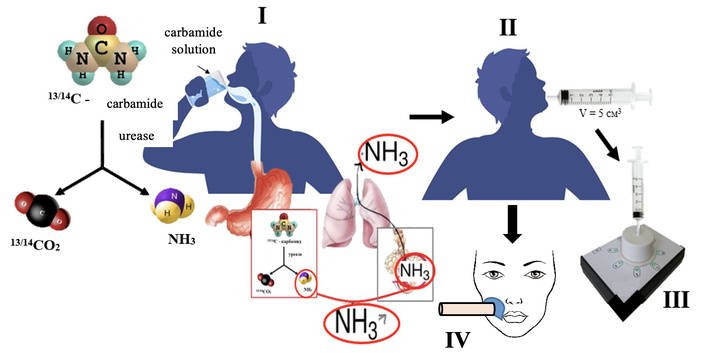
Scheme of the analysis for determining the activity of Helicobacter pylori for the detection of markers in the exhalation of the lungs and skin.
Evaluate on-site monitoring of exhaled air composition deviations in patients with discomfort, gastric pain, chronic gastritis, or previously diagnosed duodenal ulcer associated with elevated H. pylori activity.
Identify novel instrument solutions for contact telemedicine, enabling bedside or remote detection of prevalent pharmaceuticals via highly sensitive QCM sensors to prevent infection activation under isolation conditions.
Assess a portable skin bioscanner—based on a single piezoelectric sensor—for detecting urease test-related metabolites in facial projection zones.
Optimize sensor element count and detection cell design of a portable EN to enhance sensitivity to target analytes in pulmonary and dermal exhalations.
Develop clear algorithms for processing sensor array data matrices to simplify programming and improve real-time sample state ranking during monitoring.
The article combines the results of monitoring the condition of volunteers in order to exclude the growth of H. pylori activity during the diet and anti-Helicobacter therapy, and in the event of complaints of pain in the stomach in the period from July 2020 to July 2023. The peculiarity of the experiment was the combination of several multivariate conditions: 1) different instrumentation; 2) participation of conditionally healthy volunteers on their initiative and consent to testing of the exhalation of the lungs and skin, as well as, if recommended, a visit to a medical institution, a specialized doctor and standard diagnostics for H. pylori activity; 3) two testing options: in arbitrary conditions of stay “on-site” without special conditions (for example, at home) and in a research laboratory. The participation of inpatient departments of clinical hospitals and laboratories was indirect. Doctors of the gastroenterological department of the All-Russian Children’s Clinical Hospital named after N.N. Burdenko (Voronezh, Russia) were occasionally involved for consultations and analysis of the volunteers’ condition.
To exclude/detect increased activity of infection associated with the vital activity of H. pylori, a standard urease test was used. The test involves detecting a microbe using a urea solution, which was prepared immediately before use by dissolving 0.100 g of the preparation, classified as “chemically pure” (CAS: 57-13-6, ReaСhim, Russia), in 50 cm3 of distilled water. The test involved measuring the LS in a 5 cm3 exhalation from the mouth before taking the urea solution (basal, zero level), taking the urea solution in small sips (load), then for 40 minutes with a step of 2.5–5 minutes according to a previously substantiated method [6]. Particular attention was paid to the time interval of 25–35 minutes in accordance with the most favorable time of maximum H. pylori activity (30 minutes) in adults. All studies were conducted on an empty stomach, in compliance with the methodological recommendations for preparation for this type of study in clinical laboratories and hospitals of the Ministry of Health of the Russian Federation and taking into account the recommendations of the Maastricht V consensus meeting (2017), with the exception of taking medications if monitoring was carried out over treatment with bismuth-containing drugs [20].
In case of a clearly positive urease test reaction, the volunteer was strongly recommended to undergo a standard examination with the highest level of evidence. In case of a positive clinical test, volunteers were given a prescription from a gastroenterologist. No additional recommendations, prescriptions, conclusions, or discussions with volunteers were made by our group. The criteria for accepting a positive test result using sensor technologies are related to the type of device and are discussed below.
The scientific group of Prof. Kuchmenko T.A. has been developing technical solutions based on piezoelectric sensors for the urea breath test in adults and children since 2010. Therefore, in the current study, we had the opportunity to use devices and sensors based on piezoelectric resonators manufactured by Sensorika–New Technologies LLC (Russia) [21] that differ in mobility and information content to solve the tasks at hand.
EN “AquaStock” with 12 channels for piezoelectric sensors and autonomous long-term operation mode, combined with a laptop and universal software for recording and saving measurements (Figure 2A). Advantages for our study: allows you to increase the number of sensors with different coatings; autonomous power supply. Disadvantages: air injection into the side pipe; large volume of the detection cell (140 cm3). In the conditions of the 2020 pandemic, an experiment on the detection and monitoring of H. pylori treatment was carried out on this non-specialized device with a set of sensors for analyzing food systems, “Food”. Suboptimal, but forced conditions allowed us to obtain a number of valuable conclusions for further research.
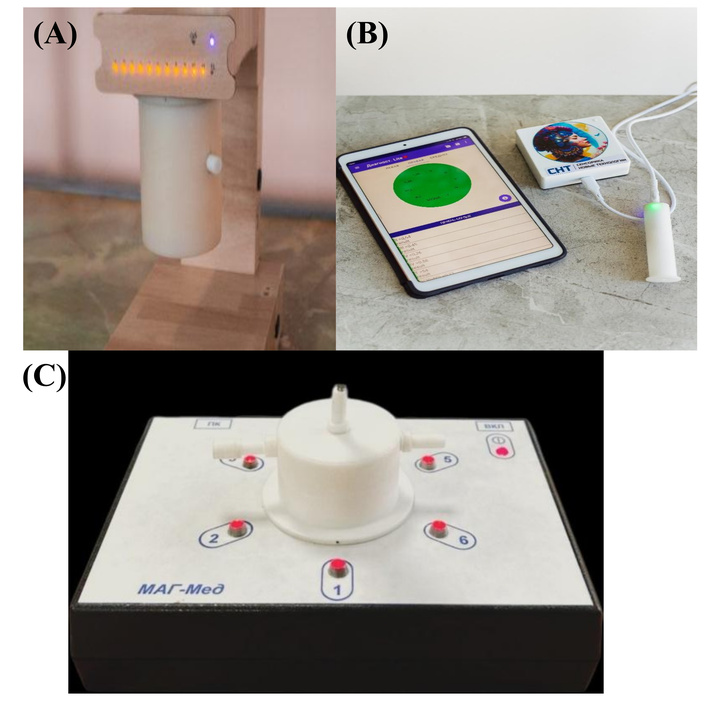
External appearance of the devices based on piezoelectric sensors used in the study: autonomous electronic nose (EN) “AquaStock” (A); portable health bioscanner “BioScan” for testing skin LS (B); portable EN specialized for the breath test method (C).
Taking into account the nature of the coatings of the piezoelectric sensor library with a base oscillation frequency of 10.0 MHz, and the characteristics of the reproducibility of the sensor responses. The relative error of measuring the test substance vapors by the sensor array with their injection into the detection cell is 7%. Taking this into account, the criteria for accepting a positive test result when analyzing exhaled air were selected. The sum of the areas under the output curves of all sensors for 60 s of measurement ∑S, Hz*s, was selected as the analytical signal. The analytical signal for the reference measurement was selected as the starting point. In the device software, the data of the zero measurement ∑S0 and measurements after 10 s (assessment of the state of the esophagus) ∑S10 and after 25–35 s [assessment of the state of colonies in the duodenal bulb (DU)] ∑S30 were compared. The test was considered negative if the relative difference between these values was d ≤ 15%. The test was considered indeterminate but probable if 16 ≤ d ≤ 30%. The test was considered positive if d ≥ 31%.
A commercial device for individual home use, the BioScan bioscanner, with one universal sensor for living system molecules (nanostructured hydroxyapatite), is designed to scan the composition of VCs secreted by the skin under conditions of 60 s of direct contact (Figure 2B). Advantages for our study: developed for non-invasive diagnostics of the state of organs and systems in the projections of the Zakharyin-Ged zones, trained for negative changes in the composition of the volatile metabolome. Easy to use, has an interface understandable to any user, suitable for integration into telemedicine measuring systems. Disadvantages: its capabilities for solving the tasks have not been studied, the stability of the skin under such measurement conditions is inferior to other separated biosamples (biopsy, saliva, exhaled air), equipped with a universal sensor, which reduces the selectivity of detection of target analytes. The analytical signal of this device is the maximum shift in the quartz plate oscillation frequency during the measurement (60–80 s of load and 100–120 s of spontaneous cleaning of the sensor) –∆Fmax, Hz, and the area under the output curve of the sensor for the entire measurement time, S, Hz*s. The analytical signals for the reference measurement were selected as a starting point. The device software compared the data of the zero measurement and measurements after 10 (esophagus condition assessment) and after 25–35 s (DU colony condition assessment). The declared error of the device is 5%, with reliable diagnostic changes interpreted from 15%. The test was considered negative if the relative difference between the analytical signals of the zero and load measurements was less than 15%. The test was considered uncertain but probable (+) if 16 ≤ d ≤ 30%. The test was considered confidently positive if d ≥ 31% (++), high urease cleavage activity (+++)—from 60%.
To detect bacterial metabolic products (ammonia and carbon dioxide) in exhaled air, a method was previously developed [22], then a static EN “MAG-Med” with a reduced detection cell volume and 6 measuring elements—piezosensors (Figure 2C). The location of its nozzles allows the use of an automatic sample injection device with an adjustable and constant sample injection rate, which reduces the instrument error, and the small volume of the case does not lead to dilution of the sample being collected. An experimental set of sensors with coatings was used as the detectable elements. Films were selected as piezosensor coatings based on a preliminary experiment, the sensitivity and selectivity of which to marker substances and other VCs of pathogenic processes were substantiated earlier [23]. The array is formed according to the principle of triple scanning of air composition: all compounds (universal sorbents on sensors), ammonia and alkylamine vapors (main films on sensors), carbon dioxide vapors, and organic compounds. Sensors with universal sorption properties: crown ether dicyclohexane-18-crown-6 (DCH18K6—sensor 1), nanohydroxyapatite (sensor 3); coatings exhibiting selectivity to amines: polyethylene glycol succinate (PEGS—sensor 6), to ammonia, amines-zirconyl nitrate (sensor 2) and nanostructured europium oxide (sensor 5); exhibiting selectivity to alcohols, acids, propolis (PChK—sensor 4). The Eu2O3-SiO2 phase was provided by Kuznetsova I.V., Associate Professor of the Department of General and Inorganic Chemistry at VSUET (Voronezh State University of Engineering Technologies).
Piezosensors with new phases (europium oxide, bee glue) were manufactured using previously described methods [23]. The array of piezosensors was preliminarily trained using individual substances (marker gases): ammonia solutions, primary, secondary, and tertiary amines with alkyl radicals, pairs of aliphatic alcohols C2-C5 of normal and isomeric structure, and ketones (all preparations classified as “analytical grade”, “chemically pure”) until responses were stabilized and noise levels were minimal.
The subjects of the test were people with and without complaints of stomach pain: Group 1: 2 volunteers with negative helico-tests, without complaints of stomach condition (conditionally healthy). They were scanned on all devices once, and their results were chosen as a conditional zero comparison.
Group 2: 5 people complaining of stomach pain, aged 18 to 60 years, who had not received anti-Helicobacter therapy. They were diagnosed multiple times (3 to 7 times) with different frequency, both for primary complaints and in the process of changing the diet/treatment regimen: diet, anti-Helicobacter therapy, and self-administration of dietary supplements.
Three volunteers underwent fibrogastroduodenoscopy (FGDS) based on the results of sensory testing, followed by histomorphological examination of a biopsy of the gastric and duodenal mucosa as the “gold” standard for diagnosing H. pylori infection in clinical laboratories. All three had a positive test.
The Group 3 included a volunteer for whom the approach of simultaneous analysis of skin and lung exhalation was used for the first time under home isolation conditions. The volunteer, a woman, aged 80, had been in remission from a DU ulcer for over 10 years. Isolation and stress led to an exacerbation of the disease and complaints of pain, weight loss, and sleep loss. For some time, the volunteer could not be taken to a medical facility to undergo a standard fibrogastroscopy (FGS) procedure with the collection of material for a PCR test. A therapist prescribed preventive and therapeutic anti-Helicobacter drugs in a telemedicine setting. Before and during the 3 weeks, measurements were taken at 3-day intervals using a urease test, a mobile EN “AquaStock”, and a portable gas analyzer based on a single sensor with a nanostructured hydroxyapatite coating (health bioscanner) [24].
Before testing, all volunteers were carefully monitored for smoking, medication, and food intake. For the volunteer from Group 3, additional testing was performed with a violation of the fasting testing condition to assess the correctness of data interpretation based on the results of using a non-specific set of sensors. Testing was performed between 7 and 10 a.m. in the laboratory and one volunteer (Group 3) at home. The volunteer was scanned at home using a portable single-sensor gas analyzer, BioScan, by scanning skin secretions in one of the available projections of the stomach (on the right cheek).
In addition to the above absolute sensor signals and relative calculated parameters of their changes, a set of parameters Ai/j was used to compare the qualitative composition of the mixture of drugs [25].
The parameters are calculated based on the largest signals from two different sensors. By their nature, they are a characteristic of the paired sensitivity of two sensors in the array, selected for samples from the entire set obtained in accordance with the analysis task. A new approach to comparing the qualitative composition of volatile organic compound (VOC) samples or their part recorded by sensors is to compare not individual parameters Ai/j, but a set of the most stable and informative parameters (the “fingerprint” algorithm). The similarity of the composition of VCs recorded in the mixture of samples is estimated by the proportion of those matching from the sets within the error limits of the parameters [26]. Samples are considered close (with identical VOC composition) if the difference in parameters is no more than 30%. For an array of eight sensors, the total set of unique parameters is 28.
For the summary comparison of differences in the composition of mixtures of exhaled medicinal products, a new method of processing multidimensional data was used—color coding of the results of piezoelectric microweighing (Prof. Kuchmenko T.A.) [27]. The essence of the method lies in obtaining point results (compression into one color point) of the entire set of qualitative characteristics of the composition of the mixture of medicinal products. Each value is assigned a certain color depending on the value of the parameter. Then all the colors are summed up, and one color mark with coordinates in the RGB system is obtained (for example). The closer the colors assigned to the data for the samples, the closer the reaction of the set of gas sensors to the composition of the mixture of medicinal products. Color mixer (color blender) mixes an unlimited number of colors and shades, and applying the coordinates of the mixed (summary) color to the field allows one to unambiguously determine the proximity or remoteness of the summary mark for a specific sample based on the results of detection by the set of sensors. The boundaries of the color mark, depending on the parameter values, are determined by metrological characteristics that depend on the nature of the phase, and the colors of the boundaries depend on the preferences of the experimenter. For different objects within a group, the original colors can be very diverse. The clarity and sensitivity of the proposed method, which is easily implemented in widely available free services, can contribute to its wide distribution among other algorithms for processing multidimensional data. The more parameters are included in the sample, the more accurate the differentiation of samples and the more reliable their classification. Ready-made color blocks are also well integrated into personal programs for “electronic noses”. Color coding is intuitively more clearly perceived by untrained users. The spatial arrangement of color marks for individual samples on a plane allows for a quick comparison of the similarity and difference in the composition of mixtures [27].
It was previously established that the method of piezoelectric microweighing using polymer coatings [28] of resonators allows increasing the information content of the data obtained by sampling exhaled air every 10 minutes. We have reduced this interval to 5 minutes, during which a full cycle of measuring and cleaning the surface of the sensors and the detection cell occurs [6]. And the use of solid-state sorbents of piezoelectric elements allows reducing this sampling step to 2.5 minutes. The change in the mode is associated with a decrease in the rate of sorption-desorption processes: τsorption = 60 s, τdesorption = 60 s. Regeneration of the sensors is carried out by a threefold volume of air from the syringe, V = 5 cm3. Different time intervals between measurements by three devices are associated with these nuances. The maximum step of 5 minutes is applied for the EN “AquaStock” array, in which some of the informative sensors are modified with polymer films [PEGSuk (CAS: 37304-09-3), polyethylene glycol 2000 (CAS: 25322-68-3), PEG-2000, polyvinylpyrrolidone (CAS: 9003-39-8), PVP-ReaСhim, Russia]. For the same reason, when analyzing exhaled air on the EN MAG-Med, the responses of sensors 1 and 6 are excluded from the data sample. Let us consider the results of using devices with different functionality to exclude/confirm the presence of H. pylori infection. Our task is to prove or disprove the possibility of reliable ranking of exhaled air samples when their composition changes, target markers of inflammation and microbial activity appear/disappear—ammonia, amines, alcohols, acetone (ReaСhim, Russia).
H. pylori metabolites, standardly installed in the EN “AquaStock” device, were used for extreme monitoring at the volunteer’s home in isolation conditions (June–August 2020). At this stage, the tasks of assessing 1) the possibility of using a universal set of sensors for monitoring changes in the vital activity of a microorganism during treatment according to a standard protocol; 2) searching for the most informative data of the signal matrix of 8 sensors, less noisy and easily programmable in the future when developing a portable diagnostic station.
The mobile device EN “AquaStock” is equipped with a large detection cell with a volume of 140 cm3, which reduces the sensitivity of analyte detection in exhaled air; the sample is diluted by at least 25 times. A priori, this fact can affect the reliable detection of ammonia under urea loading. In addition, the set of sensors “Food” contains coatings for detecting different compounds of the classes of alcohols, aldehydes, and amines, which allows us to expect a response of the sensors to changes in the composition of the exhalation. The array was preliminarily assessed for selectivity to individual compounds. Selectivity is reflected in a set of pair sensitivity parameters, which are calculated based on the maximum responses of the sensors in pairs of test substances for 60 s. At the same time, from all available unique combinations of pair sensitivity for 8 sensors (28 combinations), the most stable and differentiating the nature of the vapors were selected. For a visual presentation of the results, an original method of ranking a set of parameters in the form of a total color code was used. The boundaries were chosen taking into account the confidence interval of variation for each parameter, estimated based on the results of sorption of a large sample of substances on this array of sensors. The colors were assigned according to the growth of values, they were associatively located by analogy with the increase in wavelength in the spectrum (Table 2).
An original method of ranking a set of parameters in the form of a common color code.
| Value of parameter Ai/j | Color | Color label |
|---|---|---|
| 0–0.09 | violet | |
| 0.10–0.19 | dark blue | |
| 0.20–0.35 | light blue | |
| 0.36–0.49 | green | |
| 0.50–0.65 | yellow | |
| 0.66–0.80 | orange | |
| 0.81–0.99 | red | |
| 1.0–1.5 | burgundy | |
| more than 1.5 | grey |
After assigning a color label, the resulting sets of parameter codes were summed up in an accessible service, and the coordinates of the total color were recorded in one of the systems, for example, RGB (Table 3).
Results of training a non-specific array of sensors in pairs of test substances, volume of the equilibrium gas phase 3 cm3.
| Test substances | Sensor number in array/maximum sensor response, Hz | The most stable parameters Ai/j in pairs of test substances/their color label | Sum of colors | Coordinates in the RGB system | ||||||||||||||
|---|---|---|---|---|---|---|---|---|---|---|---|---|---|---|---|---|---|---|
| 1 | 2 | 3 | 4 | 5 | 6 | 7 | 8 | 1/3 | 1/4 | 7/1 | 1/8 | 8/3 | 4/8 | 2/5 | 7/8 | |||
| Acetaldehyde | 14 | 19 | 11 | 20 | 5 | 7 | 11 | 29 | #A9B834 | |||||||||
| Acetaldehyde | 18 | 22 | 12 | 20 | 5 | 7 | 14 | 34 | #C8AB34 | |||||||||
| Ethyl acetate | 4 | 5 | 6 | 7 | 3 | 4 | 5 | 17 | #89C674 | |||||||||
| Ethyl acetate | 7 | 9 | 9 | 11 | 5 | 6 | 7 | 25 | #89BD74 | |||||||||
| Acetone | 9 | 7 | 6 | 8 | 4 | 7 | 5 | 20 | #7FB255 | |||||||||
| Acetone | 9 | 6 | 7 | 7 | 5 | 6 | 7 | 20 | #7B8F5C | |||||||||
| Ethanol | 18 | 9 | 11 | 15 | 7 | 8 | 15 | 48 | #7F9075 | |||||||||
| Propanol-2 | 23 | 27 | 14 | 34 | 10 | 9 | 31 | 119 | #82A0AD | |||||||||
| Propanol-1 | 16 | 18 | 11 | 27 | 8 | 8 | 21 | 94 | #7F7195 | |||||||||
| Butanol-1 | 23 | 31 | 18 | 42 | 11 | 13 | 26 | 150 | #7F6A95 | |||||||||
| Ammonia in water, 1% | 68 | 18 | 46 | 33 | 11 | 25 | 24 | 94 | #82BEAD | |||||||||
| Water | 59 | 12 | 38 | 26 | 9 | 21 | 20 | 75 | #82BEAD | |||||||||
| Toluene | 10 | 15 | 9 | 13 | 6 | 5 | 11 | 37 | #7FA595 | |||||||||
| Toluene | 10 | 24 | 14 | 25 | 9 | 7 | 17 | 80 | #6CBFAC | |||||||||
The algorithm of color coding of the set of qualitative parameters for test substances allows us to draw a conclusion about the differentiation of the set of sensors for high concentration of acetone, alcohols, and acetaldehyde. High concentration of water does not allow reliable differentiation of small concentrations of ammonia. Increasing the concentration of compounds and the number of repetitions increases the reliability of their differentiation in the mixture of compounds of exhalation. But the task of the experiment was to simplify and roughen the measurement algorithm as much as possible, focusing on different conditions of its application.
According to the previously developed method of sampling 5 cm3 of exhaled air from the volunteer’s mouth in 5-minute increments for 35–50 minutes on an empty stomach, changes in the qualitative composition of exhaled air were assessed. At the time of the first test, this volunteer did not have a reliably positive reaction to H. pylori, but by the second point, a positive response was established by standard methods, and treatment with bismuth-containing drugs was prescribed. To assess the impact of violation of testing conditions and the sensitivity of a random set of sensors to this fact, changes in the composition of the volunteer’s exhalation on an empty stomach and after eating low-protein food were assessed (Table 4).
Sensor signals (ΔFmax, Hz) of the “Food” array before and after urea loading on the first day of treatment monitoring on an empty stomach and after eating, V = 5 cm3.
| Control points | Post-meal test | Fasting test | ||||||||||||||
|---|---|---|---|---|---|---|---|---|---|---|---|---|---|---|---|---|
| Sensor number | 1 | 2 | 3 | 4 | 5 | 6 | 7 | 8 | 1 | 2 | 3 | 4 | 5 | 6 | 7 | 8 |
| Original background | 26 | 10 | 100 | 34 | 7 | 9 | 6 | 22 | 37 | 12 | 126 | 48 | 9 | 14 | 6 | 25 |
| Load 0 min | 32 | 12 | 96 | 33 | 6 | 9 | 7 | 27 | 34 | 11 | 101 | 35 | 6 | 10 | 5 | 24 |
| 5 min | 29 | 11 | 93 | 34 | 7 | 9 | 7 | 24 | 36 | 12 | 123 | 47 | 9 | 18 | 5 | 23 |
| 10 min | 30 | 10 | 96 | 35 | 7 | 10 | 6 | 25 | 36 | 13 | 116 | 41 | 6 | 12 | 6 | 26 |
| 15 min | 23 | 8 | 87 | 30 | 4 | 6 | 7 | 27 | 39 | 11 | 117 | 43 | 8 | 14 | 6 | 23 |
| 20 min | 28 | 10 | 100 | 34 | 6 | 8 | 8 | 29 | 42 | 12 | 131 | 48 | 10 | 15 | 5 | 23 |
| 25 min | 28 | 10 | 93 | 35 | 7 | 10 | 6 | 27 | 41 | 13 | 135 | 45 | 9 | 14 | 6 | 26 |
| 30 min | 27 | 8 | 85 | 29 | 4 | 7 | 7 | 26 | 68 | 18 | 187 | 61 | 13 | 19 | 8 | 35 |
| 35 min | 26 | 10 | 92 | 34 | 6 | 9 | 7 | 24 | 49 | 14 | 136 | 43 | 9 | 15 | 7 | 33 |
| 40 min | 30 | 10 | 107 | 34 | 6 | 8 | 9 | 37 | 45 | 13 | 140 | 44 | 9 | 12 | 6 | 29 |
| 45 min | 25 | 8 | 85 | 29 | 3 | 6 | 5 | 25 | 38 | 11 | 117 | 38 | 10 | 19 | 7 | 27 |
| 50 min | 22 | 8 | 81 | 28 | 5 | 7 | 7 | 28 | ||||||||
| 55 min | 33 | 9 | 109 | 36 | 6 | 9 | 7 | 27 | ||||||||
It was found that food intake significantly affects the sensor signals, reduces the content of exhaled markers of inflammatory processes in the gastric mucosa and DU, but also changes the content of individual classes of compounds. This is reflected in a significant change in the total color mark and its coordinates for a set of qualitative parameters previously identified as optimal for test substances (Table 3). Violation of one of the most important conditions for preparing for the breath test complicates the detection of differences in the exhalation composition during a urea load, compared to a test in compliance with the rule (Table 5). These results are consistent with the data on the effect of food on infection recognition by the urea breath test. For fasting measurements, color marks are clearly distinguished during testing, and a sharp change in the qualitative composition of the air was found after 30–35 minutes of control after the load. This corresponds to the time it takes for urea to pass to the DU for adults [6], the urease reaction, and the release of metabolic products with exhaled air.
Results of color coding of paired sensitivity parameters for fasting exhaled air during 8-day treatment monitoring with a non-specific set of sensors.
| Control points | Total color (code) | RGB coordinate | Total color (code) | RGB coordinate | Total color (code) | RGB coordinate | |
|---|---|---|---|---|---|---|---|
| 1 day of control | 1st day of control | 7th day of control | |||||
| Background | #7FA595 | #7F8795 | #788AAE | ||||
| Load 0 min | #85757B | #7B587C | #788C8E | ||||
| 5 min | #7B767C | #869BC6 | #85757B | ||||
| 10 min | #7B767C | #7F7195 | #826BAD | ||||
| 15 min | #8FAB7A | #8289AD | #826BAD | ||||
| 20 min | #8F8B7A | #8684C6 | #788AAE | ||||
| 25 min | #7B8D7C | #826BAD | #8684C6 | ||||
| 30 min | #85957B | #7C87A7 | #826BAD | ||||
| 35 min | #858C7B | #715B5D | #786CAE | ||||
| 40 min | #998A79 | #757296 | #8684C6 | ||||
| 45 min | #85957B | #71597D | #786CAE | ||||
| 50 min | #8FB87A | #786CAE | |||||
| 55 min | #85757B | #7C85C7 | |||||
| #85757B | #786CAE | ||||||
It was found that after a week of taking drugs by a volunteer during anti-Helicobacter therapy, the composition of exhaled air becomes more uniform. Under the selected conditions for detecting markers, the sensitivity of the installed library of EN sensors to them is not sufficient for reliable control over the infection level. The air in the initial section after the load, which corresponds to the transition of food to the stomach (5–10 minutes), remains inflamed and differs from the exhalation at other points. The use of the most general quantitative indicator of microweighing, which depends on the concentration of components in the air, the area under all output curves of the sensors, did not provide a reliable prediction of changes in the H. pylori titer. Also, the fact of testing against the background of taking drugs at all points except the first one can affect the results of low specificity to infection markers during urea loading. At the same time, according to the signals of individual sensors, a high concentration of acetone and amines in the exhalation was established throughout the study, which indirectly confirms the fact of inflammation in the upper gastrointestinal tract.
The results allow us to make a number of important conclusions for the practice of minimally invasive diagnostics of infection using piezoelectric sensor signals:
For the initial determination of the possible cause of patients’ complaints of pain in the stomach and duodenum in an extreme situation, isolation, and distance from medical centers, an array of non-specific sensors is suitable, since the level of released compounds—markers of an exacerbation of the disease—is high.
A simple and visual way of ranking multidimensional data of an array of piezo sensors by color code allows for rapid assessment of changes in the composition of exhalation, both during analysis and on different days of therapy. However, in practice, the problem of sample dilution should be solved by reducing the volume of the detection cell and the number of sensors, while changing their selectivity and sorption capacity for target analytes.
The fact that the composition of exhaled air changes over 10 minutes is also diagnostically important and may indicate inflammation and colonization of the food with other microorganisms with urease activity.
In conditions of isolation of an elderly patient, a portable miniature bioscanner, a gas analyzer with one sensor modified with a nanostructured hydroxyapatite phase, was used to obtain additional information about the course of the disease [19, 27].
The biochemical reactions occurring in the skin ensure constant metabolism and synthesis of specific products necessary to maintain the structure and function of its cells and tissues. In its activity, the body relies on the function of organs, organs on the function of tissues, and the latter on the functional capacity of cells. The cell is the last indivisible unit of the body. It is its building material. The cell itself is renewed by substances carried by the bloodstream throughout the body. The connection between metabolism and the structure and function of the skin is of primary importance. Biochemical reactions are organized into biochemical pathways that are organically linked to each other, so that reactions of different pathways can be modified and intersect.
Skin metabolism is combined with the metabolism of the entire organism, with the help of the nervous and endocrine systems. Scientists have long noticed the connection between metabolic disorders in skin tissues and dysfunction of human internal organs. In all people, most of the “areas of influence” (certain areas of skin and underlying tissues through which it is possible to act on individual organs or systems of the organism) have the same anatomical localization.
The skin performs an important function of removing substances from the body, freeing it from excess of some (water, salts) and from toxic effects of others (metabolites, medicinal substances), facilitating the performance of such functions of the body as thermoregulatory, barrier, bactericidal, etc. The skin is involved in gas exchange. The human body releases 7–9 g of carbon dioxide per day through the skin and absorbs 3–4 g of oxygen, which is 2% of the total gas exchange. Cutaneous respiration increases with an increase in ambient and body temperature, during physical work, with an increase in atmospheric pressure, and with acute inflammation of the skin. The skin is involved in the general metabolism of the body. Chemical transformations of substances that are related to the metabolic processes of other organs occur in it, for example, the processes of catabolism of proteins, carbohydrates, and lipids [29].
In the conditions of home monitoring of the volunteer’s condition in isolation during treatment, a method for detecting VCs exhaled by the skin was used. The close connection of the skin and all internal organs, projections of internal organs on individual innervation areas in the Zakharyin-Ged zones were taken into account [30]. Accessible projections of the stomach are located on the face (Figure 3). In these areas, the composition of VCs was scanned before and after urea loading, and the main analysis of lung exhalation was performed in parallel on the EN “AquaStock” device.
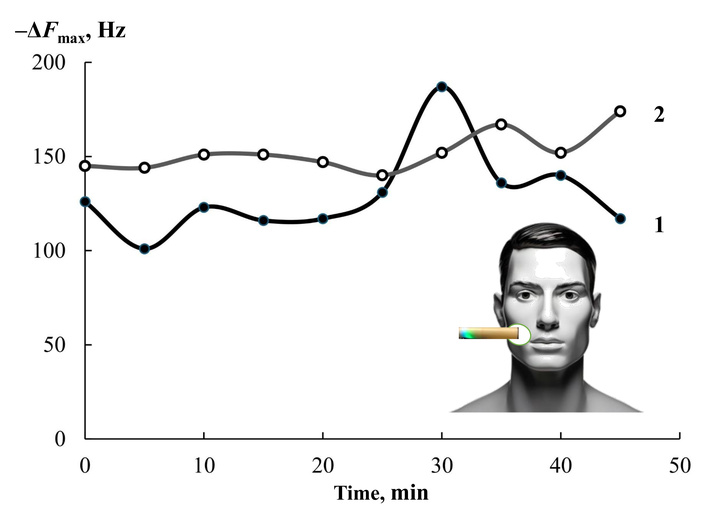
Changes in the signal of the health bioscanner sensor in the projection of the stomach (diagram) on the first (1) and seventh (2) days of anti-Helicobacter therapy.
It was found that one sensor, as well as an array of eight sensors, records changes in the composition of the mixture of drugs secreted by the skin at the maximum level of H. pylori activity (the first day of monitoring) and after a week of regular treatment. At the same time, the most complete information on the content of drugs secreted by the skin for 80 s of contact with the bioscanner is reflected by the integral characteristic of sorption—the area under the output curve from 0 to 200 s of measurement with a step of 1 s. An important feature of the change in the nature of drugs is the feature of spontaneous desorption of substances after 80 s. Ammonia and amines are desorbed from the sorbent phase at a lower rate than other native components, and an increase in their concentration at some point in the measurement significantly increases the value of the area under the full output curve of the sensor (Figure 4).
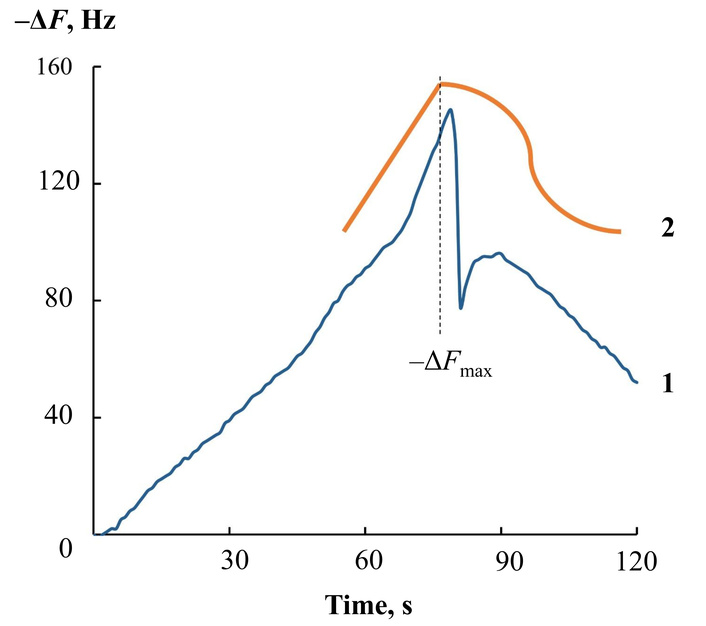
Output curve of a hydroxyapatite-based sensor when measuring volatile compounds with a health bioscanner at 80 s of contact with skin (1) and a schematic representation of the change in the shape of the curve with an increase in the concentration of emitted substances (amines, alcohols, ammonia) (2).
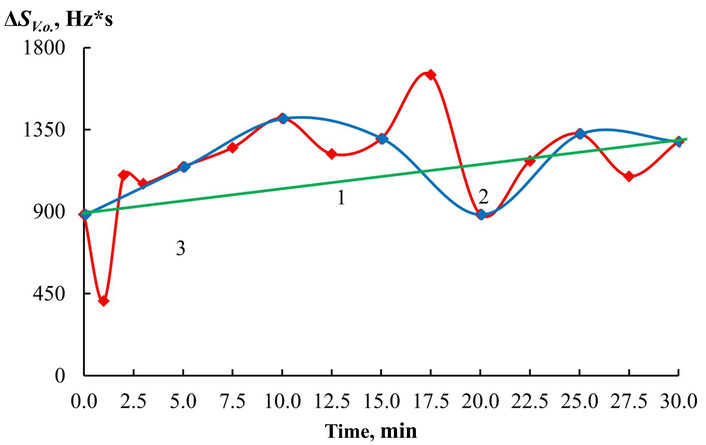
Both devices, based on eight and one piezoelectric sensors, were used for a month to record changes in the composition of compounds exhaled by the lungs and skin of a volunteer under home diagnostic conditions. The reliability of the interpretation of the results is confirmed by the results of gastroscopy and the PCR biopsy test, which were performed in the first week after the start of testing the volunteer using the urea load method. The results of long-term monitoring are clearly shown in Figure 5. The change in sensor signals shows a decrease in the reaction to urea in the exhalation during 2 weeks of therapy. A repeat study was not conducted for the volunteer due to objective reasons for isolation. However, the subjective assessment of the volunteer’s condition changed significantly (Table 6).
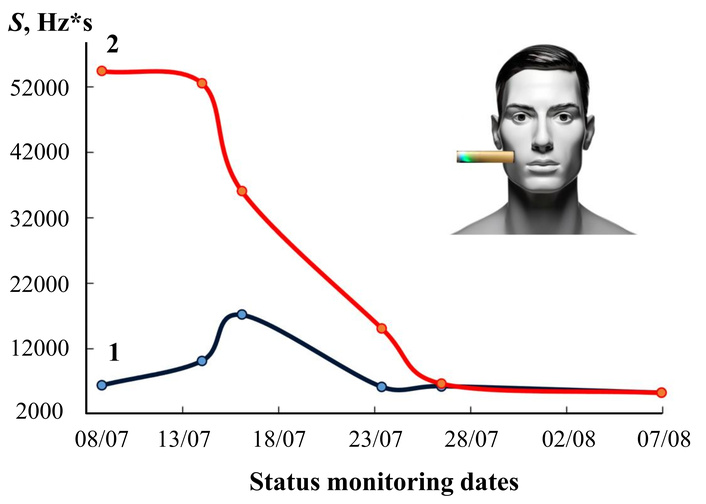
Dynamics of changes in the content of volatile compounds in skin exhalation by the area of the output curve of the bioscanner sensor before (1) and maximum after (2) urea loading during a month of anti-Helicobacter therapy.
Subjective description of the volunteer’s condition at different stages of treatment and monitoring at home.
| Date of survey/stage of treatment | Complaints, description of the condition |
|---|---|
| 08/07/2020(start of testing, first day of taking medications) | Severe pain, nausea, weight loss, irritation, anxiety, and severe pallor of the skin. |
| 22/07/2020(mid-term monitoring, 2 weeks of therapy) | Significant improvement in condition, appetite has returned, there is pain. |
| 07/08/2020(end of testing, week after stopping taking the drugs) | The complexion improved, the volunteer gained 1.5 kg in weight, his sleep and mood improved, he is not bothered by pain, and nausea is rare. |
The data in Figure 5 and Table 6 allow us to positively evaluate the predictive properties of the analytical information from the “Food” sensor array, which included sensors with coatings of different polarity and selectivity to the expected markers of changes in the gastric mucosa, both with the growth of the H. pylori population and with the development of inflammation of a different etiology (ammonia, amines, alcohols, acetone). From the sensor array in the EN “AquaStock” device, we selected a sensor with a universal coating based on the DCH18K6 macrocycle for comparison with the health bioscanner sensor. For this sensor, we tracked signal changes both at each state control point by date and at different times before and after the urea load (Table 7). As the drugs are taken, if the sensor reacts to inflammation markers, its responses should change differently, and the tightness of the connection with the data should decrease from day to day with an increase in the period of drug intake. The Pearson correlation coefficients were calculated for the data series of sensor 3 between adjacent control points X and Y, respectively: 1 and 2, 2 and 3, 3 and 4, 4 and 5, 5 and 6. The degree of connection between the sensor responses on the first day of control and during measurement with violation of conditions (after eating) was also assessed.
Pearson parameters and tightness of connection for the signal sample of one bioscanner sensor and a non-selective array of electronic nose sensors at different stages of monitoring.
| Control date (curve number on the graph) | Dynamics of the change of the signal of the active sensor in an array of EN | Relative change in the maximum expiratory response (%) of the lung EN sensors (I) and the skin on the right cheek of the bioscanner sensor (II) on different monitoring days | Pearson correlation coefficient, RX, Y |
|---|---|---|---|
| 09/07/2020 (1) | 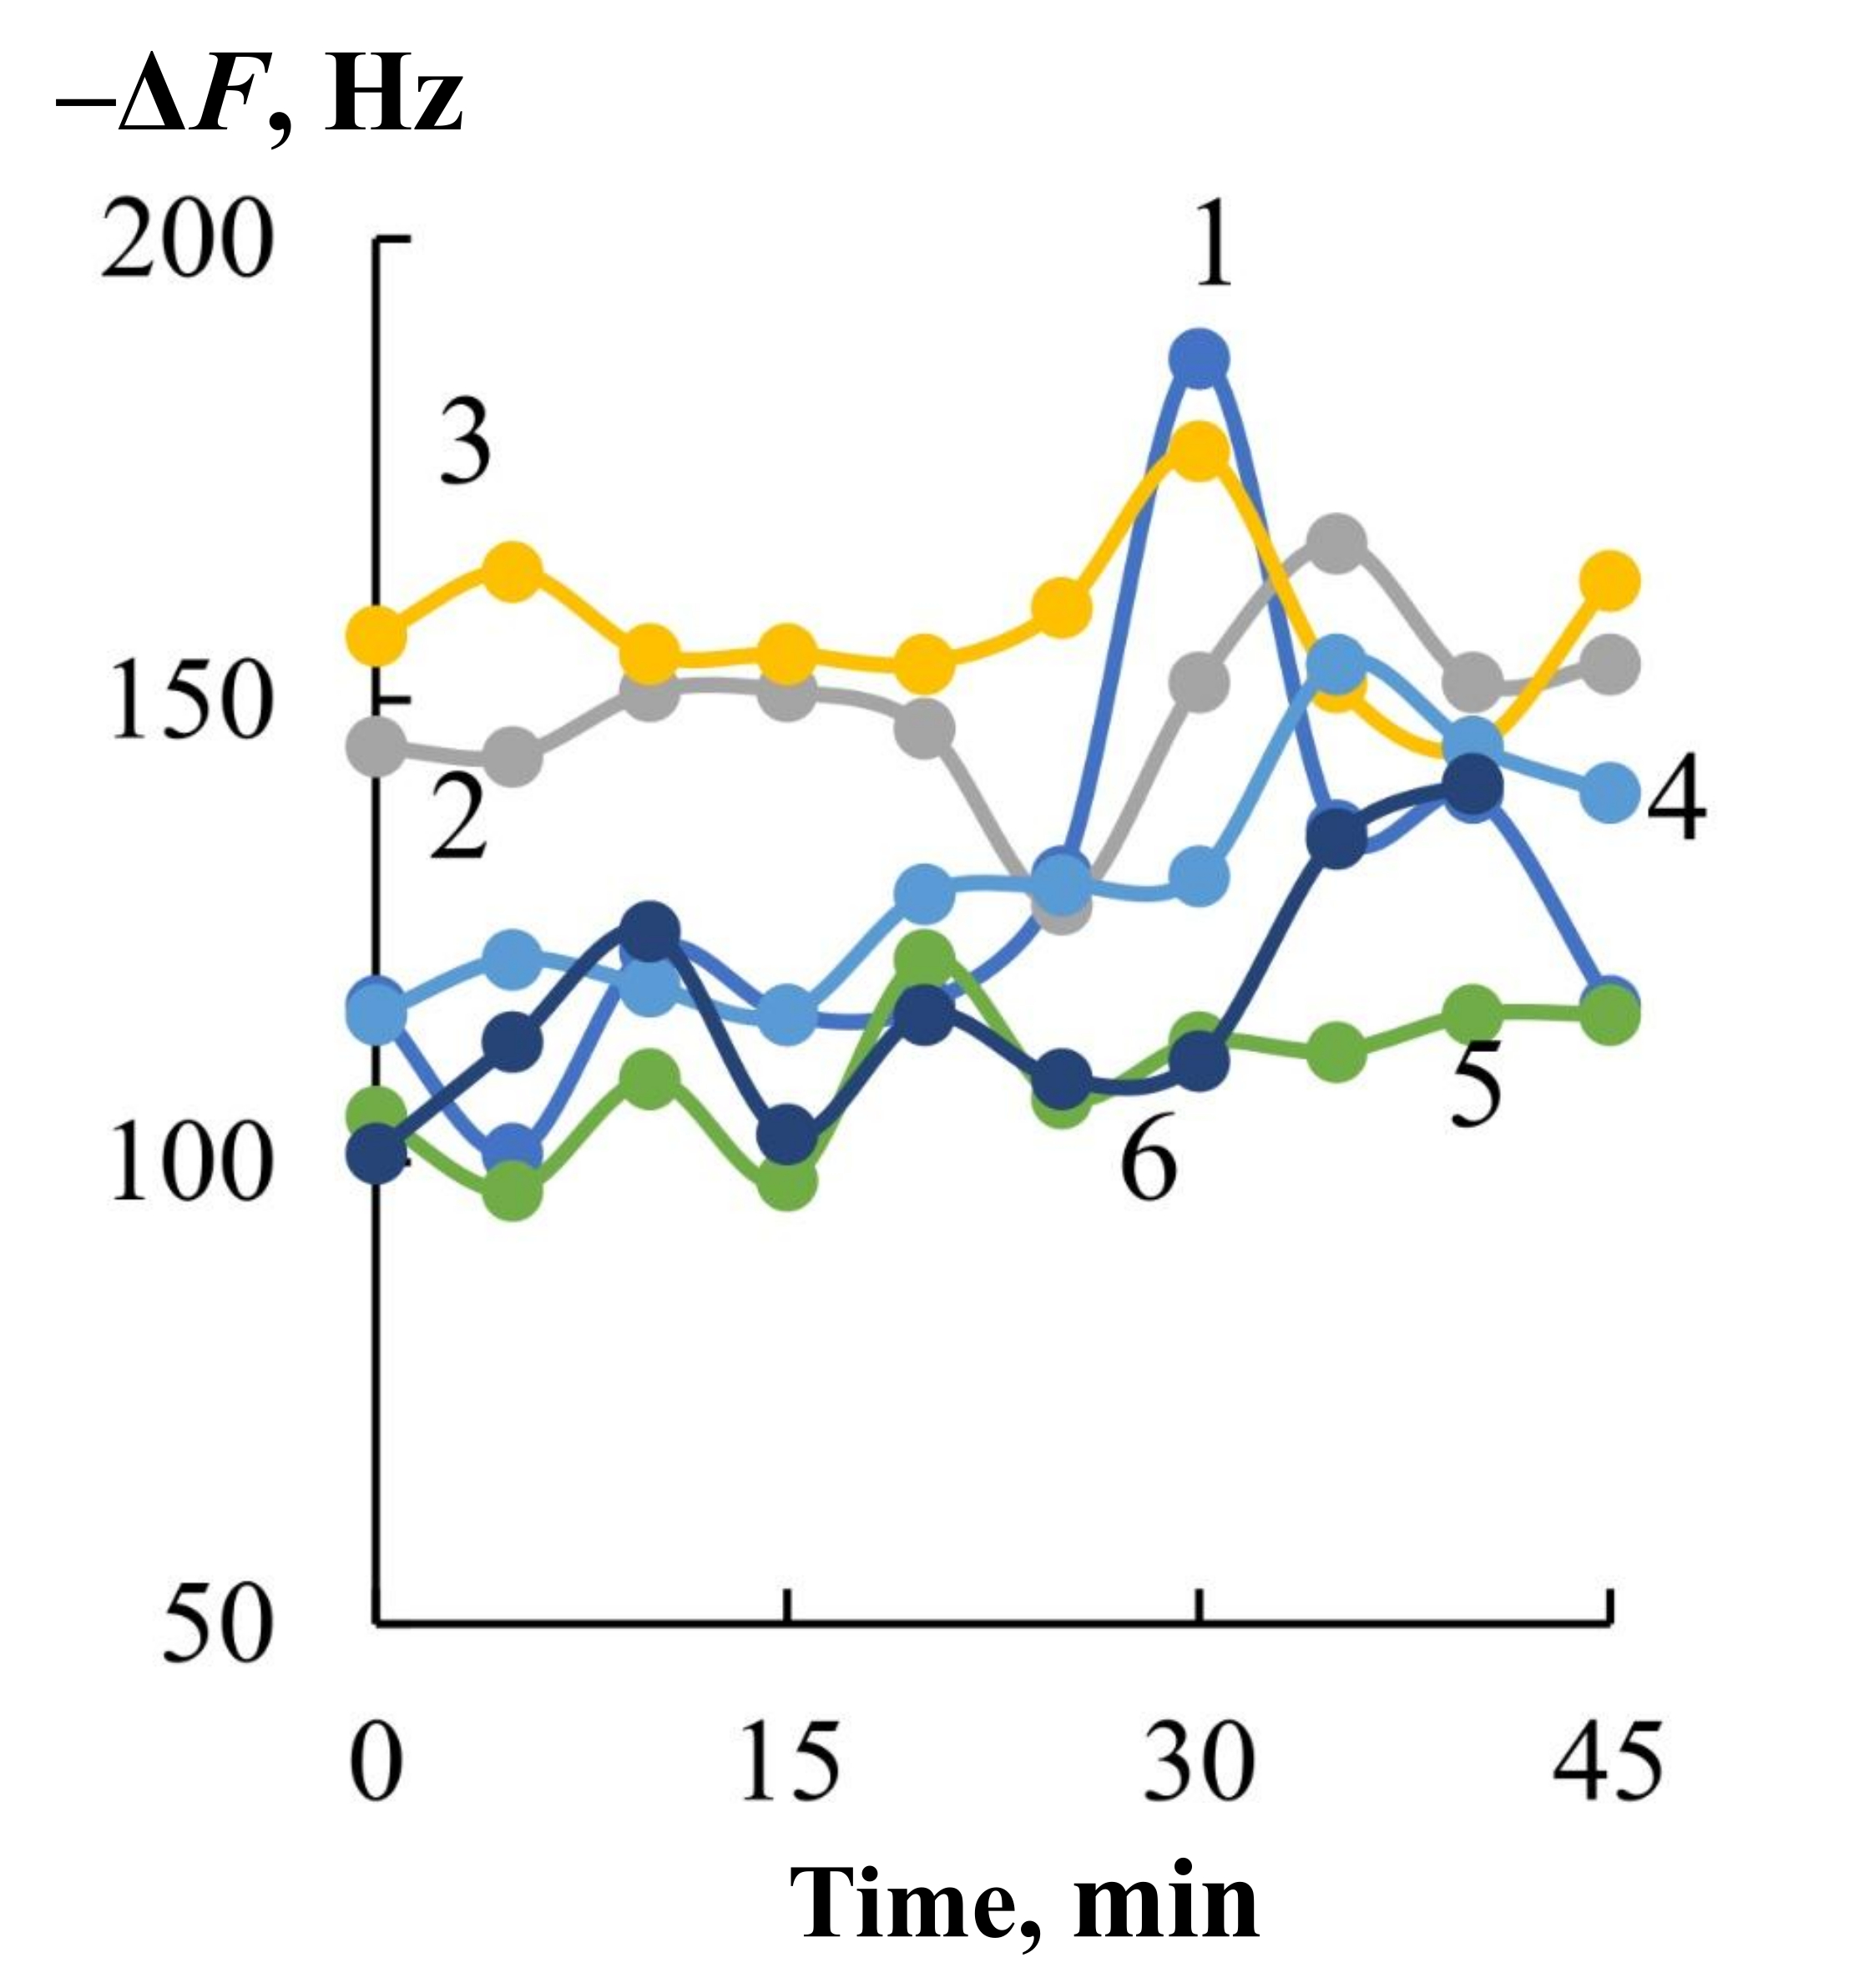 | 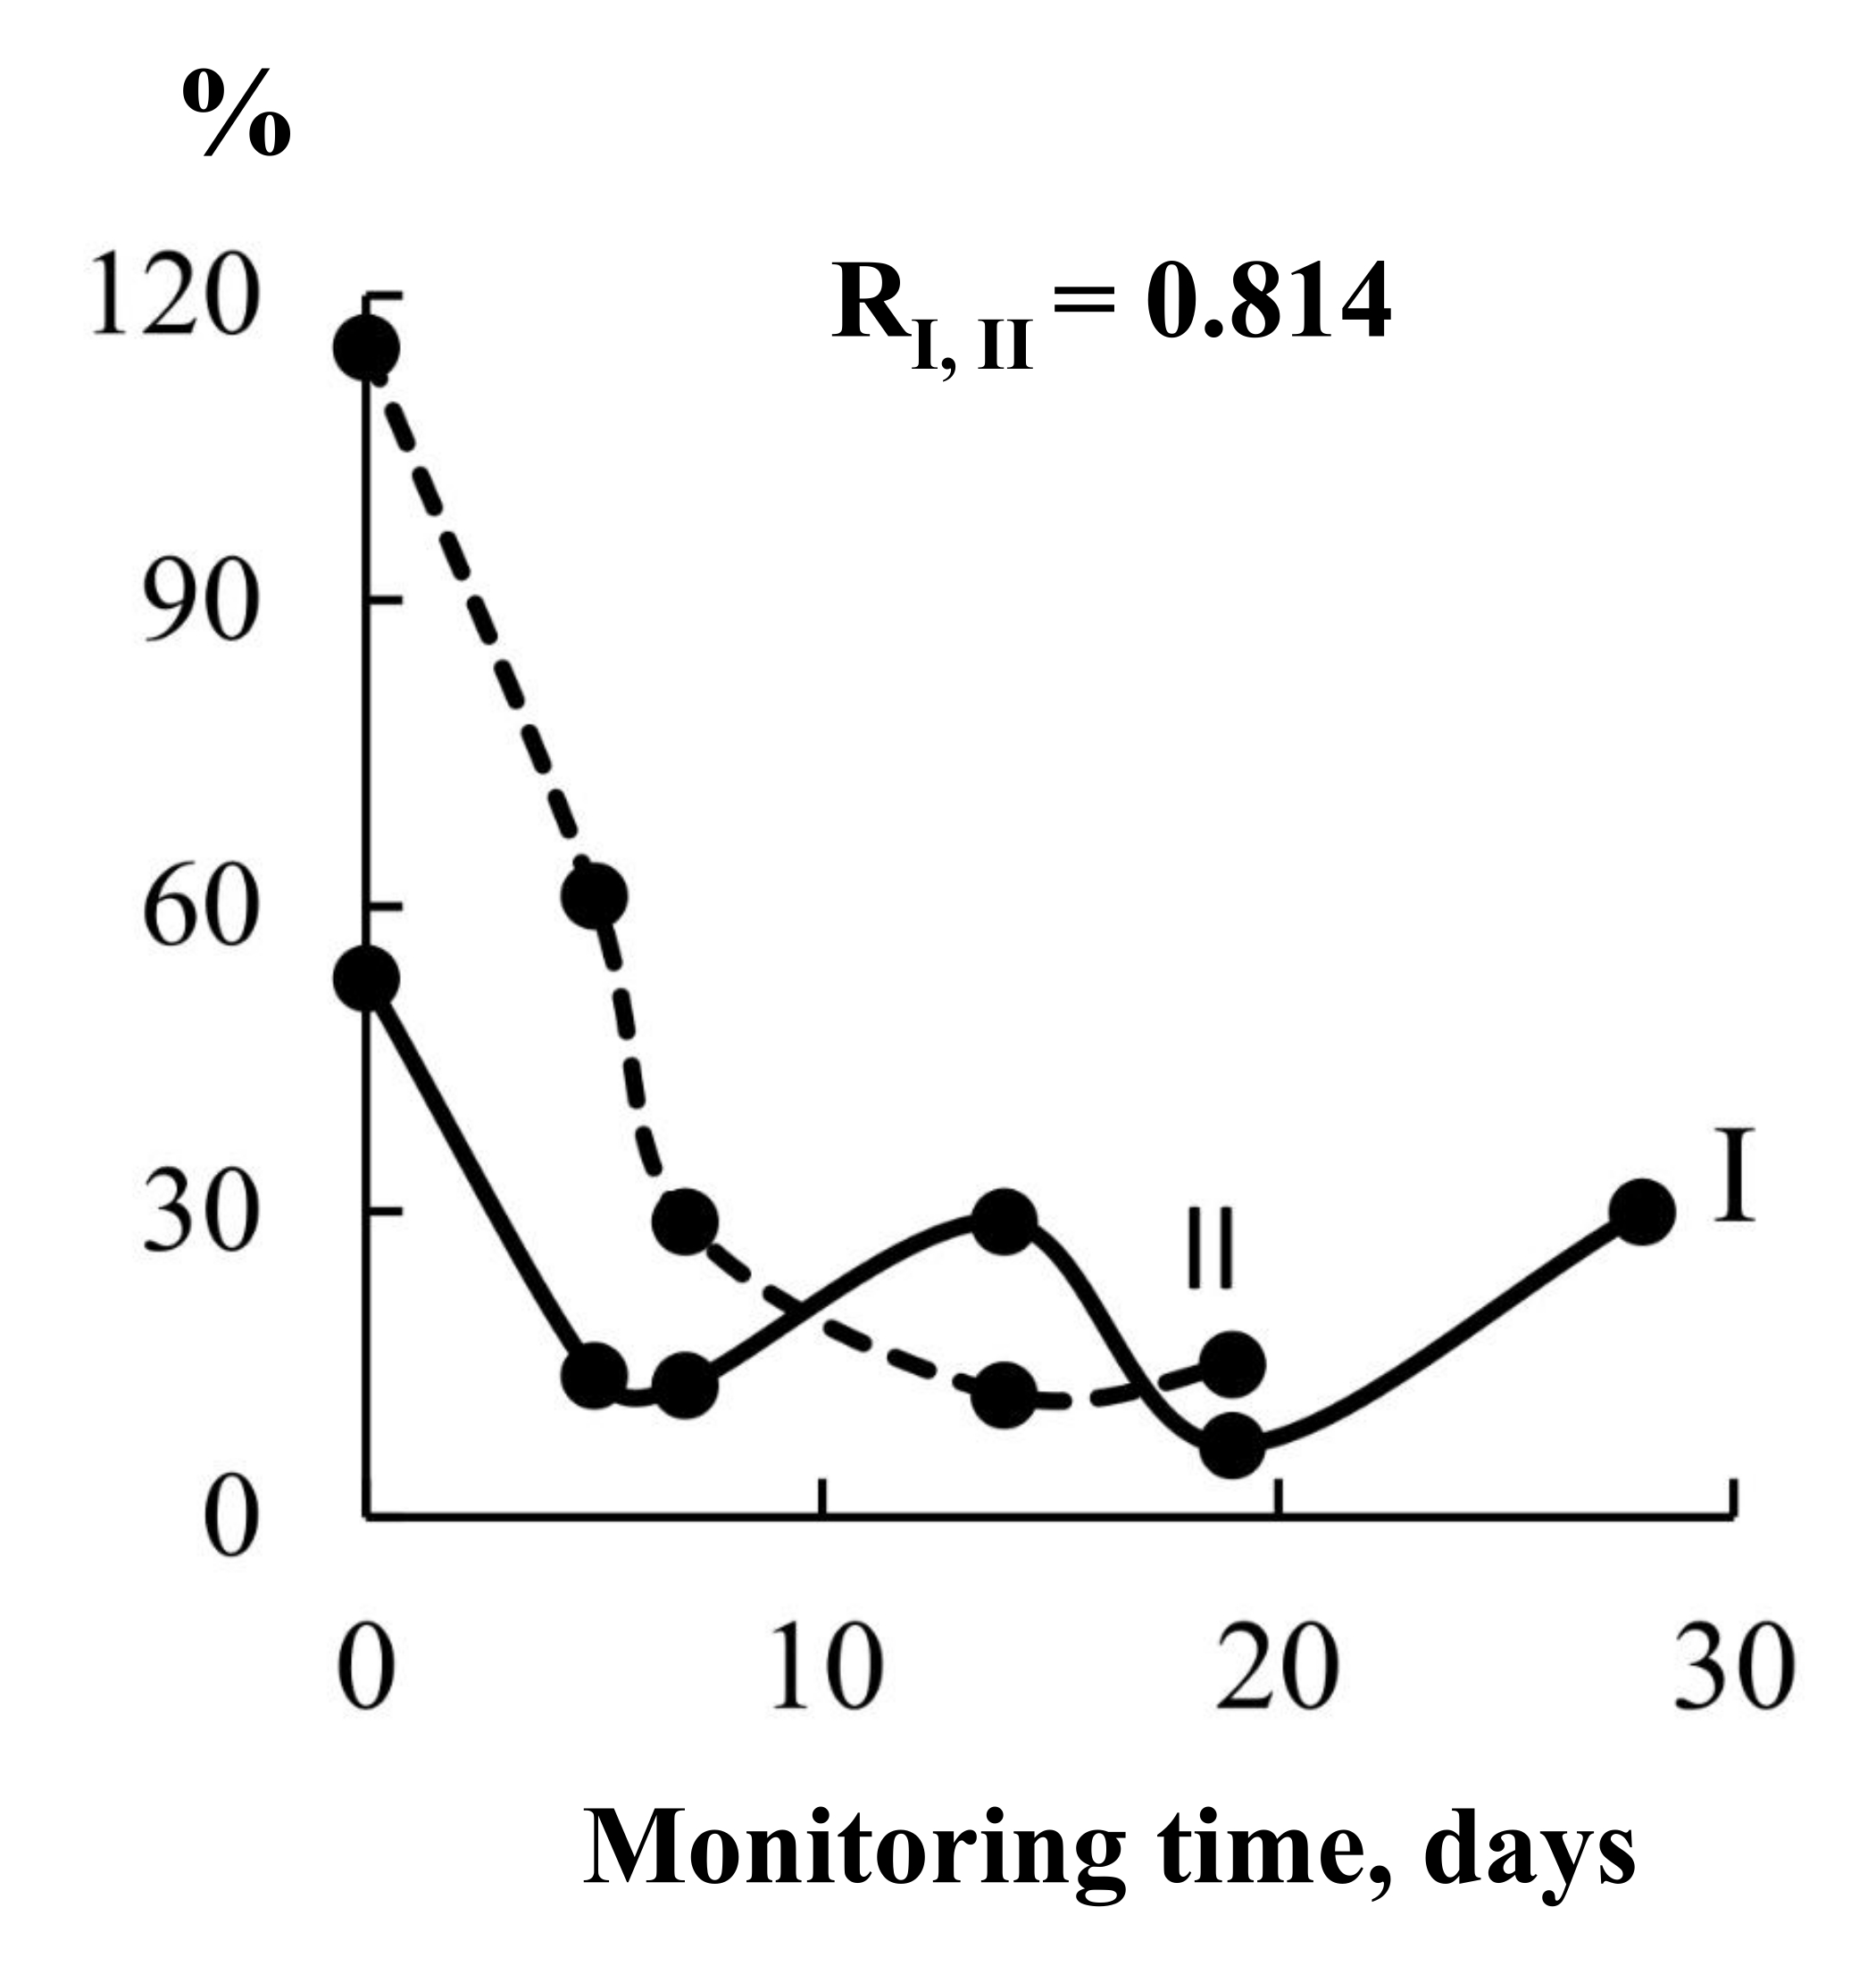 | |
| 14/07/2020 (2) | 0.196 (1, 2) | ||
| 16/07/2020 (3) | –0.181 (2, 3) | ||
| 23/07/2020 (4) | –0.227 (3, 4) | ||
| 28/07/2020 (5) | 0.589 (4, 5) | ||
| 06/08/2020 (6) | 0.175 (1, 6)0.520 (5, 6) | ||
| 15/07/2020after meals (7) | –0.326 (1 and 7) |
EN: electronic nose.
Based on the difference in maximum signals and areas under the output curves of the sensors before and after loading with urea, the closeness of the relationship between the analytical information of different devices at different stages of observations was assessed (Table 7).
It has been established that both sensors unidirectionally reflect changes in the composition of the mixture of exhaled drugs, the sensor from the array also reflects the effect of drugs during treatment. This means that the method of monitoring changes during treatment of gastrointestinal diseases by the signal of just one sensor and the exhalation of the lungs and skin undoubtedly has a future.
The totality of all the obtained results leads to the necessity of using a portable device based on a small number of sensors in mobile medicine and “on-site” conditions in order to maintain small dimensions of the closed detection cell and maintain versatility and selectivity of detecting changes in the composition of the drug mixture in the exhalation. The MAG-Med device is equipped with six channels for sensors and allows changing the library composition for the task. To ensure the versatility of the sensor set, polymer and solid-state modifiers were combined on the electrodes of the piezoelectric resonators. After manufacturing and training the films, the piezoelectric sensors were tested in vapors of substances to assess their activity and specificity for detecting microconcentrations of not only ammonia and carbon dioxide, but also other possible markers of pathogenic processes (amines, aliphatic acids, alcohols, ketones). The basic characteristics of some active and new phases of modifiers of the electrodes of piezoelectric resonators in vapors of test substances were assessed: noise, drift, and wear resistance. These characteristics are important for assessing the reproducibility of the sorption properties of modifiers depending on the number of interactions with analytes (Table 8).
Functional parameters of sorbent films in cyclohexylamine vapors.
| Sensor modifiers | Stability, % | Noise, Hz | Drift, Hz | |
|---|---|---|---|---|
| Beeswax | 15.4 | 99.4 | 4 | 9 |
| Eu2O3-SiO2 | 1.5 | 98, 8 | 2 | 10 |
| GA | 2.5 | 99.0 | 2 | 15 |
| ZrO(NO3)2 | 4.0 | 99.2 | 1 | 5 |
The noise was estimated as a shift in the base frequency of the piezoelectric sensor over 10 minutes (∆F10min, Hz)—a time 3–5 times greater than the measurement time. The drift was estimated as a change in the initial frequency of the piezoelectric sensor after desorption of an additional aggressive sorbate for 3–5 sorption cycles, taking into account the noise in the system (∆F3–5 cycles, Hz). The stability of the films was estimated by a decrease in the mass of the newly formed sorbent film (
To differentiate test substances in exhaled air when processing the results of piezoelectric microweighing, the following traditional parameters were used as variables: analytical signals of all piezoelectric sensors (∆Fmax, i, Hz), the area of the “visual imprint” (SV.o., Hz*s), and the change in the imprint area during testing ∆SV.o., Hz*s. The quantitative characteristic ∆SV.o., Hz*s is calculated as the difference between the sum of the areas under the full output curves of the sensors for 60 s of loading with a step of 1 s and the sum of the areas under the output curves of the sensors with a step of 5 s for the last 20 s. This algorithm makes it possible to isolate the analytical responses of the sensors to light gases, including ammonia. The use of solid-state sorbents on key sensors has accelerated sorption-desorption processes, which has allowed for reducing the time between air samples by 2 times, i.e., to reduce the mucosa scanning step. It becomes possible to determine the foci of inflammation in the esophagus, stomach, to detect the presence of other urease-active organisms or inflammation without them. Such differentiation is especially important in pediatric gastroenterology, since it can localize H. pylori colonies throughout the mucosa, and it becomes more reliable to differentiate the problem. Using the example of a volunteer from Group 2, with pronounced complaints of discomfort in the stomach, we will demonstrate how the information content of the urease test changes (Figure 6).
View of the dependence of the analytical signal of the sensor with Eu2O3-SiO2 on the time of testing with the urease test of volunteer HA (Group 2) for different steps of exhaled air sampling: (1) 30.0 min; (2) 5.0 min; (3) 2.5 min.
Solid coatings allow for detailing the body’s response after taking the urea solution and highlighting more problem areas. Then, volunteers were tested on this array of sensors by exhalation, and 2 control points were considered informative for adults: 10 and 30 minutes after taking urea.
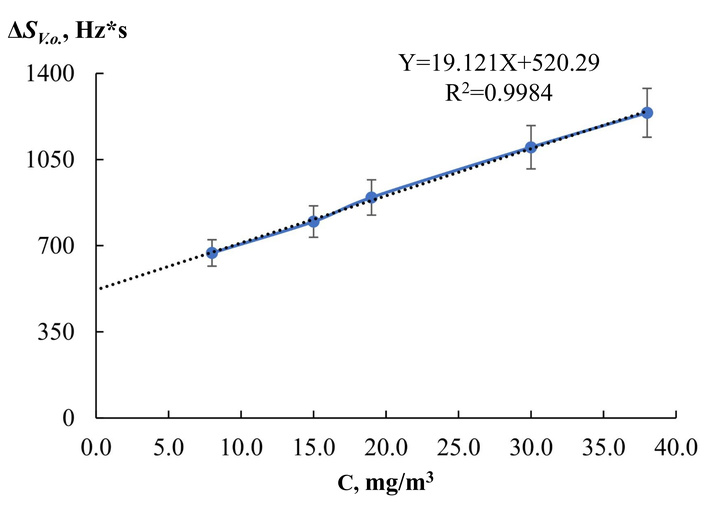
For the new sensor modifier in this study—mesophase porous silicate material with low-mass europium oxide—the sensitivity of microweighing of ammonia vapors in the range of diagnostically significant concentrations was assessed (Figure 7):
H. pylori is not active: 0–2 mg/m3;
one cross “+”: 2–6 mg/m3;
two crosses “++”: 6–15 mg/m3;
three crosses “+++”: 15–30 mg/m3.
The limit of reliable detection of ammonia vapor by a sensor with Eu2O3-SiO2 nanoparticles is Cmin = 15 mg/m3. This concentration is within the range of the highest activity of H. pylori—three crosses (+++). This means that the sensor with Eu2O3-SiO2 can reliably record high activity of microorganism colonies and already obvious processes of pathogenic bacteria’s impact on the gastrointestinal tract by the analysis of exhaled air. For lower activity levels, it is necessary to use all sensors sensitive to ammonia. Further scanning of the condition of volunteers from groups 1 and 2 was carried out by signals from 4 sensors, fast-acting (with solid coatings) and sensitive to ammonia, amines, alcohols, and acetone.
The subjects were tested on an empty stomach from 8:00 to 12:00 to exclude the influence of various factors, especially food intake, on the composition of the exhalation. The sensory analysis technique using the Med-SEN EN consisted of sampling 5 cm3 of air from the subject’s mouth before taking the urea solution (basal, zero level), the first air sampling after taking 50 cm3 of the urea solution after 1.0 and/or 2.5 minutes, then sampling was carried out with a step of 2.5 minutes up to 30.0 minutes (when recording an increase in the sensor response, the range was expanded to 40.0–45.0 minutes).
In the software of the device, geometric figures constructed in the form of circular diagrams of signals from 4 sensors with a step of 10 s (kinetic “visual fingerprints” of sensor signals, V.o.) were recorded and compared by superimposing them. The simplest information about the reaction of the mucous membranes to the urea solution is the relative difference in the area of V.o. for the initial (zero, basal) level (before the load) and the figure obtained at 10 and 30 minutes of scanning d, %. The criteria for making a decision on H. pylori activity and titer are described in the experimental section. Additionally, all data obtained during testing were analyzed.
Two volunteers from Group 1 (“conditional norm”) did not experience pain, other problems with the stomach, or digestion. One of them (labeled samples U) had not previously been tested for H. pylori. Volunteer T had previously consulted a gastroenterologist, undergone FGS with a negative test for infection associated with this bacterium. The results of testing and comparison of V.o. for them are presented in Table 9. It was found that according to the results of comparison of V.o. of signal figures of 4 sensors at two points, only volunteer T has no response to the provocation of urease-active bacteria. It is impossible to absolutely deny the infection in this case, but it is permissible to exclude its effect on the state of digestion. The second volunteer from this group has an increased reaction to the urea solution in the first 10 minutes after the load. A thorough survey revealed that discomfort occurs periodically, on an empty stomach. It is known that patients with hypochlorhydria have many urease-positive bacteria on the mucous membrane of the esophagus and stomach, except for H. pylori. A high concentration of urease producers in an acid-free stomach can be the cause of false-positive results in tests if the scanning time in adults is not observed for this particular bacterium [31]. It is not possible to check the acidity in a laboratory setting, so a negative test for infection with the possible development of inflammation of the esophageal mucosa was recorded (take control of the food intake regimen).
“Visual fingerprints” of signals from 4 informative sensors for subjects of Group 1 at points 10 and 30 min after the moment of urea loading in exhaled air samples and at the initial point (before loading, 0 min).
| Description of the volunteers’ condition at the time of testing | Comparison of signal fingerprints at zero load level (pink) and after 10 min (blue) | Comparison of signal fingerprints at zero load level (pink) and after 30 min (blue) | Final conclusion on sensory evaluation |
|---|---|---|---|
| T1.0, H. pylori test is negative | 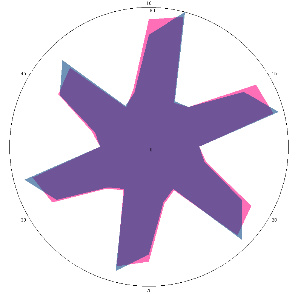 | 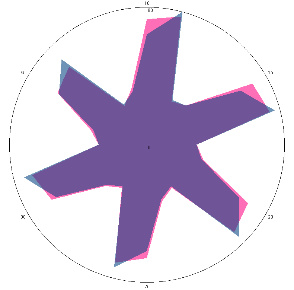 | Negative, H. pylori not active |
| d, % | 4.9 (not significant difference, –) | 2.3 (–) | |
| U1.0, H. pylori test is negative, there is discomfort in the stomach | 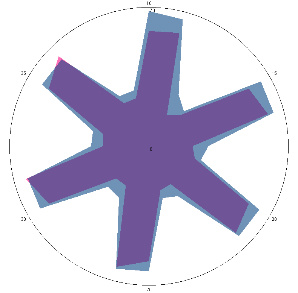 | 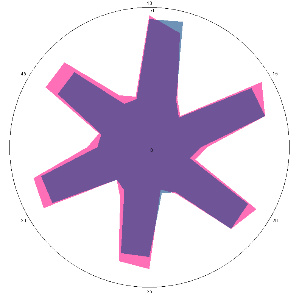 | Negative, H. pylori not active, possible inflammation in the esophagus/colonization with other urease-active bacteria |
| d, % | 25 (significant difference, +) | –11 (–) | |
| K1.0, H. pylori test not performed, stomach discomfort, pain on an empty stomach | 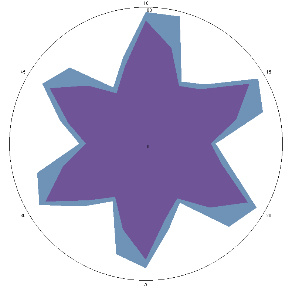 | 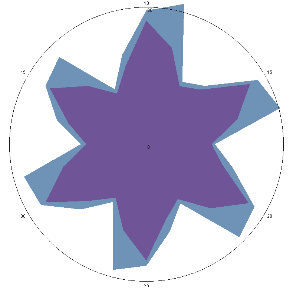 | Positive, high probability of H. pylori activity |
| d, % | 32 (++) | 40 (noticeable, ++) | |
| K1.1, H. pylori test not performed, after seven days of diet and regular meals | 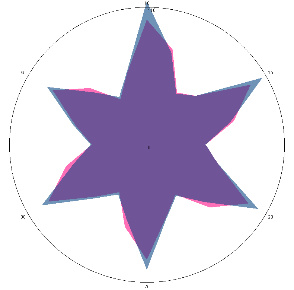 | 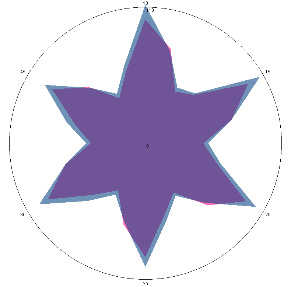 | Negative, H. pylori not active |
| d, % | 4 (–) | 13 (–) | |
| G1.0.1, severe aching pain in the stomach and back, painful reaction to food, nausea (before the H. pylori test), 10/03/2022 | 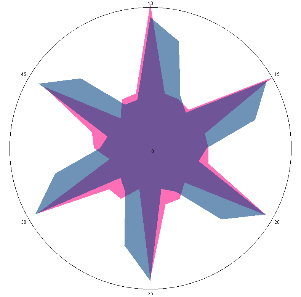 | 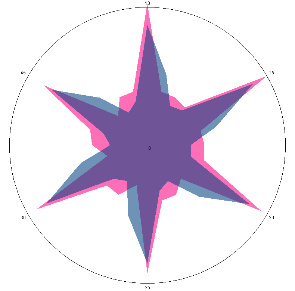 | Negative, H. pylori is not active, inflammation in the esophagus is possible |
| d, % | 37 (++) | 4 (–) |
The relative difference in the area of the figures, d, %, correlates with the classification of the degrees of contamination of the mucous membrane of Helicobacter pylori based on the number of microbial bodies in the field of view: lack of activity (–), weak (+) is up to 20 microbial bodies; the average (++) is up to 40 microbial bodies.
To compare different volunteer reactions, Table 9 shows the results for volunteer K, who is assigned to Group 2 (“there are problems with the gastrointestinal tract”), has complaints of pain, nausea, painful reactions to food, and smokes. At the time of the first scan, the volunteer had positive responses at both diagnostic points—10 and 30 minutes. At the same time, the level of quantitative differences in response to provocation allows us to state that the level of H. pylori activity is high. The volunteer was recommended to undergo a standard examination and consult a specialist. After a week of dietary and regular nutrition, without contacting a specialist, the volunteer was retested in compliance with strict preparation rules, especially without smoking. The test showed that sample K1 (Table 9) corresponds to a negative reaction to the urease test at the 10-minute point and at the border of questionable activity for the 30-minute point. This demonstrates the high sensitivity of the sensors to markers of mucosal inflammation, which developed equally in this volunteer by the first control point, and the influence of smoking on the test results.
Also in Table 9 are presented the results of the first scan of volunteer G from Group 2 with vivid symptoms and complaints: pain and a feeling of fullness in the abdomen; a feeling of early satiety; bloating; nausea; loss of appetite. The data obtained are identical to those of volunteer U without complaints, but with a greater degree of inflammation of the esophagus.
The obtained results show low selectivity of the detector based on 4 sensors to ammonia against the background of volatile amines. And at this stage of the study, the only correct answer to the question about possible H. pylori activity is a positive answer for 30 minutes. On the other hand, the sensors reliably recognize disorders of the mucous membranes of the esophagus and stomach, which also encourages further research on the hypothesis of the test prediction (Table 10).
Hypothesis of diagnostic assessments based on the results of the breath test.
| Result in 10 min | Conclusion | Result in 30 min | Conclusion | Final conclusion |
|---|---|---|---|---|
| – | No inflammation of the esophagus | – | Inactive H. pylori | If there are no complaints: normal. |
| – | No inflammation of the esophagus | – | Inactive H. pylori | If there are complaints: not associated with H. pylori. |
| – | No inflammation of the esophagus | + | Active H. pylori | The test is positive.Activity level by d, % (+, ++, +++). |
| + | Inflammation of the esophagus | – | Inactive H. pylori | Urease-producing bacteria, “Gram-negative”.H. pylori test is negative. |
| + | Inflammation of the esophagus | + | Active H. pylori | The test is positive.Activity level by d, % (+, ++, +++). |
The relative difference in the area of the figures, d, %, correlates with the classification of the degrees of contamination of the mucous membrane of Helicobacter pylori (H. pylori) based on the number of microbial bodies in the field of view: lack of activity (–), weak (+) is up to 20 microbial bodies; the average (++) is up to 40 microbial bodies; high (+++) is more than 40 microbial bodies.
It is impossible not to take into account the possibility of obtaining false positive results due to the fact that in patients with gastrointestinal tract pathology, its upper sections are populated by “Gram-negative” bacteria, many species of which are capable of producing urease, and the most common in humans, Proteus vulgaris and Proteus mirabilis, are capable of breaking down urea and the same time as H. pylori [32]. False positive results of the urease breath test are possible due to the presence of other sources of urease. The oral cavity and pharynx can be colonized with urease-producing bacteria, which can cause an erroneous test result [33]. However, sensors with solid-state coatings allow specifying the focus of a positive response, which helps differentiate diagnostics.
Let us test the proposed hypothesis of diagnostic assessments of the state of the mucous membranes and H. pylori activity based on the results of a breath test with exhalation detection by a library of solid-state piezoelectric sensors, using the example of two volunteers from Group 2.
Volunteer HA came with complaints typical of the development of helicobacteriosis. The results of the primary test showed (Table 11) an elevated level of H. pylori activity. As a result of standard diagnostic procedures and treatment prescription by a gastroenterologist, changes in the condition were recorded using the sensory method, up to a rapid negative reaction, while the test was positive even against the background of taking bismuth-containing drugs, which confirms the correctness of the conclusions about treating the volunteer in isolation with detection by a non-specific set of sensors and a health bioscanner. Early termination of treatment led to a sharp and even more active growth of the H. pylori population, which corresponds to its response to insufficient action of antibiotics. According to the accepted hypothesis, the result of the reaction to 10 minutes of scanning remains insufficiently characterized. The same picture was observed in volunteer K, whose condition improved without anti-Helicobacter therapy, and volunteer HA, in whom a stable negative response could not be recorded even after therapy. The infection became chronic. This monitoring showed that the response at 30 minutes after scanning will be dominant for making a decision on H. pylori therapy. An additional positive response at 10 minutes should, in any case, diagnose patients as not in the normal condition and place them in a risk group with the appointment of traditional standard diagnostic procedures.
Results of monitoring the condition of volunteer HA (22 years old) with an established positive reaction to the H. pylori test, with a violation of the treatment protocol.
| Description of the volunteers’ condition at the time of testing | Comparison of signal fingerprints at zero load level (pink) and after 10 min (blue) | Comparison of signal fingerprints at zero load level (pink) and after 30 min (blue) | Final conclusion on the sensory assessment of H. pylori, taking into account the accepted hypothesis |
|---|---|---|---|
| HA1.0, H. pylori test not performed, nausea, 16/03/2022 | 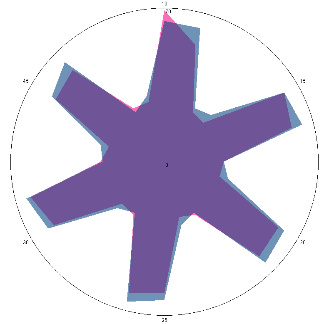 | 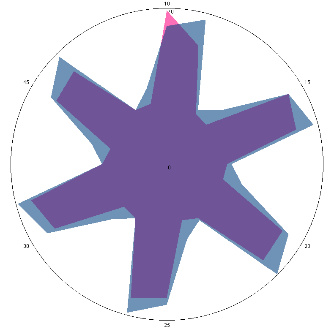 | The test is positive (+), without inflammation of the esophagus.I went to see a doctor and was prescribed therapy. |
| d, % | 11 (–) | 23 (++) | |
| HA1.1, H. pylori test positive, condition improved, 18/03/2022, 3 days of therapy | 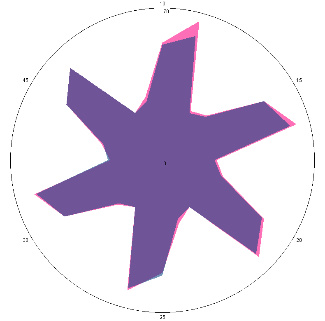 | 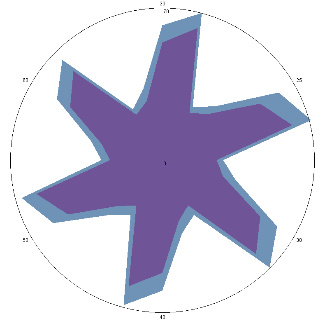 | The test is positive (+), without inflammation of the esophagus, the titer has not changed. |
| d, % | 4 (–) | 34 (++) | |
| HA1.2, improvement of condition, 21/03/2022, 6 days of therapy | 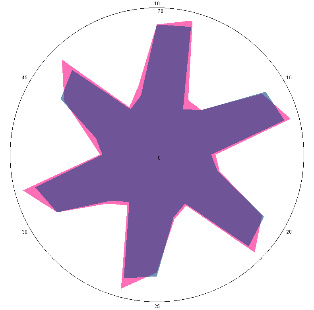 | 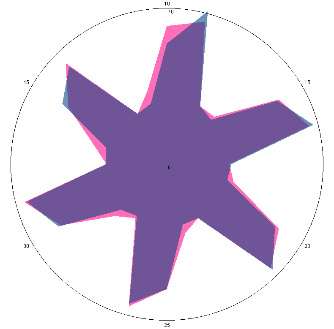 | The test is negative.Stopped treatment. |
| d, % | 7.8 (–) | 5 (–) | |
| HA1.3, complaints returned, pain, nausea, 28/03/2022 | 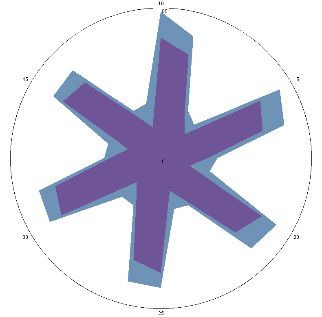 | 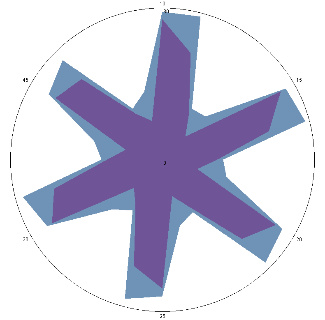 | Test is positive (++). Significant deterioration of the condition. Inflammation of the esophagus.Therapy has been resumed. |
| d, % | 47 (+++) | 53 (+++) | |
| HA1.3, emotional tension, stress, periodic pain. After therapy, 18/05/2022 | 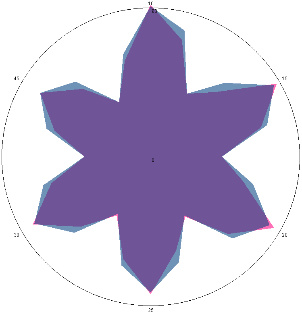 | 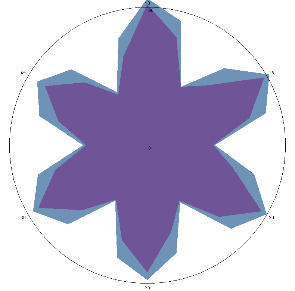 | The test is positive (+), without inflammation of the esophagus.Chronic form. |
| d, % | 7 (–) | 26 (++) |
The relative difference in the area of the figures, d, %, correlates with the classification of the degrees of contamination of the mucous membrane of Helicobacter pylori (H. pylori) based on the number of microbial bodies in the field of view: lack of activity (–); the average (++) is up to 40 microbial bodies; high (+++) is more than 40 microbial bodies.
Let us check the refined version of decision-making using the example of volunteer G from Group 2 (Table 12). The difference from volunteer HA was that after the first test, the reaction was clearly positive for 10 minutes, but not for 30 minutes (Table 9). The volunteer had been correcting his condition for a long time with diets, dietary supplements, and stimulating the immune system, which led to a sharp deterioration in his condition. Therapy was administered as prescribed by a gastroenterologist with confirmation of a positive response using a standard diagnostic method. In this volunteer, an exacerbation of a stomach disease associated with the activity of H. pylori is directly dependent on the long-term stress he experienced. This is confirmed by the example of strong activation of the disease just 3 weeks after a negative test, after treatment as a result of the stress he experienced (Table 12).
Results of monitoring the condition of volunteer G (55 years old) with an established positive reaction to the H. pylori test, according to sensory assessment, with provocation of deterioration of the condition by stress.
| Description of the volunteers’ condition at the time of testing | Comparison of signal fingerprints at zero load level (pink) and after 10 min (blue) | Comparison of signal fingerprints at zero load level (pink) and after 30 min (blue) | Final conclusion on sensory evaluation |
|---|---|---|---|
| G1.1, periodic, (H. pylori test not performed) second control point 17/03/2022, diet week |  |  | The test is negative. |
| d, % | 4.2 (–) | 5.6 (–) | |
| G0.2, pain, nausea (H. pylori test not performed), repeat visit, 11/01/2023 | 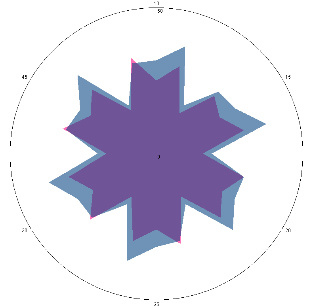 | 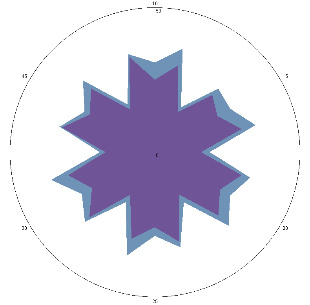 | H. pylori test is positive (+), inflammation of the esophagus. |
| d, % | 33 (++) | 29 (++) | |
| G1.2.1, pain, nausea (H. pylori test not performed), diet 14 days, 24/01/2023 | 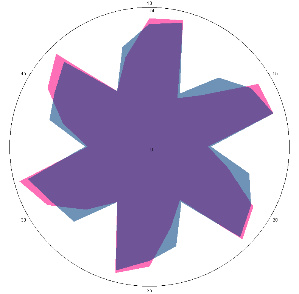 | 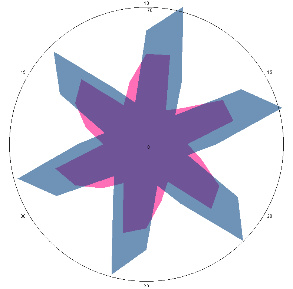 | The H. pylori titer has increased (+++), and the condition of the esophagus has improved. |
| d, % | 4.1 (–) | 62 (strong, +++) | |
| G1.2.2, condition improved (H. pylori test not performed), diet and dietary supplements, antimicrobial drugs 7 days, 01/02/2023 | 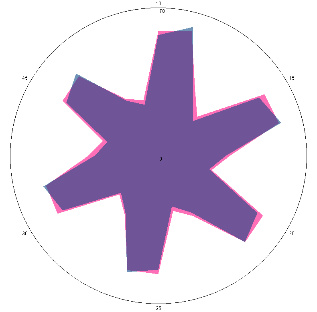 | 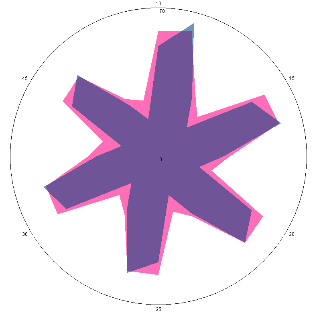 | The test is negative. |
| d, % | 5.6 (–) | –17 (–) | |
| G1.2.3, pain, nausea (H. pylori test is positive), pain provocation-stress, 24/03/2023 |  |  | H. pylori titer increase (+++), esophageal condition.Worse (++). |
| d, % | 35 (++) | 92 (+++) |
The relative difference in the area of the figures, d, %, correlates with the classification of the degrees of contamination of the mucous membrane of Helicobacter pylori (H. pylori)based on the number of microbial bodies in the field of view: lack of activity (–); the average (++) is up to 40 microbial bodies; high (+++) is more than 40 microbial bodies.
The results of studies for the entire period from 2020 to 2023 using various devices and approaches to diagnostics using piezosensors allow us to talk about the prospects of their use. High sensitivity, multi-level analytical information on changes in the drug mixture, simplicity and rapidity, and scanning differentiation are among the positive characteristics of the approach.
The diagnostic characteristics of the method are difficult to quantify due to the small sample of volunteers tested. However, examples with a reliably established infection assessment allow us to state the high specificity and sensitivity of the method.
DCH18K6: dicyclohexane-18-crown-6
DU: duodenal bulb
EN: electronic nose
FGS: fibrogastroscopy
H. pylori: Helicobacter pylori
PCR: polymerase chain reaction
QCM: quartz crystal microbalance
VCs: volatile compounds
VOC: volatile organic compound
The authors thank the volunteers and clinical partners involved in the study for their participation and support.
TAK: Conceptualization, Supervision, Project administration, Writing—review & editing. DM: Methodology, Software, Formal analysis, Investigation, Writing—original draft, Writing—review & editing. RU: Methodology, Software, Validation, Formal analysis, Investigation, Visualization, Writing—review & editing. AK: Resources, Data curation, Writing—review & editing. All authors read and approved the final manuscript.
The authors declare that they have no competing interests.
This study involving human participants was conducted in accordance with the ethical standards of the institutional research committee and with the 1964 Helsinki declaration and its later amendments. The study was approved by the Ethics Committee of Voronezh State Medical University named after N.N. Burdenko, approval number VSMU-2020-07.
Written informed consent was obtained from all individual participants included in the study.
Not applicable.
The datasets generated and/or analyzed during the current study are available from the corresponding author on reasonable request.
This research was supported by internal grants of the Institute, and no external funding was received. The funders had no role in study design, data collection and analysis, decision to publish, or preparation of the manuscript.
© The Author(s) 2025.
Open Exploration maintains a neutral stance on jurisdictional claims in published institutional affiliations and maps. All opinions expressed in this article are the personal views of the author(s) and do not represent the stance of the editorial team or the publisher.
Copyright: © The Author(s) 2025. This is an Open Access article licensed under a Creative Commons Attribution 4.0 International License (https://creativecommons.org/licenses/by/4.0/), which permits unrestricted use, sharing, adaptation, distribution and reproduction in any medium or format, for any purpose, even commercially, as long as you give appropriate credit to the original author(s) and the source, provide a link to the Creative Commons license, and indicate if changes were made.

View: 3667
Download: 28
Times Cited: 0
Luiza Gilmanovna Bektemirova ... Vasiliy Ivanovich Reshetnyak
Elias Kouroumalis ... Argyro Voumvouraki
Rosabel Corrales ... Rafael Llanes
Natalia V. Baryshnikova ... Alexander N. Suvorov
Surbhi Dumra, Abhishek Ray
Vasisht Karri ... Samir M. Dalia
Sophia Strukel ... Vikrant Rai