Pearson parameters and tightness of connection for the signal sample of one bioscanner sensor and a non-selective array of electronic nose sensors at different stages of monitoring.
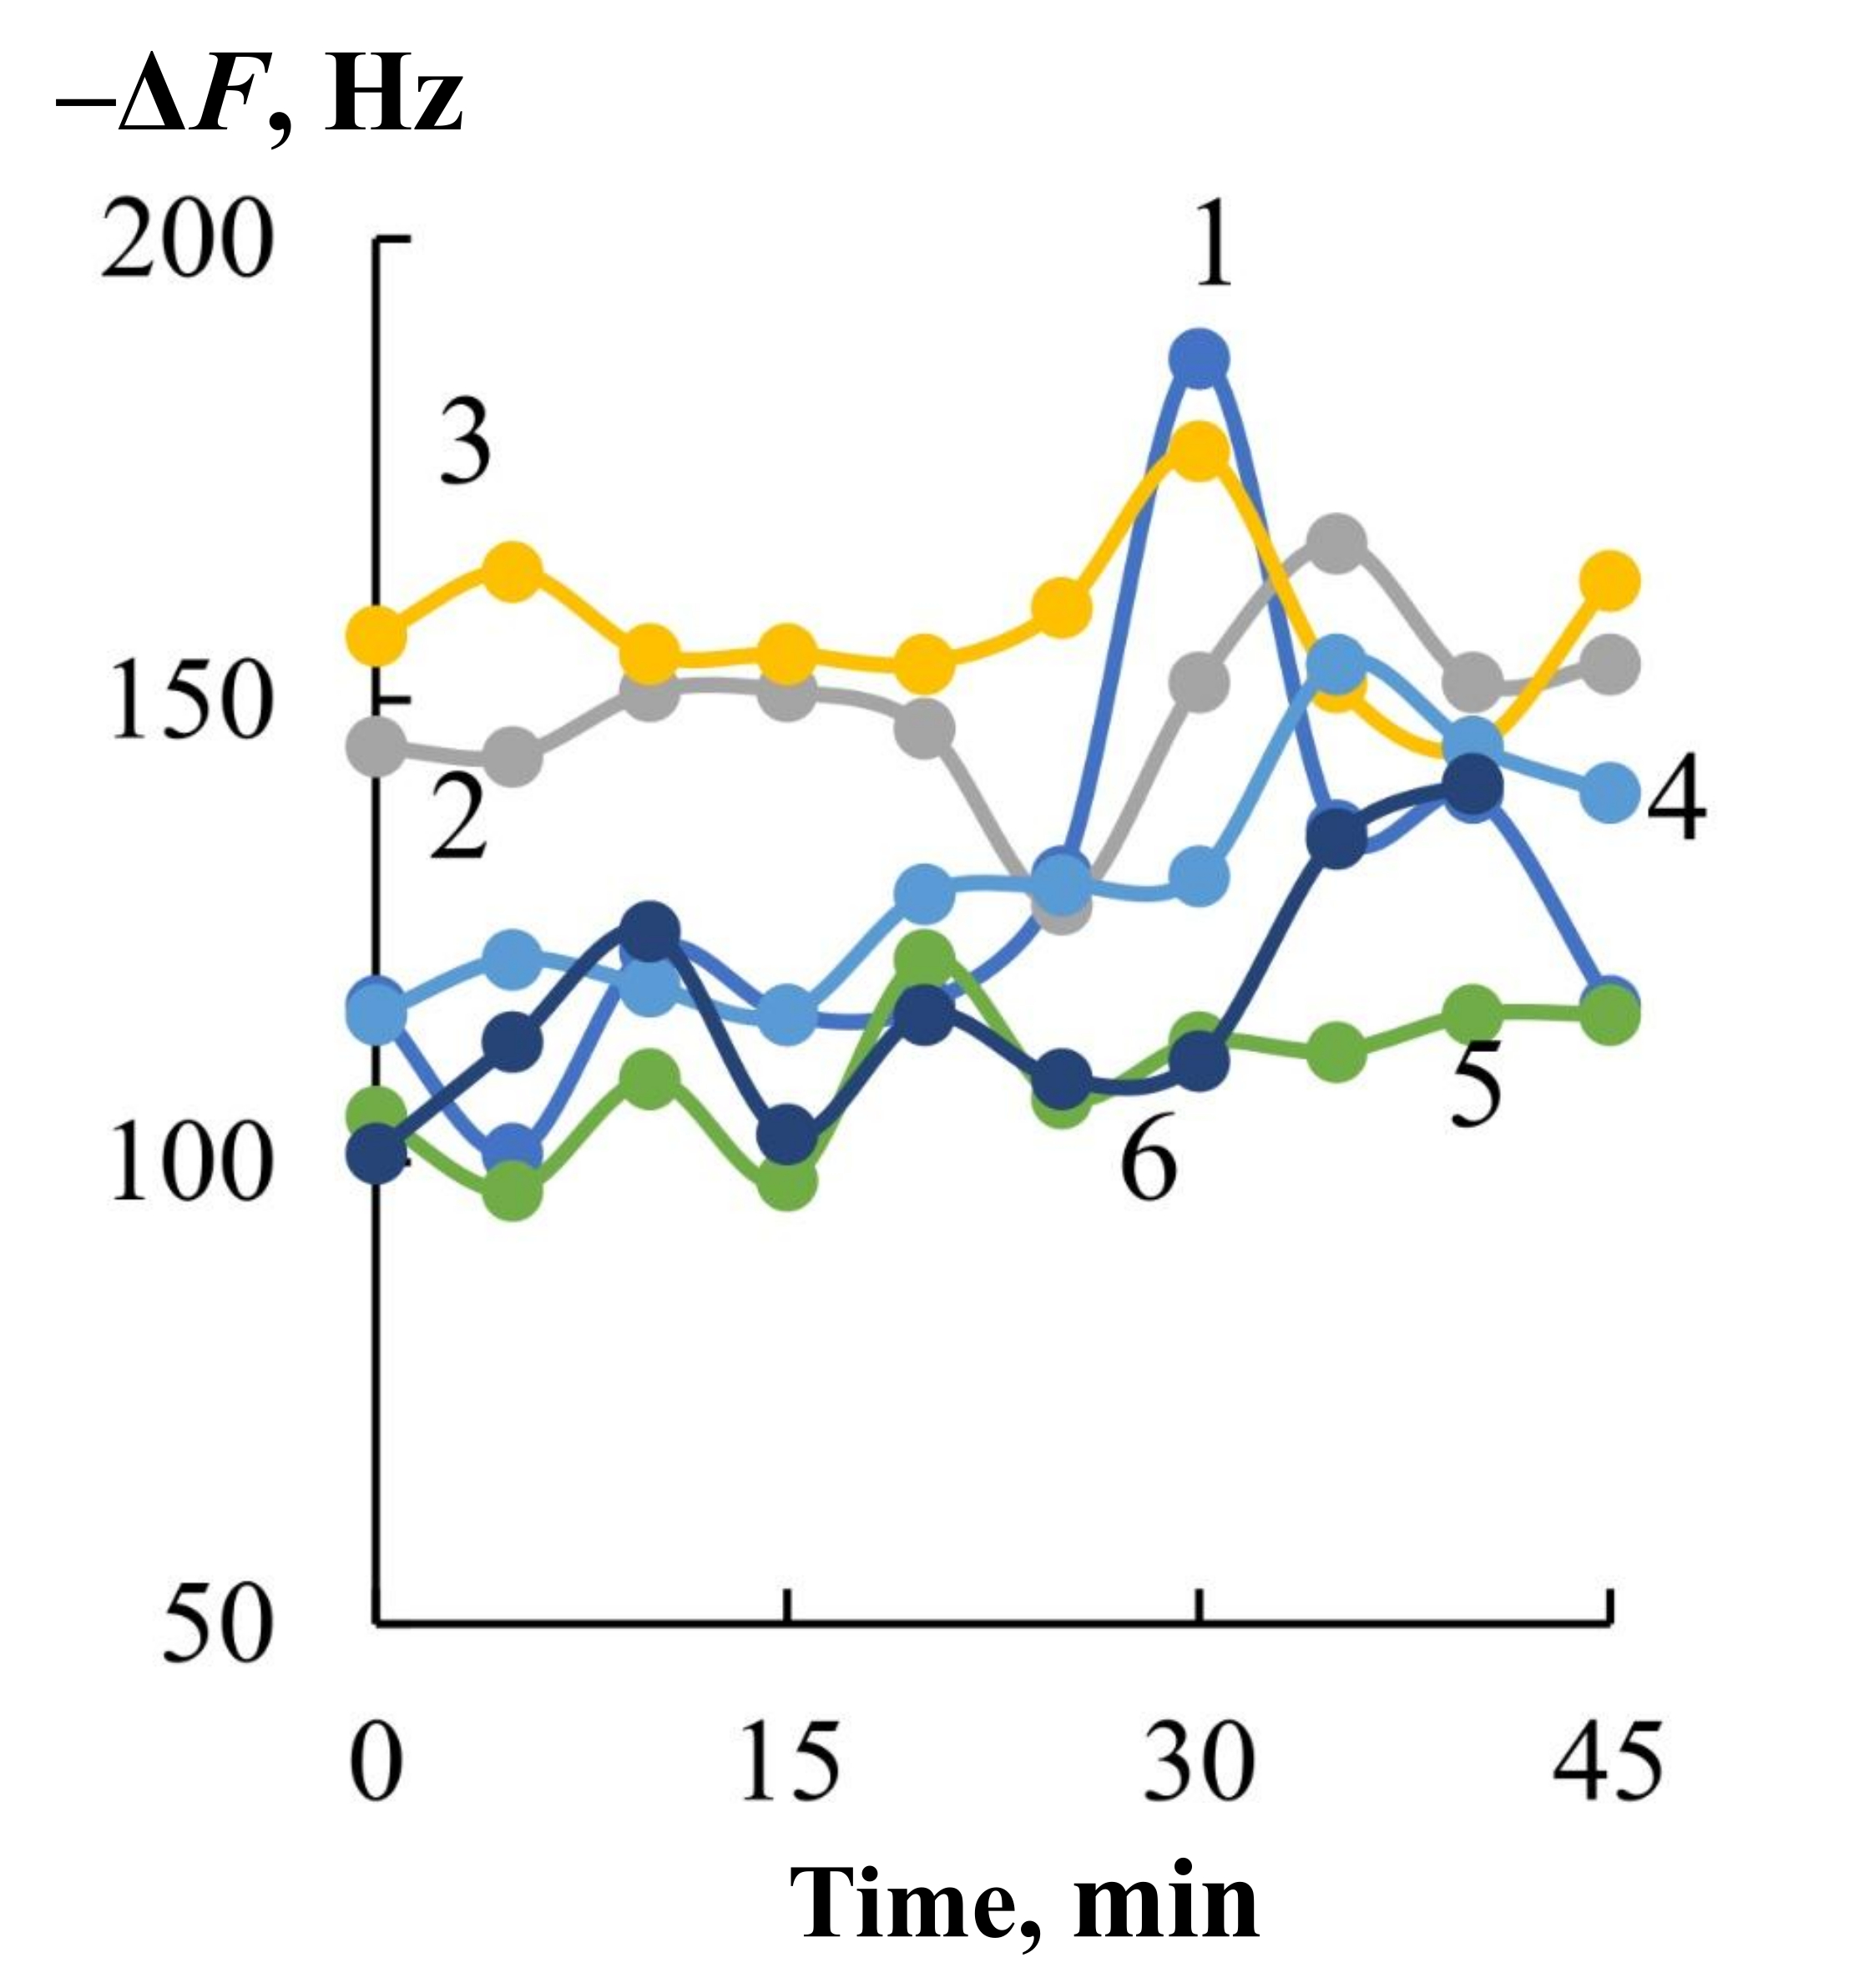
Control date (curve number on the graph)
Dynamics of the change of the signal of the active sensor in an array of EN
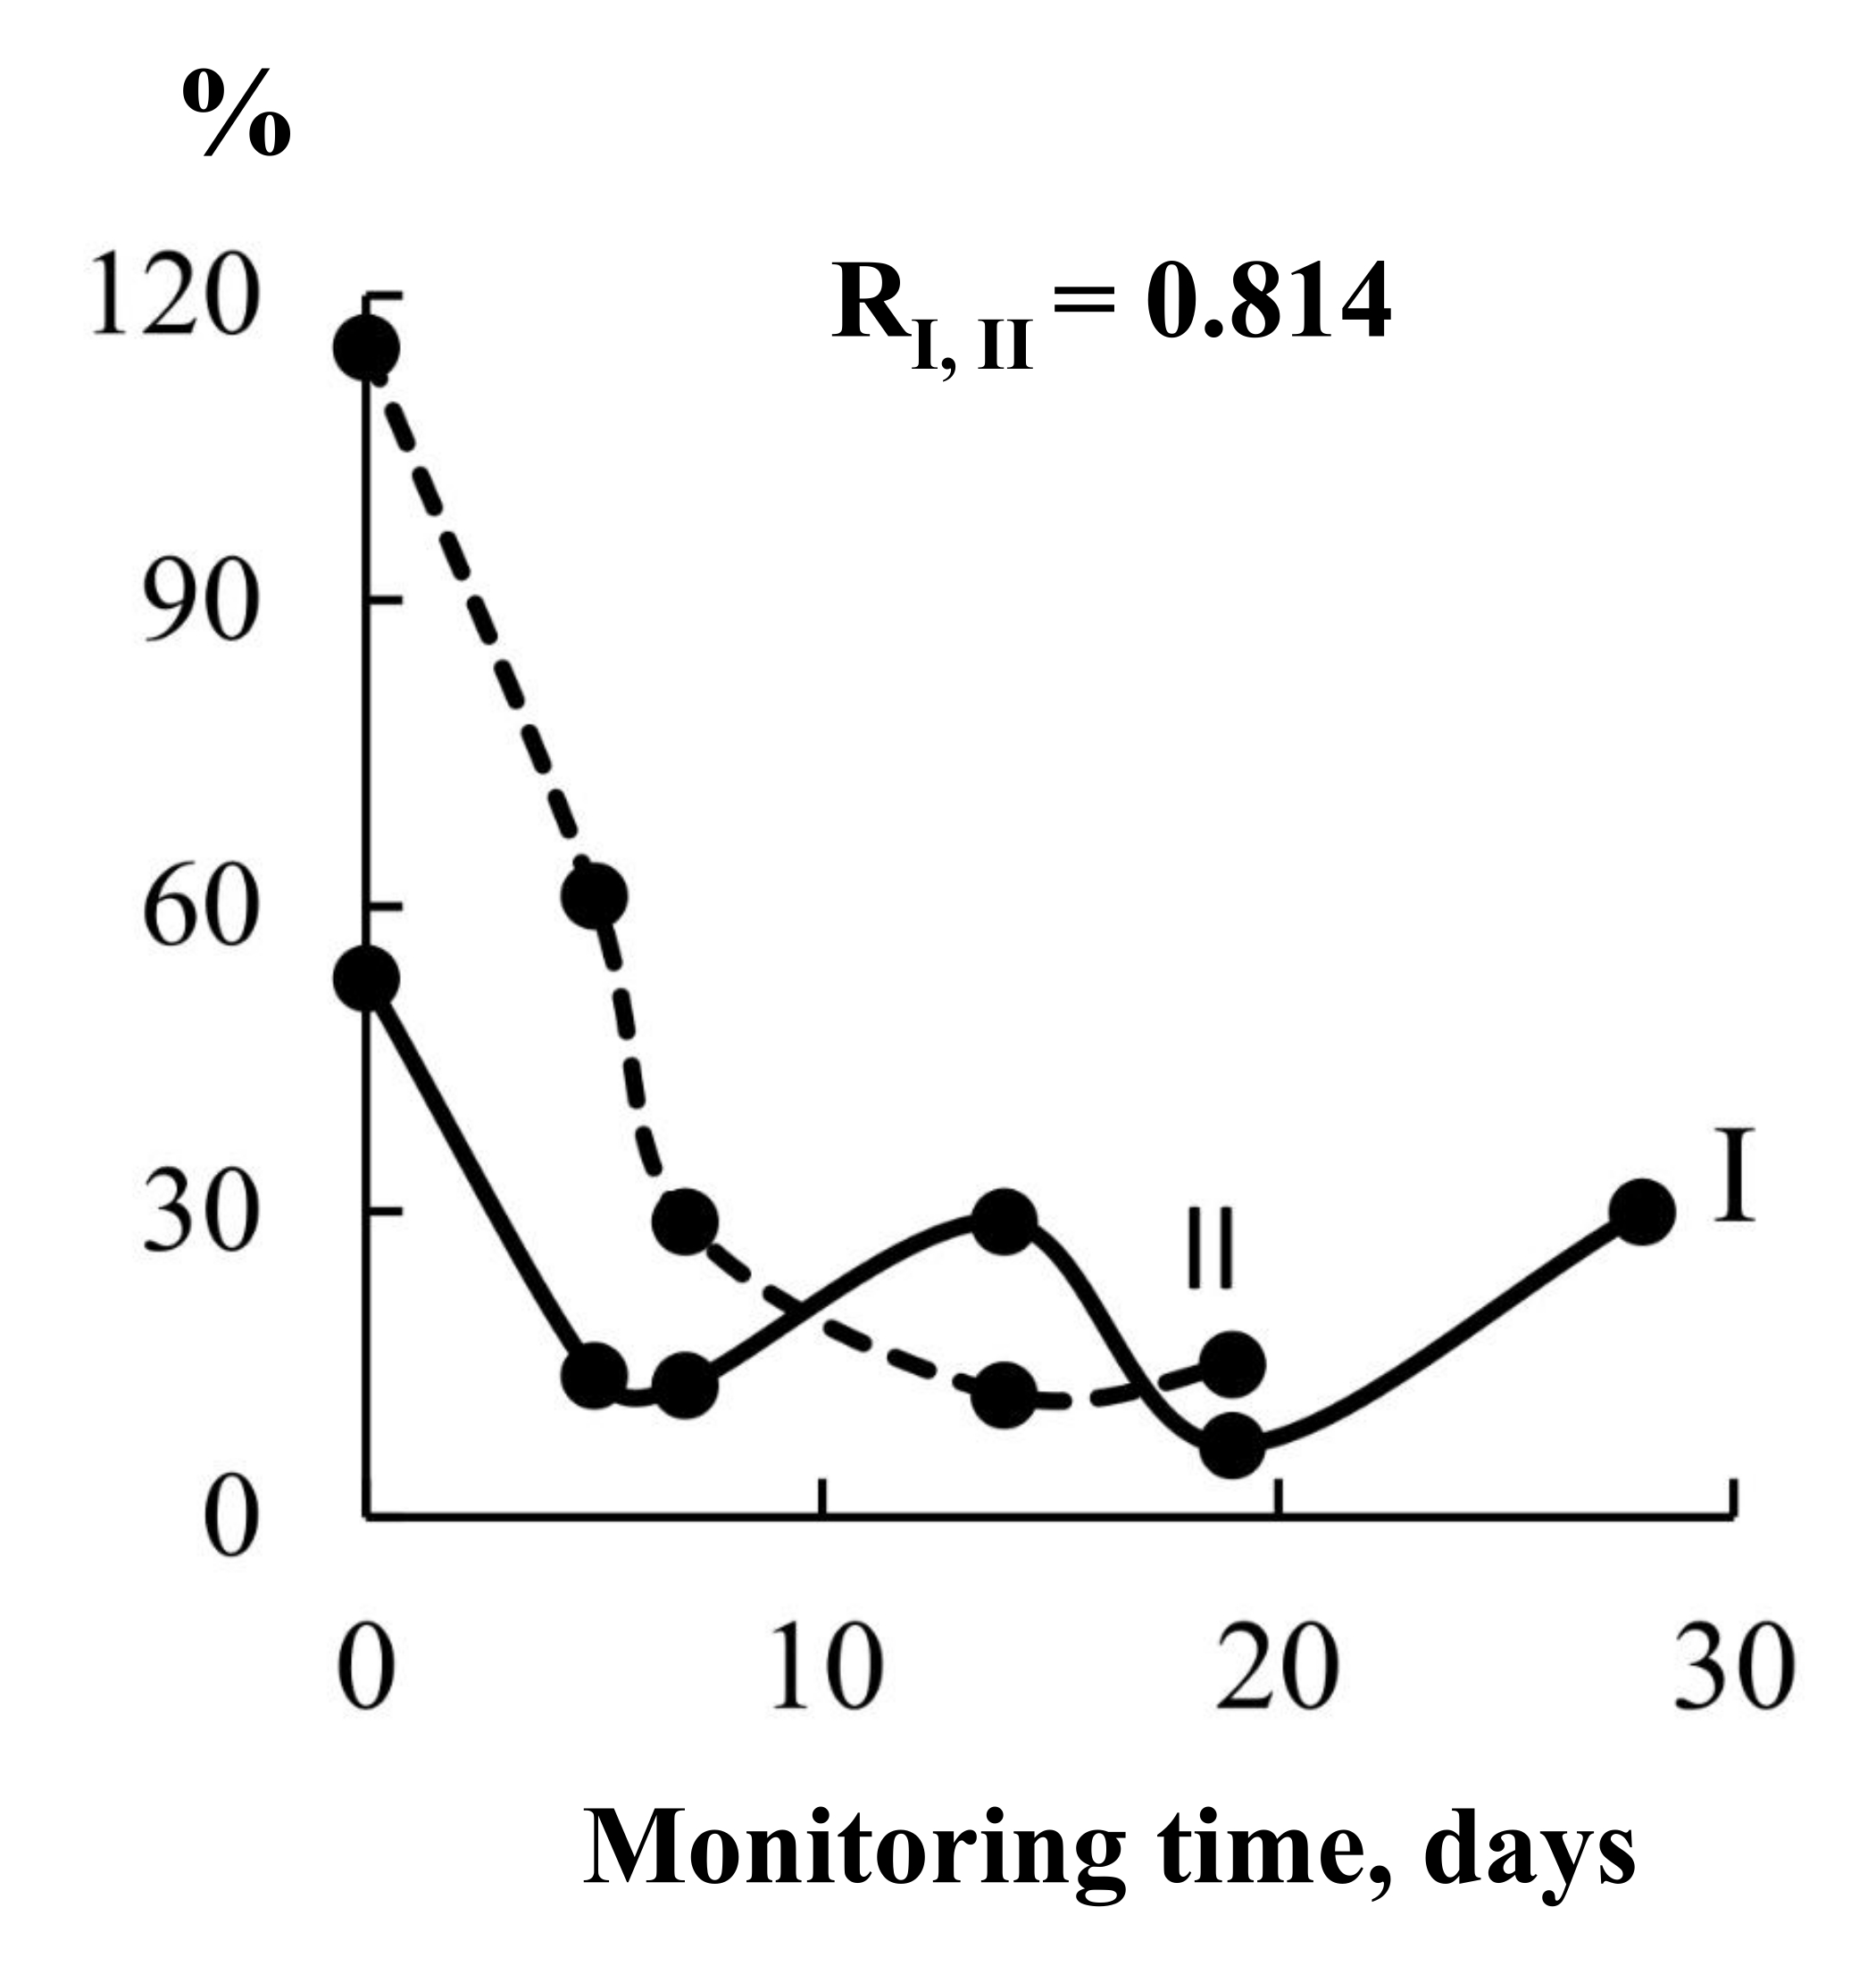
Relative change in the maximum expiratory response (%) of the lung EN sensors (I) and the skin on the right cheek of the bioscanner sensor (II) on different monitoring days
The authors thank the volunteers and clinical partners involved in the study for their participation and support.
Author contributions
TAK: Conceptualization, Supervision, Project administration, Writing—review & editing. DM: Methodology, Software, Formal analysis, Investigation, Writing—original draft, Writing—review & editing. RU: Methodology, Software, Validation, Formal analysis, Investigation, Visualization, Writing—review & editing. AK: Resources, Data curation, Writing—review & editing. All authors read and approved the final manuscript.
Conflicts of interest
The authors declare that they have no competing interests.
Ethical approval
This study involving human participants was conducted in accordance with the ethical standards of the institutional research committee and with the 1964 Helsinki declaration and its later amendments. The study was approved by the Ethics Committee of Voronezh State Medical University named after N.N. Burdenko, approval number VSMU-2020-07.
Consent to participate
Written informed consent was obtained from all individual participants included in the study.
Consent to publication
Not applicable.
Availability of data and materials
The datasets generated and/or analyzed during the current study are available from the corresponding author on reasonable request.
Funding
This research was supported by internal grants of the Institute, and no external funding was received. The funders had no role in study design, data collection and analysis, decision to publish, or preparation of the manuscript.
Open Exploration maintains a neutral stance on jurisdictional claims in published institutional affiliations and maps. All opinions expressed in this article are the personal views of the author(s) and do not represent the stance of the editorial team or the publisher.
Uemura N, Okamoto S, Yamamoto S, Matsumura N, Yamaguchi S, Yamakido M, et al. Helicobacter pylori Infection and the Development of Gastric Cancer.N Engl J Med. 2001;345:784–9. [DOI] [PubMed]
Wang S, Zhang, WM, Reineks E. Breath Tests for Detection of Helicobacter pylori and Aspergillus fumigatus. In: Tang YW, Stratton C, editors. Advanced Techniques in Diagnostic Microbiology. Boston: Springer; 2013. pp. 13–30. [DOI]
Kayali S, Aloe R, Bonaguri C, Gaiani F, Manfredi M, Leandro G, et al. Non-invasive tests for the diagnosis of helicobacter pylori: state of the art.Acta Biomed. 2018;89:58–64. [DOI] [PubMed] [PMC]
Kuchmenko TA, Shuba AA, Kuchmenko DA, Umarkhanov RU. Development of a Method for Assessing Helicobacter pylori Activity Based on Exhaled Air Composition with the Use of an Array of Piezoelectric Chemical Sensors.J Anal Chem. 2020;75:553–62. [DOI]
Riggio MP, Lennon A. Identification by PCR of Helicobacter pylori in subgingival plaque of adult periodontitis patients.J Med Microbiol. 1999;48:317–22. [DOI] [PubMed]
Isakov VA, Domaradsky IV. Helicobacteriosis. Moscow: Medpraktika-M; 2003. pp. 412. Russian.
Gressmann H, Linz B, Ghai R, Pleissner KP, Schlapbach R, Yamaoka Y, et al. Gain and Loss of Multiple Genes During the Evolution of Helicobacter pylori.PLoS Genet. 2005;1:e43. [DOI] [PubMed] [PMC]
Vaira D, Malfertheiner P, Mégraud F, Axon AT, Deltenre M, Gasbarrini G, et al. Noninvasive antigen-based assay for assessing Helicobacter pylori eradication: a European multicenter study. The European Helicobacter pylori HpSA Study Group.Am J Gastroenterol. 2000;95:925–9. [DOI] [PubMed]
Malfertheiner P, Mégraud F, O’Morain C, Hungin APS, Jones R, Axon A, et al.; The European Helicobacter Pylori Study Group (EHPSG). Current concepts in the management of Helicobacter pylori infection—The Maastricht 2–2000 Consensus Report.Aliment Pharmacol Ther. 2002;16:167–80. [DOI] [PubMed]
Leontyeva NI, Stcherbakov IT, Novikova LL, Grachyova NM, Khrennikov BN, Stcherbakova EG, et al. The assessment of invasive and noninvasive diagnostic techniques of Helicobacter pylori.Modern Technol Med. 2011;2:57–60. Russian.
Imanieh MHI, Dehghani SMD, Masjedi AM, Rezaianzadeh AR, Haghighat MH. The Role of Serological Tests in Diagnosis of Helicobacter pylori Infection in Children.J Compr Ped. 2014;5:e17422. [DOI]
Nguyen AM, el-Zaatari FA, Graham DY. Helicobacter pylori in the oral cavity. A critical review of the literature.Oral Surg Oral Med Oral Pathol Oral Radiol Endod. 1995;79:705–9. [DOI] [PubMed]
Zhang Z, Li Z, Wei K, Cao Z, Zhu Z, Chen R. Sweat as a source of non-invasive biomarkers for clinical diagnosis: An overview.Talanta. 2024;273:125865. [DOI] [PubMed]
Biomarkers Definitions Working Group. Biomarkers and surrogate endpoints: preferred definitions and conceptual framework.Clin Pharmacol Ther. 2001;69:89–95. [DOI] [PubMed]
Human Metabolome Database: Showing metabocard for Acetaldehyde (HMDB0000990) [Internet].Victoria: TMIC; c2023 [cited 2025 Feb 28]. Available from: https://hmdb.ca/metabolites/HMDB0000990
Filipiak W, Mochalski P, Filipiak A, Ager C, Cumeras R, Davis CE, et al. A Compendium of Volatile Organic Compounds (VOCs) Released By Human Cell Lines.Curr Med Chem. 2016;23:2112–31. [DOI] [PubMed] [PMC]
Kuchmenko TA, Menzhulina DA, Murakhovskii IA. Using Highly Sensitive Piezo Sensors in an Open System for the Diagnostic Analysis of Skin Volatile Substances.Zhurnal Analiticheskoi Khimii. 2023;78:711–27. Russian. [DOI]
Malfertheiner P, Megraud F, Rokkas T, Gisbert JP, Liou JM, Schulz C, et al.; European Helicobacter and Microbiota Study group. Management of Helicobacter pylori infection: the Maastricht VI/Florence consensus report.Gut. 2022;71:1724–62. [DOI] [PubMed]
Kuchmenko TA, Silina YE, Atiskova IY, Dzhurabayeva IS, Kuchmenko AM, inventor. A method for noninvasive diagnosis of Helicobacter pylori infection.Patent 2325845 of the Russian Federation. 2008 Oct 6.
Guevara B, Cogdill AG. Helicobacter pylori: A Review of Current Diagnostic and Management Strategies.Dig Dis Sci. 2020;65:1917–31. [DOI]
Kuchmenko TA, Kuchmenko DA, Shuba AA, inventor; Federal State Budgetary Educational Institution of Higher Education “Voronezh State University of Engineering Technologies” (FGBOU VO "VSUET") (RU), assignee. Method for obtaining diagnostic information based on skin odor.Patent for invention RU 2679409 C1. 2019 Feb 8.
Kuchmenko TA, Umarkhanov RU, Menzhulina DA. Biohydroxyapatite—a new phase for selective microweighing of vapors of organic compounds—markers of inflammation in the nasal mucus of calves and humans. Communication 1. Sorption in model systems.Sorption Chromatogr Proc. 2021;21:142–52.
Kuchmenko TA, Lvova LB. Piezelectric Chemosensors and Multisensory Systems. In: Schneider HJ, editor. Chemoresponsive Materials: Smart Materials for Chemical and Biological Stimulation. Cambridge: The Royal Society of Chemistry; 2022. pp. 567–603. [DOI]
Kuchmenko TA, Umarkhanov RU, Zvyagina OV. Development of Multiple Analytical Labels for Volatile Organic Compounds Based on the Results of Sorption on CdS Quantum Dots in Chitosan without and with Modification by Rhodamine 6G.J Anal Chem. 2025;80:327–38. [DOI]
Shah SC, Iyer PG, Moss SF. AGA Clinical Practice Update on the Management of Refractory Helicobacter pylori Infection: Expert Review.Gastroenterology. 2021;160:1831–41. [DOI] [PubMed] [PMC]
Bykov VL. Cytology and General Histology. Saint Petersburg: Sotis; 2000. Russian.
Head H. On disturbances of sensation, with special reference to the pain of visceral disease.Brain. 1893;16:1–133. [DOI]
Uotani T, Graham DY. Diagnosis of Helicobacter pylori using the rapid urease test.Ann Transl Med. 2015;3:9. [DOI] [PubMed] [PMC]
Marshall BJ, Warren JR. Unidentified Curved Bacilli in The Stomach of Patients with Gastritis and Peptic Ulceration.Lancet. 1984;1:1311–5. [DOI] [PubMed]
Logan RPH. The 14C urea breath test. In: Lee A, Megraud F, editors. Helicobacter Pylori Techniques for Clinical Diagnosis and Basic Research. London: WB Saunders Company Ltd; 1996. pp. 74–83.