 Original Article


Affiliation:
1Institute of Mental Health, School of Psychology, University of Nottingham, NG8 2BB Nottingham, UK
Email: blandine.french@nottingham.ac.uk; blandine.french@outlook.com
ORCID: https://orcid.org/0000-0002-9395-5919


 ,
,
Affiliation:
2Takeda UK, W2 6BD London, UK
Affiliation:
2Takeda UK, W2 6BD London, UK
Affiliation:
3Do-IT Solutions, University of South Wales, W2 6BD London, UK
ORCID: https://orcid.org/0009-0008-1680-8422
Explor Neuroprot Ther. 2026;6:1004163 DOI: https://doi.org/10.37349/ent.2026.1004163
Received: January 07, 2026 Accepted: May 11, 2026 Published: July 08, 2026
Academic Editor: Michele Roccella, University of Palermo, Italy; Rafael Franco, Universidad de Barcelona, Spain
The article belongs to the special issue Advances in the Pathogenesis, Diagnosis and Treatment of Attention Deficit Hyperactivity Disorder
Aim: Attention deficit hyperactivity disorder (ADHD) is a common condition impacting approximately 5% of children and 3–4% of adults in the United Kingdom (UK). While it cannot be cured, treatment has been shown to positively impact the difficulties associated with ADHD. However, ADHD is widely underdiagnosed and undertreated in the UK. This paper reports the results of a model developed to estimate pharmacological treatment rates by area across National Health Service (NHS) integrated care systems (ICSs) in England, health boards in Scotland and Wales, and health & social care trusts (HSCTs) in Northern Ireland.
Methods: The model used the UK general population and ADHD prevalence data to estimate the number of patients with ADHD in each area. Prescription data for medicines licensed for the treatment of ADHD were then used to estimate the number of patients who are untreated and treated, and the percentage treatment rates by area. The analysis was descriptive, focusing on quantifying geographic variation in treatment rates.
Results: Nationally, the estimated proportions of children and young people (CYP; 5–17 years) and adults (18–65 years) treated were 26.6% and 15.6%, respectively, of the expected ADHD populations. Treatment rates by ICS or health board in England, Scotland, and Wales ranged from 11.7% to 60.6% for the CYP population and 8.6% to 24.8% for the adult population (data for Northern Ireland were not available by age group). Overall treatment rates (ages 5–65 years) in Northern Ireland ranged from 6.7% in the lowest-ranking HSCT to 31.1% in the highest-ranking HSCT.
Conclusions: In the UK, there is currently a high degree of geographic variation across all NHS systems and a generally low level of treatment of ADHD, especially in adults. Up to a 4.6-fold difference in pharmacological treatment rates was observed between NHS service provider areas.
In the United Kingdom (UK), attention deficit hyperactivity disorder (ADHD) is estimated to affect approximately 5% of children [1, 2] and 3–4% of adults [3, 4] and is generally recognised as underdiagnosed and undertreated [2, 5]. ADHD can lead to considerable cognitive and behavioural impairment, affecting social behaviour, educational outcomes, and day-to-day family interactions [6].
In adulthood, these impairments, if untreated, are associated with higher rates of criminal behaviour, loss of work, addiction, suicidality, and failed relationships [7]. Services for ADHD, especially in adulthood, are scarce and underfunded [8, 9], causing hundreds of thousands of children and adults to receive inadequate support or experience long delays in management [2]. This leads to poorer outcomes for the individual and their families, with undiagnosed (and therefore unsupported) ADHD resulting in a range of consequences in the short and long term. This includes significant academic underachievement and educational challenges, increased prevalence of depression and anxiety, higher rates of offending behaviour and imprisonment, driving accidents, substance abuse, and unemployment [10]. Diagnosis facilitates access to care or treatment [11, 12], and in turn, appropriate interventions have been shown to positively impact the difficulties experienced by individuals, often preventing further struggles [13, 14]. Hence, early diagnosis and intervention are of utmost importance in targeting some of the long-term risks for individuals living with ADHD. However, as highlighted in Lord Darzi’s recent independent investigation of the National Health Service (NHS) in England, the growth in demand for ADHD assessments has been so significant that it risks overwhelming services, with many English trusts unable to clear the backlog in adult ADHD assessments for decades, if continued at current rates [15].
In May 2024, NHS England announced the creation of an ADHD task force to tackle the many difficulties in access to care [16]. A report from the Demos think-tank estimates that the hidden costs of undiagnosed ADHD to the economy could amount to billions of pounds yearly and calls for urgent action to uncover the true economic costs [17]. While economic studies have assessed the costs of having ADHD [18, 19], research has not yet focused on the costs of not diagnosing and treating people with ADHD on an individual or societal level. Previous health economic research has shown the high cost of undiagnosed, and therefore untreated, mental health conditions in the general population, and has led to the creation of the NHS Improving Access to Psychological Therapies (IAPT) policy [20].
To establish the national cost of untreated ADHD in the UK, it is first important to assess the national treatment rates. It is estimated that millions of adults and children with ADHD are currently undiagnosed in the UK [2, 21, 22], and this issue prevails around the world. In Denmark, for example, over half of the children in a national birth cohort with probable ADHD based on parent-reported behaviour at age 7, were not diagnosed at follow-up many years later [23]. Sayal and colleagues [2] reviewed the administrative prevalence in the UK (i.e., the number of people with clinically diagnosed or recorded with ADHD as a proportion of the whole population) and found a wide range of prevalence from 0.19% to 0.76% in children and 0.29% in adults. A more recent cohort study [24] established that the prevalence of children receiving treatment in the UK by 2018 was 1.56% in boys and 0.36% in girls, but only 0.1% in adults. While diagnosis and treatment rates have increased over the years, they remain far below the reported community prevalence of approximately 5%.
To date, no study has established individual treatment rates across different regions in the UK. This study aimed to assess the variability in ADHD treatment rates across children and young people (CYP) and adult ADHD services in the UK, establishing a national average and regional differences.
A model was developed in Microsoft Excel, and it is the intellectual property of Takeda UK Ltd. The model estimates the number of patients with ADHD who are treated with prescription medicines licensed for ADHD and calculates pharmacological treatment rates as a percentage of the community prevalence (i.e., the number of people expected to have ADHD in a representative population sample). Estimates were calculated both nationally and by NHS service provider areas.
The primary outcome of this study was the pharmacological treatment rate, defined as the proportion of the estimated ADHD population receiving dispensed prescriptions for licensed ADHD medications. This represents an indirect estimate based on prescription data rather than on confirmed diagnoses and active treatments recorded in clinical records. As such, these estimates should not be interpreted as reflecting the true diagnosed prevalence.
Mid-year 2022 population data were used to calculate general population estimates for CYP (5–17 years) and adults (18–65 years) in the areas covered by English integrated care systems (ICSs [25]), Scottish [26] and Welsh [25] health boards, and Northern Irish health & social care trusts (HSCTs) [27] (Table S1).
Community prevalence rates of 5% for CYP and 3.5% for adults were selected in alignment with National Institute for Health and Care Excellence (NICE) guidance. While international studies have reported higher prevalence estimates, particularly in adult populations, the use of NICE-aligned estimates reflects a conservative approach appropriate for UK service planning and policy contexts (Table S2) [4].
Prescription data for medicines licensed for ADHD were then used to estimate the number of patients treated with medication and to derive pharmacological treatment rates by area, defined as the proportion of the expected ADHD population receiving dispensed prescriptions. All medicines currently licensed for ADHD were included (Table S3).
UK prescription data for the 12 months to May 2023 were obtained from the IQVIA Longitudinal Prescription Data (LRx) and Regional Prescription Analysis (RxA) databases. This represents a period post-coronavirus disease 2019 (COVID-19) pandemic, and pre-dating the 2023–2024 national supply issues affecting medications for the treatment of ADHD. For Northern Ireland, prescription data were not available stratified by age group. As a result, analyses for this region are limited to combined age estimates (5–65 years), and direct comparisons with CYP and adult-specific rates in other UK nations should be interpreted with caution. The RxA dataset includes prescriptions from multiple sources, including NHS, private, and hospital sales. While this provides near-complete market coverage (> 90%), it introduces potential geographic bias, as prescriptions may be attributed to the dispensing location rather than the patient’s area of residence. This is particularly relevant where prescriptions are concentrated in specific pharmacies or private providers serving wider catchment areas.
In such cases, treatment rates may be overestimated in areas with high prescribing or dispensing activity and underestimated in areas where patients reside but do not collect prescriptions locally. However, given the breadth of coverage and aggregation across large geographic units (ICSs, health boards, HSCTs), this effect is expected to be modest and unlikely to materially alter the overall patterns of variation observed.
LRx contains anonymous information about patients who collect prescriptions, including age, and is aggregated by area. This data covers approximately half of all prescriptions and was used to indicate the age of patients collecting ADHD prescriptions. The proportion of CYP and adults prescribed ADHD medications was obtained from LRx and applied to prescription data from the RxA dataset, which covers the whole UK market, including NHS Business Services Authority data, as well as private prescription and hospital sales data.
To calculate the number of treated patients in each area (Table S4), the percentages of CYP and adults (from LRx) were multiplied by the average monthly number of ADHD prescriptions (from RxA). It was assumed that one prescription per month represented one patient. This assumption reflects typical prescribing patterns for ADHD, where most individuals receive a single monthly prescription of a long-acting formulation. However, this approach may overestimate the number of treated individuals, as some patients receive multiple prescriptions per month (e.g., immediate-release ‘top-up’) medication or combination treatments (included medications are listed in Table S3). To assess the potential impact of this assumption, a sensitivity analysis was conducted using alternative scenarios in which the average number of prescriptions per patient per month was greater than one (e.g., 1.1–1.2 prescriptions per patient), reflecting estimates of polypharmacy affecting approximately 10–15% of patients. Under these scenarios, overall treatment rates were modestly reduced but did not materially alter the key findings of substantial geographic variation and low treatment coverage. Alternative approaches, such as defined daily dose (DDD) calculations, were considered; however, these were not feasible within the available dataset due to variability in dosing regimens and formulation types (e.g., immediate-release versus extended-release preparations). The chosen approach, therefore, reflects a pragmatic and transparent approximation, with sensitivity analyses used to assess robustness.
The estimated numbers of prevalent and treated patients were used to calculate the percentage of treated patients by area, and service providers were ranked by the proportion of CYP or adults who were prescribed treatment. Spearman’s rank correlation was used to investigate the relationship between CYP and adult treatment rates within ICSs, health boards, and HSCTs.
The estimated prevalent ADHD population and the number of patients treated with licensed ADHD medications in the UK are presented in Table 1.
Estimated ADHD population and number of patients treated with licensed ADHD medicines in the UK.
| Country | ADHD population, n | Treated, n (%) | ||||
|---|---|---|---|---|---|---|
| CYP(5–17 years) | Adults(18–65 years) | All ages(5–65 years) | CYP(5–17 years) | Adults(18–65 years) | All ages(5–65 years) | |
| England | 441,021 | 1,232,004 | 1,673,024 | 114,867 (26.0%) | 191,227 (15.5%) | 306,094 (18.3%) |
| Scotland | 37,927 | 119,394 | 157,321 | 13,476 (35.5%) | 18,633 (15.6%) | 32,110 (20.4%) |
| Wales | 23,344 | 65,710 | 89,054 | 5,244 (22.5%) | 10,722 (16.3%) | 15,966 (17.9%) |
| Northern Ireland | 16,239 | 40,574 | 56,812 | N/A* | N/A* | 9,155 (16.1%) |
| Great Britain | 502,291 | 1,417,108 | 1,919,399 | 133,587 (26.6%) | 220,582 (15.6%) | 354,170 (18.5%) |
| UK | 518,530 | 1,457,682 | 1,976,211 | N/A† | N/A† | 363,325 (18.4%) |
ADHD: attention deficit hyperactivity disorder; CYP: children and young people; UK: United Kingdom. *: Data not available by age group; †: number of treated patients by age group could not be calculated for the UK as a whole due to the lack of data by age group for Northern Ireland.
ADHD pharmacological treatment rates in England were 26.0% for CYP, 15.5% for adults and 18.3% for all ages combined (Figure 1). Treatment rates in Scotland were higher than in England for CYP (35.5%) and similar to England for adults (15.6%), with an overall treatment rate of 20.4%. In Wales, treatment rates were similar to those in England (22.5% for CYP, 16.3% for adults, and 17.9% for all ages combined). Data for Northern Ireland were not available by age group; therefore, only overall treatment rates (ages 5–65 years) are presented. This limits direct comparability with age-stratified analyses for England, Scotland, and Wales. The estimated pharmacological treatment rate for patients of all ages (18–65 years) in Northern Ireland was 16.1%. In Great Britain (England, Scotland and Wales), the estimated proportions of the CYP (5–17 years) and adult populations treated were 26.6% and 15.6%, respectively. Across the UK as a whole, the treatment rate for patients of all ages was 18.4%.
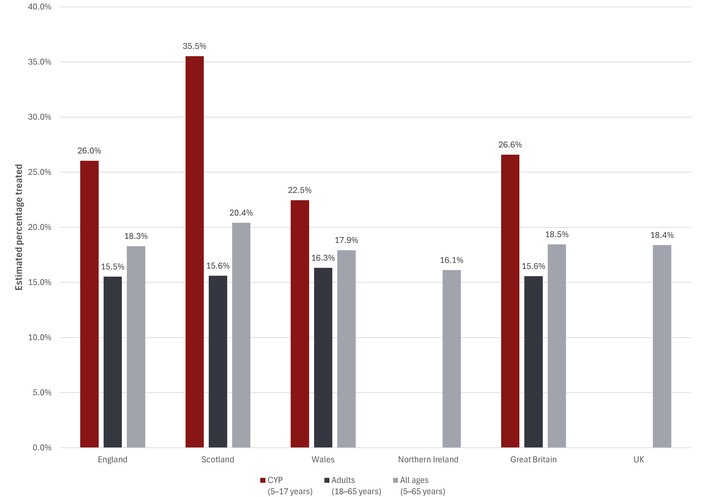
Estimated percentage of patients treated with licensed ADHD medicines in the UK. ADHD: attention deficit hyperactivity disorder; CYP: children and young people; UK: United Kingdom. Pharmacological treatment rates by area.
To aid interpretation of both relative and absolute differences in treatment, Table 2 summarises the lowest and highest ranked service areas for each country and age group, including both percentage treatment rates and estimated numbers of treated individuals.
Lowest and highest ranked service areas by pharmacological treatment rate.
| Country | Age group | Lowest area (%, n treated) | Highest area (%, n treated) |
|---|---|---|---|
| England | CYP | NHS North East London (11.7%, n ≈ 1,945) | NHS Derby and Derbyshire (48.7%, n ≈ 3,861) |
| England | Adults | NHS Humber and North Yorkshire (9.3%, n ≈ 3,318) | NHS Cheshire and Merseyside (24.8%, n ≈ 13,518) |
| Scotland | CYP | NHS Western Isles (14.3%, n ≈ 32) | NHS Tayside (60.6%, n ≈ 1,722) |
| Scotland | Adults | NHS Western Isles (8.6%, n ≈ 45) | NHS Fife (22.3%, n ≈ 1,764) |
| Wales | CYP | Aneurin Bevan UHB (12.8%, n ≈ 582) | Cwm Taf Morgannwg UHB (30.8%, n ≈ 1,051) |
| Wales | Adults | Aneurin Bevan UHB (9.8%, n ≈ 1,223) | Swansea Bay UHB (19.7%, n ≈ 1,617) |
The distribution of pharmacological treatment rates across English, Scottish, and Welsh service providers is shown in Figure 2. The median proportion of patients treated was 26.2% (mean 28.7%) for CYP services, and 15.4% (mean 15.3%) for adult services.
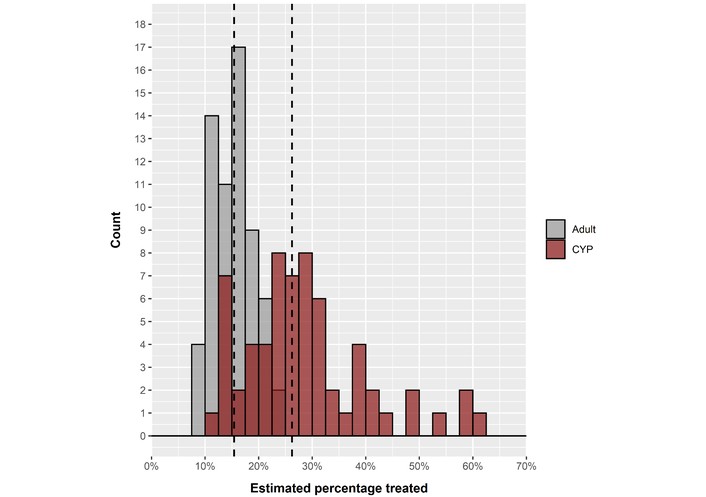
Distribution of ADHD pharmacological treatment rates (Great Britain*). ADHD: attention deficit hyperactivity disorder; CYP: children and young people. * Northern Ireland is excluded as data were not available by age group. Dashed lines indicate medians.
In England, pharmacological treatment rates ranged from 11.7% in the lowest-ranked ICS to 48.7% in the highest-ranked ICS for the CYP population (Figure 3 and Table S4), and 9.3% to 24.8%, respectively, in the adult population (Figure 4 and Table S4). This represents a 4.2-fold variation in treatment rates for CYP and a 2.7-fold variation in adults.
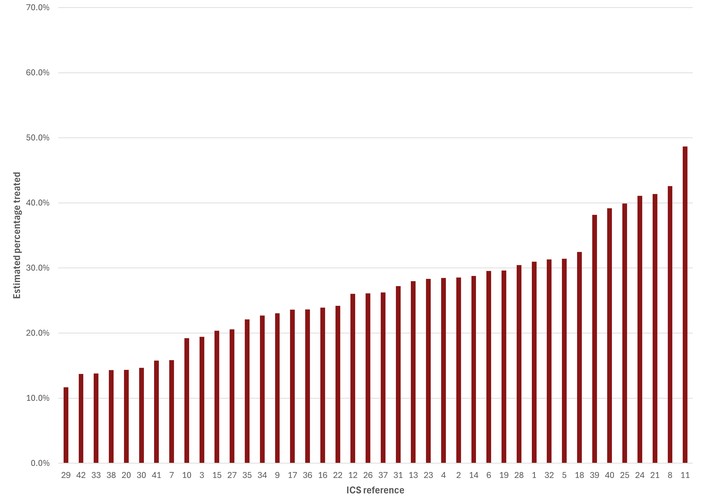
Estimated percentage of CYP (aged 5 to 17 years) treated with licensed ADHD medicines in England, ranked from lowest to highest by ICS. ADHD: attention deficit hyperactivity disorder; CYP: children and young people; ICS: integrated care system. See Table S4 for ICS reference numbers.
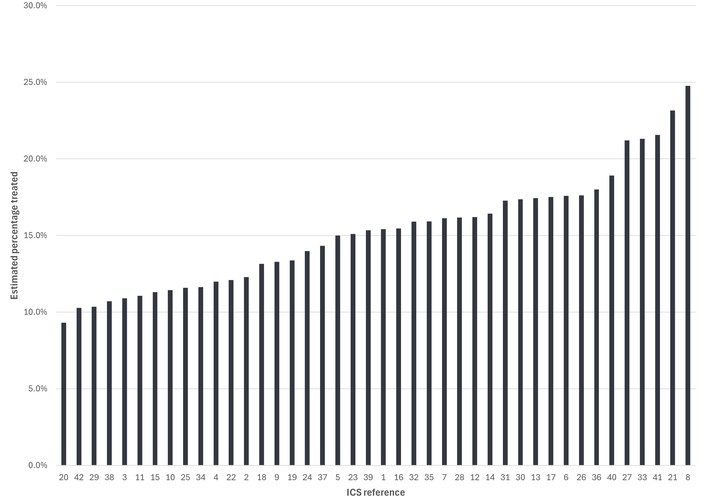
Estimated percentage of adults treated with licensed ADHD medicines in England, ranked from lowest to highest by ICS. ADHD: attention deficit hyperactivity disorder; ICS: integrated care system. See Table S4 for ICS reference numbers.
In Scotland, pharmacological treatment rates were 14.3–60.6% for the CYP population (Figure 5 and Table S4), and 8.6–22.3%, respectively, in the adult population (Figure 6 and Table S4). This represents a similar variation to that observed in England (4.2-fold variation in CYP and 2.6-fold variation in adults).
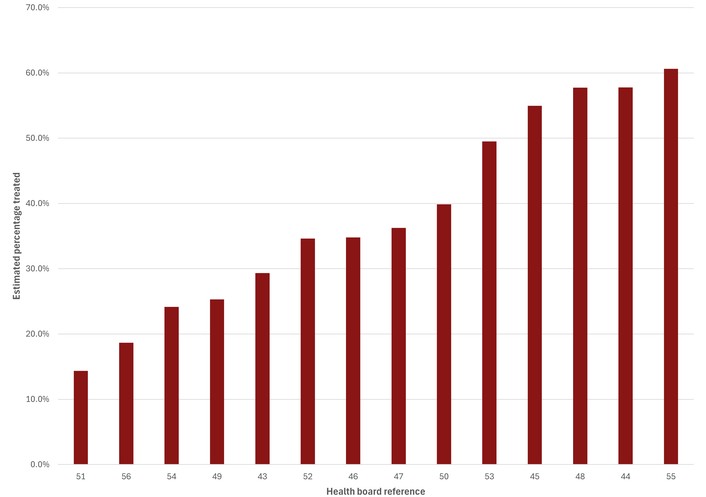
Estimated percentage of CYP (aged 5–17 years) treated with licensed ADHD medicines in Scotland, ranked from lowest to highest by health board. ADHD: attention deficit hyperactivity disorder; CYP: children and young people. See Table S4 for health board reference numbers.
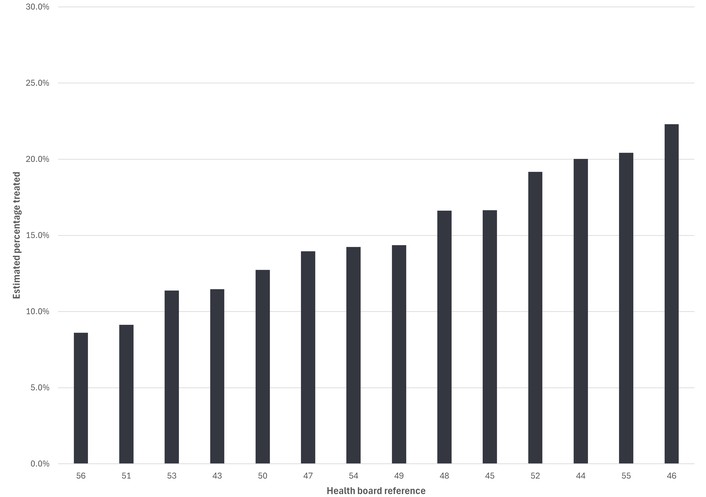
Estimated percentage of adults treated with licenced ADHD medicines in Scotland, ranked from lowest to highest by health board. ADHD: attention deficit hyperactivity disorder. See Table S4 for health board reference numbers.
Compared with both England and Scotland, maximum pharmacological treatment rates in Wales were lower [30.8% of CYP (Figure 7 and Table S4); 19.7% of adults (Figure 8 and Table S4)], while the minimum treatment rates were similar to those in England and Scotland (12.8% of CYP; 9.8% of adults); as such, there was less variation than in either England or Scotland (2.4-fold variation for CYP, and 2.0-fold variation for adults).
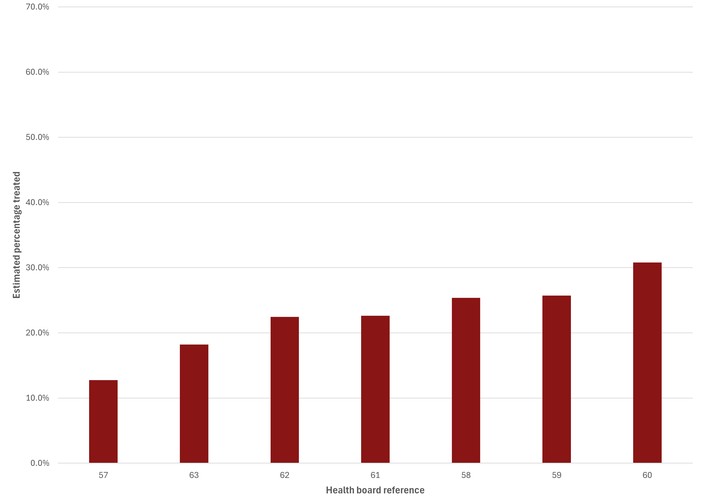
Estimated percentage of CYP (aged 5–17 years) treated with licenced ADHD medicines in Wales, ranked from lowest to highest by health board. ADHD: attention deficit hyperactivity disorder; CYP: children and young people. See Table S4 for health board reference numbers.
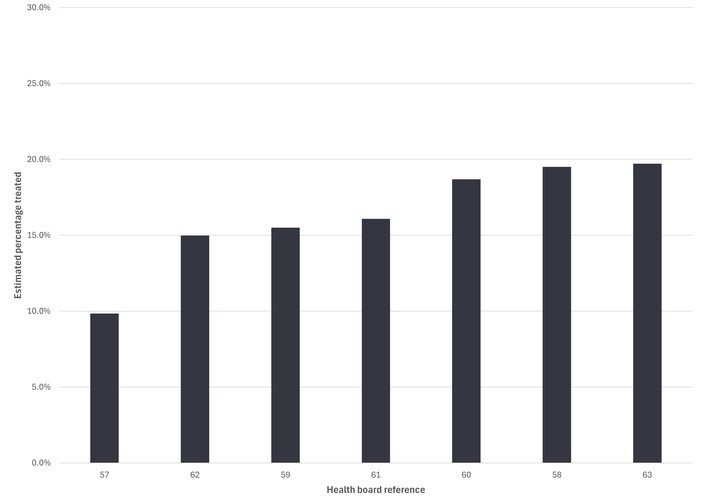
Estimated percentage of adults treated with licenced ADHD medicines in Wales, ranked from lowest to highest by health board. ADHD: attention deficit hyperactivity disorder. See Table S4 for health board reference numbers.
Data for Northern Ireland were not available by age group. Overall pharmacological treatment rates (ages 5–65 years) ranged from 6.7% in the lowest-ranking health board to 31.1% in the highest-ranking board (Figure 9 and Table S4), representing a 4.6-fold difference in treatment rates.
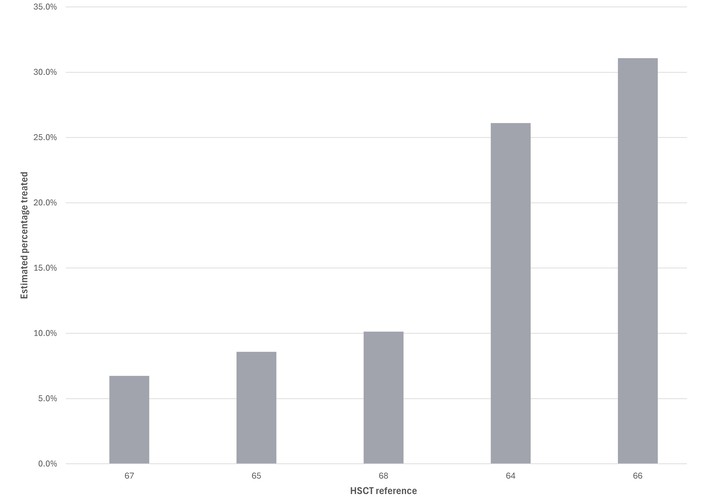
Estimated percentage of patients (aged 5–65 years) treated with licensed ADHD medicines in Northern Ireland, ranked from lowest to highest by HSCT. ADHD: attention deficit hyperactivity disorder; HSCT: health & social care trust. See Table S4 for HSCT reference numbers.
The relationship between pharmacological treatment rates in CYP and adults by service provider in England, Scotland & Wales is shown in Figure 10. For both England and Wales, there was no statistically significant correlation between treatment rates in CYP services and adult services (England: R = 0.21, p = 0.18; Wales: R = 0.28, p = 0.56). However, in Scotland, a positive correlation was observed between CYP and adult treatment rates (R = 0.58, p = 0.03).
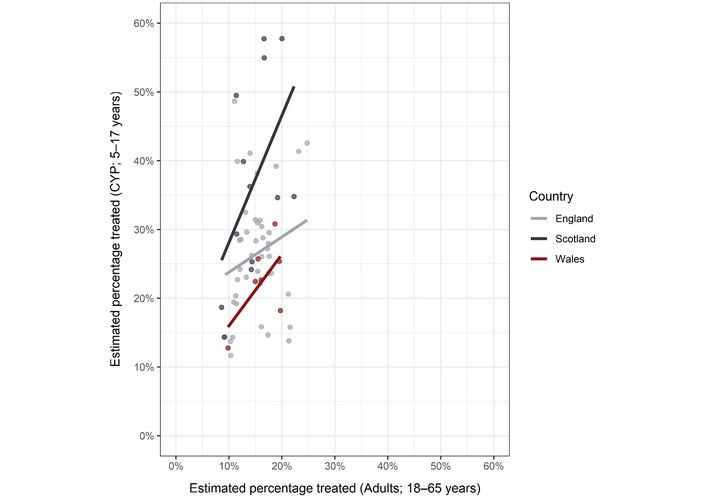
Estimated percentage of CYP and adults treated with licensed ADHD medicines in Great Britain*, by ICS or health board. ADHD: attention deficit hyperactivity disorder; CYP: children and young people; ICS: integrated care system. * Northern Ireland is excluded as data were not available by age group.
This study highlights the differences in rates of pharmacological treatment for ADHD in children and adults across the UK, reporting a high degree of geographic variation across all NHS systems and a low level of treatment of ADHD, especially in adults. The model used UK population data and prevalence estimates to estimate the number of patients with ADHD in each UK region. Prescription data for medicines licensed for the treatment of ADHD were then used to calculate the number and percentage of patients treated per area. Regionally, treatment rates ranged from 0.8 to 4.6 times higher among NHS providers. Nationally, the estimated proportions of the CYP and adult populations treated were 26.6% and 15.6%, respectively (excluding Northern Ireland). National treatment rates in England were 26.0% for CYP and 15.5% for adults, ranging from 11.7% in the lowest-ranked ICS to 48.7% in the highest-ranked ICS for CYP, and from 9.3% to 24.8% for adults. In Scotland, both the national treatment rate and the highest health board treatment rate for CYP were higher than in England (35.5% compared with 26.0%, and 60.6% compared with 48.7%, respectively), while the adult treatment rates were similar to those in England (15.6% nationally and up to 22.3% among health boards). In Wales, national treatment rates were 22.5% (CYP) and 16.3% (adults). Compared with England and Scotland, maximum treatment rates among Welsh health boards were lower (30.8% of CYP; 19.7% of adults), and the minimum rates were similar to those in England (12.8% of CYP; 9.8% of adults). Although data for Northern Ireland were not available by age group, treatment rates for all ages (5–65 years) ranged from 6.7% in the lowest-ranking HSCT to 31.1% in the highest-ranking HSCT.
It has been well established that ADHD treatment is highly beneficial for service-users and can prevent negative outcomes [12, 28]. Our findings show concerningly low treatment rates in a number of areas across the UK; however, it is difficult to identify the reasons, as many factors could be at play. First, low rates of pharmacological treatment could reflect low rates of diagnosis and low recognition of ADHD in healthcare practices, especially in primary care. Healthcare professionals in the UK seldom receive training on ADHD [8, 9], which often leads to a lack of recognition and understanding [29]. Additionally, a lack of a trained and skilled workforce of healthcare professionals, able to meet the increasing demands on services, is also problematic. Secondly, a lack of funding and service provision around ADHD, especially in adult services, has also led to increasing waiting lists with some areas reporting 5 years or more delays before being assessed for ADHD [30–32]. This issue has been exacerbated by the COVID-19 pandemic and is only getting worse [31]. Routes into services for those in higher-risk groups may mean those with the highest needs are missed altogether, including children excluded from school, care-experienced children and adults, and those in the criminal justice system. This has economic importance, as it is these latter groups that cost society and the individuals and their families greatly.
This study demonstrates substantial geographic variation in pharmacological treatment rates; however, the current descriptive design does not allow causal inference regarding the drivers of this variation. Several plausible explanations may contribute to this, including differences in service configuration, workforce capacity, socioeconomic factors, referral pathways, and the quality of transitions between CYP and adult services. These factors remain hypotheses and require further investigation using linked service, demographic, and system-level data. While the findings highlight a national issue of low pharmacological treatment rates, they also raise important questions about regional differences: what are higher-performing areas doing differently, and can these approaches be replicated? For example, lower treatment rates may reflect alternative forms of support outside healthcare settings, such as school-based provision, differences in local deprivation, or variations in transition pathways. Although exploring these mechanisms is beyond the scope of this study, emerging case study work by the same team suggests that examining such variation may help identify effective triage approaches and inform the development of scalable clinical models with lasting system impact.
The pharmacological treatment rates presented in this study are derived from dispensed prescription data and therefore serve as an indirect proxy for access to medication rather than a direct measure of diagnosis or clinical management. As such, they should not be interpreted as equivalent to regional diagnostic prevalence, as they capture only individuals receiving medication rather than the full population diagnosed with ADHD. This distinction is important because the ADHD population comprises three overlapping groups: (1) individuals who remain undiagnosed, (2) individuals who are diagnosed but receive non-pharmacological interventions, and (3) individuals who are diagnosed but do not receive medication due to contraindications, patient choice, or clinical decision-making. Previous evidence suggests that approximately one-third of diagnosed individuals may not receive stimulant treatment [33], reinforcing that pharmacological treatment rates represent only a subset of the diagnosed population and should be interpreted as a proxy indicator of access to care rather than a direct measure of diagnostic coverage. While more granular approaches, such as DDD calculations, may provide additional precision, they require detailed dosing information that is not consistently available in large-scale prescription datasets such as IQVIA RxA. In addition, the prescription data used in this analysis covers the period up to May 2023 and therefore predates the national ADHD medication supply disruption beginning in September 2023; as such, the findings reflect a pre-disruption baseline and may not fully generalise to current prescribing patterns, which have been affected by supply constraints.
This study has many strengths and limitations. To our knowledge, this is the first model to estimate and directly compare pharmacological treatment rates for ADHD across UK NHS service provider geographies (ICSs, health boards, and HSCTs), using linked population prevalence estimates and national prescription datasets. This enables, for the first time, a consistent assessment of geographic variation in ADHD treatment across the UK. A recent Spanish retrospective cohort analysis using regional prescription data [34] demonstrated a similar 3.3-fold difference in medication use between the lowest and highest regions; however, this analysis was limited to methylphenidate treatment only, and, as the study measured pharmacy sales in the number of packages, some of this variation could be accounted for by differences in dosage.
This study captures ADHD care at a very specific but pivotal time point in the UK. It was conducted following the COVID-19 pandemic, which has significantly impacted service demand, underscoring a pressing need at a time when demand is higher than ever. While it is not possible to infer direct diagnosis rates from this data, these numbers can indicate relative issues throughout the care pathway, from recognition and diagnosis to treatment. This is both a strength and a limitation of this report. While we can infer a lack of diagnosis from this data and its implications throughout the care pathway, these figures do not tell us how many people are diagnosed and do not account for service users who receive non-pharmacological treatments. Approximately one-third of the diagnosed population may be expected to have no history of stimulant treatment [33]. However, the model did not account for this, as the same pharmacological treatment rate would apply across all areas and would therefore have no effect on the observed variation.
The model may overestimate the number of treated individuals by assuming that each prescription corresponds to a single patient per month. This is likely to occur in cases of polypharmacy or where immediate-release medications are prescribed in addition to extended-release formulations. The inclusion of private prescriptions and hospital sales data may introduce geographic misclassification, as prescriptions are assigned to dispensing locations rather than to patients’ residences. This could lead to localised overestimation in areas with large prescribing centres and underestimation elsewhere. However, given the scale and aggregation of the data, this is unlikely to significantly affect national patterns or the magnitude of regional variation. However, sensitivity analyses suggest that even under conservative assumptions, adjusting for this effect, treatment rates remain low across all regions. Importantly, this potential overestimation should be considered in the context of ongoing public and policy debate in the UK, suggesting that ADHD may be overtreated. Our findings indicate the opposite pattern: even when adopting assumptions that may inflate treatment estimates, pharmacological treatment rates remain substantially below expected prevalence levels.
Another limitation of this study is the timeframe, which coincides with a national medication supply crisis [35]. While more up-to-date treatment rates could be calculated, the model uses prescription data that predate autumn 2023 [36]. From this time, the UK experienced a national ADHD medication shortage, and any data reported after this time would have been impacted and would therefore not be a true representation of pharmacological treatment rates. The absence of age-stratified data for Northern Ireland also restricts comparability with other UK nations and prevents assessment of differences between CYP and adult services in this region.
This report was not able to determine the effect of the NHS ‘Right to Choose’ [37]. Following the increase in waiting times, many families and adults have received care privately through the NHS ‘Right to Choose Act’, which allows service-users to seek alternative provisions if services provided by the NHS are not adequate [38]. This led to a significant increase in private providers diagnosing and treating ADHD, but no studies to date have been able to untangle the specific effects (positive and negative) this had on service-provision. We do not yet know what the quality of aftercare or ongoing treatment rates are for this group compared to those receiving care in their local NHS services. We also do not know whether those taking alternative routes are from a specific sector of society with higher levels of knowledge and skills to navigate clinical systems. Additionally, the effect of private healthcare on treatment patterns is unknown; private providers may issue all prescriptions through a single pharmacy, which could distort treatment rates in the ICS/health board/HSCT areas where these pharmacies are located.
The data presented in this publication can be very useful for future research and practice. Future studies could examine in more detail the regional differences and why some regions are ‘better’ than others. Additionally, understanding the implications of higher treatment rates for social factors (education, employment, crime) would further highlight the potential benefits of treatment. The model could also be used to further understand the impact of the national medication shortage. Finally, this model could identify potential patterns in treatment over the last few years, further highlighting trends in ADHD care nationally and regionally and informing commissioners’ decision-making.
This study, the first of its kind, demonstrates substantial geographic variation in pharmacological treatment for children, young people, and adults with ADHD across the UK. Rather than attributing performance as ‘good’ or ‘poor’, these findings highlight a critical question: why do such disparities persist when diagnosis is based on standardised national guidelines? Differences in service accessibility are likely to play a role, particularly given the additional barriers faced by individuals with co-occurring conditions such as dyslexia, developmental language disorder, and autism. In the context of rising demand and prolonged waiting times, addressing these disparities is increasingly urgent.
Equally important is how access to care is prioritised. Systems that favour those most able to advocate for themselves risk excluding individuals with the greatest need, particularly as waiting lists expand. While not directly examined in this study, existing evidence indicates higher ADHD prevalence in groups already facing significant long-term disadvantage, reinforcing the need for more equitable models of access.
These findings have clear implications for practice and policy. There is a need for more consistent commissioning and pathway design across regions, alongside improved recognition, referral, and continuity of care—particularly in adult services. Expanding the role of general practitioners in more straightforward ADHD assessment and management, supported by appropriate training, may help reserve specialist capacity for more complex cases. At a system level, the results point to the need for national guidance on demand management and on strengthening both pre- and post-diagnostic support.
Overall, the findings suggest that current service models are not meeting population needs. Addressing this gap will require system-level redesign, rather than incremental increases in capacity alone. In contrast to prevailing narratives suggesting overdiagnosis or overtreatment, the evidence presented here indicates substantial unmet need and limited access to pharmacological treatment relative to expected prevalence.
ADHD: attention deficit hyperactivity disorder
COVID-19: coronavirus disease 2019
CYP: children and young people
DDD: defined daily dose
HSCTs: health & social care trusts
IAPT: Improving Access to Psychological Therapies
ICSs: integrated care systems
LRx: Longitudinal Prescription Data
NHS: National Health Service
NICE: National Institute for Health and Care Excellence
RxA: Regional Prescription Analysis
UK: United Kingdom
The supplementary tables for this article are available at: https://www.explorationpub.com/uploads/Article/file/1004163_sup_1.pdf.
The authors would like to thank Peter Cain (Takeda UK) for statistical support and analysis.
BF, JD, CW and AK: Conceptualization, Methodology, Supervision, Visualization, Writing—review & editing. JD and CW: Data curation, Formal analysis, Investigation, Project administration, Resources, Software, Validation. BF and AK: Writing—original draft, Funding acquisition. All authors reviewed the results and approved the final version of the manuscript.
BF reports personal fees and nonfinancial support from Takeda and Medice. JD and CW are employees of Takeda UK Ltd, and JD owns stock in Takeda Pharm Sp ADS. AK is currently Chair of the ADHD Foundation.
In accordance with the regulations of the University of Nottingham, ethical approval was not required.
In accordance with the regulations of the University of Nottingham, consent to participate was not required.
Not applicable.
There are 2 primary data sources used for the calculations within this model, which are in the references.
The model was developed and funded by Takeda UK Ltd.
© The Author(s) 2026.
Open Exploration maintains a neutral stance on jurisdictional claims in published institutional affiliations and maps. All opinions expressed in this article are the personal views of the author(s) and do not represent the stance of the editorial team or the publisher.
Copyright: © The Author(s) 2026. This is an Open Access article licensed under a Creative Commons Attribution 4.0 International License (https://creativecommons.org/licenses/by/4.0/), which permits unrestricted use, sharing, adaptation, distribution and reproduction in any medium or format, for any purpose, even commercially, as long as you give appropriate credit to the original author(s) and the source, provide a link to the Creative Commons license, and indicate if changes were made.



View: 1651
Download: 31
Times Cited: 0
Montserrat Gerez-Malo ... Carlos Acosta
Yvette Hus, Osnat Segal
Rosa Angela Fabio ... Pina Filippello
Daniela Smirni ... Michele Roccella
Tawfiq Froukh, Eman Albsoul


