Original Article

Affiliation:
1Department of Pharmaceutical Sciences and Technology (DPST), Institute of Chemical Technology, Mumbai 400019, Maharashtra, India
ORCID: https://orcid.org/0000-0001-8623-1229
Affiliation:
1Department of Pharmaceutical Sciences and Technology (DPST), Institute of Chemical Technology, Mumbai 400019, Maharashtra, India
ORCID: https://orcid.org/0000-0003-2395-8492
Affiliation:
1Department of Pharmaceutical Sciences and Technology (DPST), Institute of Chemical Technology, Mumbai 400019, Maharashtra, India
ORCID: https://orcid.org/0000-0001-7234-0483
Affiliation:
1Department of Pharmaceutical Sciences and Technology (DPST), Institute of Chemical Technology, Mumbai 400019, Maharashtra, India
ORCID: https://orcid.org/0000-0001-5778-4465
Affiliation:
2National Centre for Preclinical Reproductive and Genetic Toxicology, National Institute for Research in Reproductive and Child Health, ICMR - National Institute for Research in Reproductive and Child Health, Mumbai 400012, Maharashtra, India
Email: dighev2004@gmail.com
ORCID: https://orcid.org/0000-0001-9718-7358
Affiliation:
1Department of Pharmaceutical Sciences and Technology (DPST), Institute of Chemical Technology, Mumbai 400019, Maharashtra, India
Email: sadhanasathaye@hotmail.com
ORCID: https://orcid.org/0000-0002-8568-0994
Explor Neuroprot Ther. 2025;5:1004128 DOI: https://doi.org/10.37349/ent.2025.1004128
Received: July 24, 2025 Accepted: November 05, 2025 Published: December 11, 2025
Academic Editor: Marcello Iriti, Università degli Studi di Milano, Italy
The article belongs to the special issue Natural Products in Neurotherapeutic Applications
Aim: Alzheimer’s disease (AD) devastates learning and memory, the defining faculties of the human species. Extracellular amyloid beta (Aβ) deposits and intracellular hyperphosphorylated tau are hallmarks of AD pathology. The exact cause of the disease remains unknown, but a lot of data support AD to be a multifactorial disease. Given the central roles of oxidative stress and neuroinflammation in AD pathogenesis, apocynin, a potent antioxidant and anti-inflammatory agent, was selected for investigation. Apocynin is an aromatic ketone, a naturally occurring methoxy-substituted catechol known to possess numerous biological activities, namely anti-oxidant, anti-inflammatory, etc. The present study assessed apocynin’s potential against an Aβ1–42-induced sporadic AD rat model.
Methods: In the present study, Wistar rats were subjected to intrahippocampal administration of 200 µmol/L of Aβ1–42 peptide in right hemisphere. Further were treated with apocynin 50, 150, and 300 mg/kg per orally for 28 days. The study examined the neurobehavioral aspects using the Barnes Maze test (BMT). Hippocampus was examined for the antioxidant (SOD, GSH, catalase, and LPO), inflammatory (TNF-α) parameters, RAGE, caspase-3, PGC-1α expression, and IHC analysis for Aβ load, adult hippocampal neurogenesis markers (BDNF, Ki67, DCX, NeuN), at the end of 28 days.
Results: Apocynin administration demonstrated significant improvement in cognitive functions, diminished oxidative stress and inflammatory response triggered by Aβ administration. Apocynin additionally instigated adult hippocampal neurogenesis and triggered mitochondrial biogenesis.
Conclusions: These primary results strongly advocate apocynin’s nootropic, neurotrophic and neuroprotective potential in an Aβ induced neurotoxicity in rats.
Memory is essential to all our lives and can be defined as our capacity to encrypt, store, remember, and subsequently recall information and past experiences in the human brain [1, 2]. Alzheimer’s is a brain disease that leads to a gradual decline in memory, thinking, and intellectual skills. It slowly robs individuals of their most human qualities—memory, insight, decision-making, pensiveness, and language [3].
The classical hallmarks of the disease are its extracellular amyloid deposits and intracellular hyperphosphorylated tau protein [4]. The pathological features exhibit elevated oxidative stress, mitochondrial dysfunction, impaired mitochondrial biogenesis, the deficit in mitochondrial bioenergetics, abnormal mitochondrial dynamics, altered oxidative phosphorylation (OXPHOS) system, perturbed calcium homeostasis, hampered adult neurogenesis, and neuroinflammation. These neuropathological features culminate into a shift towards the amyloidogenic processing of the amyloid precursor protein (APP), thus increasing amyloid load in the brain.
Apocynin, a well-known NADPH oxidase inhibitor [5], is an aromatic ketone isolated from the roots of Apocynum androsaemifolium, Apocynum cannabinum (Canadian hemp), Picrorhiza kurroa (Scrophulariaceae), and Jatropha multifia (Euphorbiaceae). It is used traditionally in Ayurvedic medicine in India and Sri Lanka. Several studies indicate the neuroprotective potential of apocynin against neuronal injury in the hippocampus, improvement in spatial cognitive functions, and protection against oxidative stress–induced tissue damage [6, 7]. Because NADPH oxidase (NOX)-mediated reactive oxygen species (ROS) production is a central driver of oxidative stress and neuroinflammation in Alzheimer’s disease (AD), and because these processes, in turn, profoundly affect mitochondrial function, Aβ generation, and neurogenesis. We hypothesized that apocynin, a known NOX inhibitor with antioxidant and anti-inflammatory properties, could confer neuroprotection by targeting multiple key nodes within the AD pathological network [5–7].
Apocynin, Aβ1–42 protein fragment (95%) was procured from Sigma Aldrich, and Donepezil 5 mg tablet (Pfizer-Aricept®) was obtained from a local pharmacy. TNF-α (tumour necrosis factor-α) was estimated using Elisa kit procured from Thermo Fisher Scientific (eBioscience), USA. The primary antibodies for immunohistochemistry were anti-Aβ1–42 (ab201060, Abcam, rabbit monoclonal), anti-BDNF (ab108319, Abcam, rabbit monoclonal), anti-doublecortin (DCX) (ab222921, Abcam, rabbit monoclonal), anti-Ki-67 (ab16667, Abcam, rabbit monoclonal), and anti-Neuronal Nuclei (NeuN) (ab209898, Abcam, rabbit monoclonal). The secondary antibodies used were Alexa fluor® 680 (A21109, Thermo Fisher Scientific, goat anti-rabbit) and Alexa fluor® 488 (A11001, Thermo Fisher Scientific, goat anti-mouse) purchased from Molecular Probes by Life Technologies, USA. Prolong gold antifade reagent from Invitrogen by Thermo Fisher Scientific. The primer sets for Caspase-3, PGC-1α, and RAGE (AGER: Advanced Glycation End Product Receptor) were procured from Bioinnovations, India. SYBR green master mix (2× Brilliant III SYBR Green QPCR Master Mix) was purchased from Agilent Technologies, USA. All other chemicals used were of analytical grade.
The male Wistar rats (200–250 g) were about five to six weeks old at the time of arrival. The animals were procured from the National Institute of Biosciences (NIBS), Pune, India, for the present study. The animals were housed and maintained on a 12 h light and dark cycle in polypropylene cages with sterile corncob at 25° ± 2°C temperature, and 50–70% relative humidity. They were provided with ad libitum access to food and water. The rats were allowed to acclimatize for at least one week prior to the stereotaxic surgery. The entire animal study was carried out according to a protocol approved by the Committee for Control and Supervision on Experiments on Animals (CCSEA) [formerly known as Committee for the Purpose of Control and Supervision on Experiments on Animals (CPCSEA)], India-registered Institutional Animal Ethics Committee (IAEC). The approved protocol number is ICT/IAEC/2017/P26.
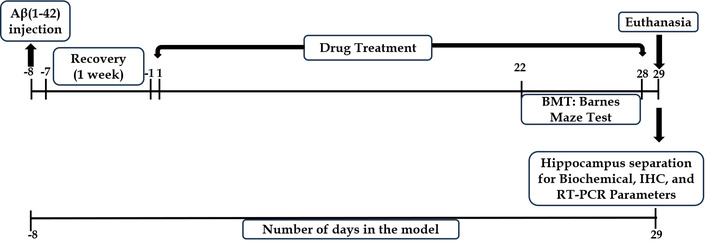
The rats were randomly divided into six groups, with twelve animals in each group. For each experimental group, animals were randomly allocated into cohorts dedicated to specific endpoints, namely six animals for biochemical analyses, four for immunohistochemistry, and two for molecular (qPCR) studies. All the animals received Aβ1–42 intrahippocampally, except the sham control, which received normal saline. Rats in the rest of the groups received the treatment post 1 week recovery period, as shown in Figure 1. The groups are elaborated in Table 1.
Animal groups and treatments for Aβ1–42 induced AD model.
| Group | Treatment | No. of Animals |
|---|---|---|
| 1. | SC: sham control group received → saline solution only | 12 |
| 2. | Aβ1–42: negative control (NC) group received → Aβ1–42 (2 µL, 200 µmol/L) intrahippocampally | 12 |
| 3. | AL: apocynin low dose received → Aβ1–42 (2 µL, 200 µmol/L) intrahippocampally + apocynin low (50 mg/kg) p.o. | 12 |
| 4. | AM: apocynin medium dose received → Aβ1–42 (2 µL, 200 µmol/L) intrahippocampally + apocynin medium (150 mg/kg) p.o. | 12 |
| 5. | AH: apocynin high dose received → Aβ1–42 (2 µL, 200 µmol/L) intrahippocampally + apocynin high (300 mg/kg) p.o. | 12 |
| 6. | STD: standard treatment received → Aβ1–42 (2 µL, 200 µmol/L) intrahippocampally + standard donepezil (DON) 5 mg/kg p.o. | 12 |
The present study followed the experimental scheme illustrated in Figure 1 to investigate the effect of Apocynin in Aβ1–42-induced AD.
Aβ1–42 peptide fragment was dissolved in 0.9% saline solution to make the concentration of 200 μmol/L. The solubilised peptide was then incubated for 7 days at 37°C. The final solution obtained was clear; incubation induces aggregation of the Aβ peptide, but the aggregates are soluble in nature. The volume for injection was decided to be 2 μL [8].
Initially, the rats were anesthetized using 4% isoflurane and 0.5 L/min O2, maintaining anesthesia at 1.5–2.5% isoflurane and 0.5 L/min O2 during injections [9]. Positioned on a surgery board, the rat’s head was straightened, the scalp trimmed, and a midline sagittal incision exposed the skull. Scraping the fascia revealed the bregma, the stereotaxy reference. A 0.8 mm burr hole was drilled at coordinates –3.0 mm AP, +1.5 mm ML, and –4.0 mm DV from bregma for the hippocampus injection [10]. Using a cannula attached to a Hamilton syringe, 2 μL of 200 μmol Aβ1–42 was injected unilaterally into the CA1 region. Sham control rats received saline through stereotaxy. Post-operatively, rats received gentamicin (5 mg/kg; s.c.) for 7 days, tramadol (5 mg/kg; i.m.) for 2 days, betadine ointment on sutures, and neosporin powder for sepsis prevention. Rats recovered individually in cages for a week.
Appropriate treatment was initiated post-recovery period of one week, as illustrated in Figure 1. Each animal in the six groups received the respective treatment for 28 days. Apocynin was administered orally by suspending it in double distilled water with the help of 1% Tween 80. The doses of apocynin were based on the study by Trumbull et al. [11] in a mouse model of amyotrophic lateral sclerosis (ALS). The standard group of animals received donepezil. Neurobehavioral function was assessed using the Barnes Maze test on days 22–28 post-treatment initiation. Animals were euthanized on the 29th day of the study with CO2 asphyxiation.
The Barnes Maze, devised by Carol Barnes for spatial memory research in rats, utilized a 122 cm wooden platform with 18 equally spaced 10 cm diameter holes around the perimeter. One hole led to an escape box underneath [12–14]. Elevated on a 140 cm stand, the platform was under bright lighting with visual cues like shapes placed nearby.
The test occurred from day 21 to day 28. Rats underwent acclimatization in a start box before exploring the maze. Sessions lasted until the rat found the escape box, or post 3 min, after which they stayed in the box for 2 min. The initial day was for acclimatization. If rats couldn’t find the escape hole, they were directed, with consistent cues aiding their learning.
Following acclimatization, a 5-day acquisition phase included twice-daily trials to teach the rats using spatial cues, assessing their spatial reference memory learning. The final day’s probe trial gauged memory retention sans the escape box. “Escape latency time,” the duration taken to find and enter the box, was the measured parameter. The methodology remained within the framework of Barnes’ original design for spatial memory exploration in rats [12–14].
The animals were euthanized at the end of the animal model, with CO2 asphyxiation. The rats selected for immunohistochemistry analysis were perfused with 4% paraformaldehyde, and the brains were isolated and stored in 4% paraformaldehyde solution until further analysis. The rats selected for biochemical markers estimation and the mRNA expression were perfused with normal isotonic saline solution (37°C) [15]. The hippocampus was isolated from the rest of the brain and was rinsed in ice-cold isotonic saline for biochemical estimations. The hippocampus, post-extraction, was snap-frozen in liquid nitrogen and stored at –80°C. Homogenization of the tissues was performed using ice-cold 0.1 M phosphate-buffered saline (PBS, pH 7.4) to yield a 10% w/v homogenate. The homogenate obtained was subsequently centrifuged (10,000 rpm, 15 min, 4°C). The resulting supernatant was aliquoted for the estimation of biochemical parameters.
The superoxide dismutase (SOD) activity was determined using the pyrogallol auto-oxidation method, as reported earlier by Nandi and Chatterjee (1988) [16]. The reaction entailed 180 μL of 0.1 M potassium phosphate buffer (pH 7.4), 10 μL each of tissue homogenate, and 2.6 mM pyrogallol solution in 10 mM HCl. The absorbance at 325 nm was measured every 30 seconds over a 5-minute period. Enzyme activity was expressed in units, where one unit of SOD is defined as the quantity that inhibits the autoxidation of pyrogallol by 50% in a 200 μL assay volume.
Slight modifications in the method by Sinha (1972) [17] and Aebi (1984) [18] were used to estimate the catalase (CAT) activity. CAT activity was quantified spectrophotometrically by measuring the decomposition of H2O2 at 240 nm. The reaction mixture consisted of 2.9 mL of 10 mM H2O2 in 50 mM potassium phosphate buffer, pH 7, trailed by 0.1 mL of tissue homogenate. CAT activity was determined by monitoring the decrease in absorbance at 240 nm over 3 min, with results expressed as units per milligram of protein.
The glutathione (GSH) content was assessed using a modified protocol based on the methods of Sedlak and Lindsay (1968) [19] and Smith et al. (1988) [20]. The assay was performed in a 210 μL reaction mixture containing 200 μL of DTNB (prepared in 0.1 M potassium phosphate buffer, pH 7.4) and 10 μL of tissue homogenate. The reaction mixture was incubated at 37°C for 15 min, and absorbance was measured at 412 nm; and results were expressed as GSH/mg protein.
The extent of lipid peroxidation (LPO) was determined by estimating the malondialdehyde content in the brain tissue homogenate using the spectrophotometric method described by Ohkawa et al. [21]. Briefly, the method describes taking 0.2 mL of tissue homogenate, adding 0.2 mL of 8.1% sodium dodecyl sulphate (SDS), 1.5 mL of 20% acetic acid with solution pH adjusted to 3.5 with NaOH, and 1.5 mL of 0.8% aqueous solution of TBA. The final reaction mixture volume was adjusted to 4.0 mL with distilled water, then heated at 95°C for 60 min in a water bath. The reaction mixture was cooled in a water bath, after which 1 mL of distilled water and 5.0 mL of an n-butanol-pyridine mixture (15:1, v/v) were added. The solution was vortexed vigorously and then centrifuged at 4,000 rpm for 10 min. The absorbance of the separated organic (upper) layer was measured at 532 nm. LPO was quantified as nmol of malondialdehyde per mg of protein.
The total protein of the brain hippocampi homogenates was estimated using Bradford reagent. Briefly, 5 μL of tissue homogenate was added to 195 μL of Bradford reagent in a 96 well microplate. The plate was incubated for 15 min at 37°C, after which the absorbance was recorded at 595 nm on a microplate spectrophotometer (Epoch, BioTek, USA).
Brain TNF-α levels were estimated using an ELISA kit as per the methodology provided by the manufacturer in the kit (eBioscience, USA).
Immunohistochemical analysis used 5 μm-thick brain sections fixed in 4% paraformaldehyde, highlighting the dentate gyrus. These sections, manually cut on a microtome and affixed to poly-L-lysine coated slides, underwent dewaxing in xylene and ethanol gradient. Antigen retrieval utilized a pH 6 citrate buffer. Post-cooling, slides were washed to remove buffer, permeabilized with 0.3% Triton X-100, then blocked with 5% goat serum. Incubation with primary antibodies (anti-Aβ1–42, anti-BDNF, anti-Ki67, anti-DCX, anti-NeuN) occurred overnight at 4°C. Subsequent steps involved PBS washes, incubation with a secondary antibody (Alexa Fluor® 680), and DAPI staining, followed by mounting with an antifade reagent for storage. Images were captured using Carl Zeiss Scope A1 microscope, and analyzed for positive cells using Image J 1.48 software. Staining intensity was assessed via ImageJ (version-1.52a). Samples were coded to avoid bias in observation during analysis [22].
Hippocampal tissue samples (approximately 50–100 mg) were homogenized in 1 mL of TRIzol® reagent for total RNA extraction via the guanidinium thiocyanate-phenol-chloroform method. The RNA was then purified using chloroform and isopropanol. A centrifugation step at 13,000 rpm for 15 min at 4°C was performed to separate the phases. Chilled 70% ethanol was used to wash the pellet. The resultant mixture was centrifuged at 7,500 rpm for 5 min at 4°C, air dried to evaporate the ethanol, and reconstituted in diethylpyrocarbonate (DEPC) water; stored at –80°C until further analysis. The RNA purity and concentration were determined using Synergy H1 Multi-Mode Microplate Reader (Model: Synergy H1, BioTek Instruments, USA; Gen5 Software Version 3.11.19) with a Take3 Micro-Volume Plate (BioTek, USA) [22].
The cDNA synthesis was carried out according to the manufacturer’s protocol using BioRad Random Hexamer kit.
qRT-PCR was performed using 2× Brilliant III SYBR Green QPCR Master Mix in the Applied Biosystems Quantstudio™ 5 Real-time PCR system (A28139, Thermo Fisher, USA). Gene-specific primers were used to determine the relative expression level of caspase-3, RAGE (AGER: Advanced Glycation End Product Receptor), and PGC-1α. The expression was normalized to 18S rRNA (Sigma) (Table 2).
Primers used in the study.
| Primer name | Forward (F) | Reverse (R) | Annealing temperature |
|---|---|---|---|
| Caspase 3(Casp3) | 5’GGAGCTTGGAACGCGAAGAA3’ | 3’ACACAAGCCCATTTCAGGGT5’ | 53.8°C for 10 s |
| RAGE(Ager) | 5’GGGTCACAGAAACCGGTGAT3’ | 3’ATCATGTGGGCTCTGGTTGG5’ | 57°C for 10 s |
| PGC-1α(Ppargc1a) | 5’CCAAAGCTGAAGCCCTCTTGC3’ | 3’GTTTAGTCTTCCTTTCCTCGTGTC5’ | 63°C for 30 s |
The amplification reaction for each sample was run in triplicate along with a no-template control (NTC), and the DNA melt curve analysis was used to confirm product specificity. The relative gene expression was determined using the 2-ΔΔCt method for real-time PCR procedures and analysis following the MIQE guidelines [23].
Animals chosen for histopathology underwent perfusion with ice-cold PBS and 4% paraformaldehyde, followed by brain isolation and paraffin embedding. Sections underwent Congo red, Nissl, and H&E staining to assess amyloid deposits, neuronal damage, and glial cell proliferation, respectively. The evaluation was blinded and the images at 100× magnification via Labomed LX 500 microscope were visually graded.
All the results are expressed as mean ± SEM. For statistical comparisons, a One-way ANOVA with Dunnett’s post-hoc test was employed using the GraphPad Prism software, version 5 for Windows (GraphPad Software, San Diego, CA, USA). The Barnes Maze test was analysed using two-way ANOVA followed by a post hoc Bonferroni test. The level of significance was set as #P < 0.05, ##P < 0.01, and ###P < 0.001 when compared with the sham control group, *P < 0.05, **P < 0.01 and ***P < 0.001 when compared with Aβ1–42 treatment group.
In Figure 2, Aβ1–42 treatment notably prolonged escape latencies on days 3 (P < 0.01), 4 (P < 0.05), and 6 (P < 0.001). Apocynin consistently decreased latency throughout the acquisition phase. At 50 mg/kg and 150 mg/kg, latencies significantly decreased from day 3; at 300 mg/kg, it occurred from day 5. On the last acquisition day, all doses significantly reduced latencies (P < 0.001 for 50 mg/kg and 150 mg/kg; P < 0.01 for 300 mg/kg) versus Aβ1–42. Standard treatment also reduced latencies from day 3 onward. During the probe trial on day 7, Aβ1–42-treated rodents struggled to find the escape box. Apocynin at 50 mg/kg notably (P < 0.05) reduced latency, not observed at other doses due to a possible ceiling effect at 150 mg/kg.
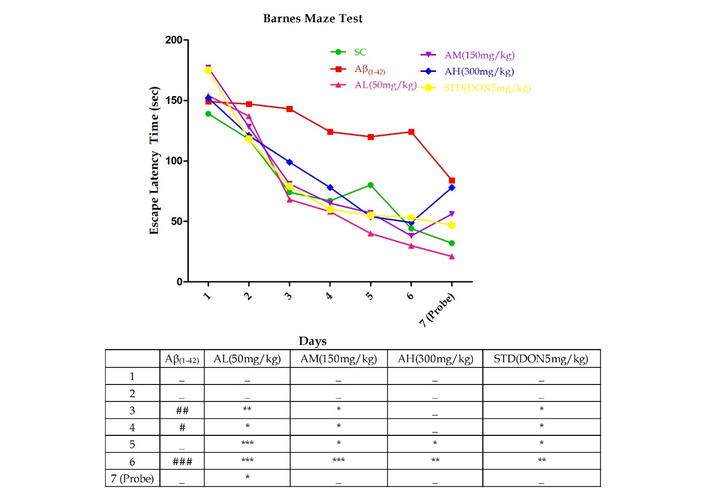
Barnes Maze test performed on day 22 till day 28 in different experimental groups with graded doses of apocynin. Data expressed as mean ± SEM. n = 12. #P < 0.05, ##P < 0.01 and ###P < 0.001 compared with sham control group and *P < 0.05, **P < 0.01 and ***P < 0.001 compared with the Aβ1–42 treatment group using two-way ANOVA followed by post hoc Bonferroni test. AH: apocynin high dose; AL: apocynin low dose; AM: apocynin medium dose; Aβ1–42: negative control (NC) group; SC: sham control group; STD: standard treatment.
Figure 3 displays the evaluation of SOD, CAT, and reduced GSH due to Aβ1–42 treatment’s impact on oxidative stress. Aβ1–42 notably reduced SOD (P < 0.001), GSH (P < 0.05), and CAT (P < 0.001) activity in the hippocampus. Apocynin increased SOD (P < 0.001), CAT (P < 0.001), and, at 150 mg/kg (P < 0.05) and 300 mg/kg (P < 0.01), GSH activity.
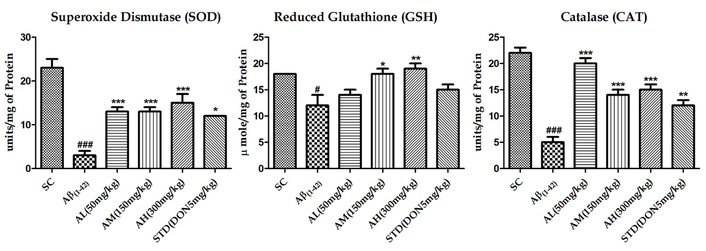
Effect on SOD, GSH and CAT activity in the hippocampus of different study groups. Data expressed as mean ± SEM. n = 6. #P < 0.05, ##P < 0.01 and ###P < 0.001 compared with sham control group and *P < 0.05, **P < 0.01 and ***P < 0.001 compared with the Aβ1–42 treatment group. Data analysed by using One-way ANOVA followed by Dunnett’s test as a post ANOVA test. AH: apocynin high dose; AL: apocynin low dose; AM: apocynin medium dose; Aβ1–42: negative control (NC) group; SC: sham control group; STD: standard treatment.
Aβ1–42 treatment notably escalated hippocampal membrane LPO (P < 0.001, Figure 4), indicating neurodegeneration. Apocynin at all doses significantly mitigated this effect (P < 0.001). The standard treatment also reduced the peptide’s impact.
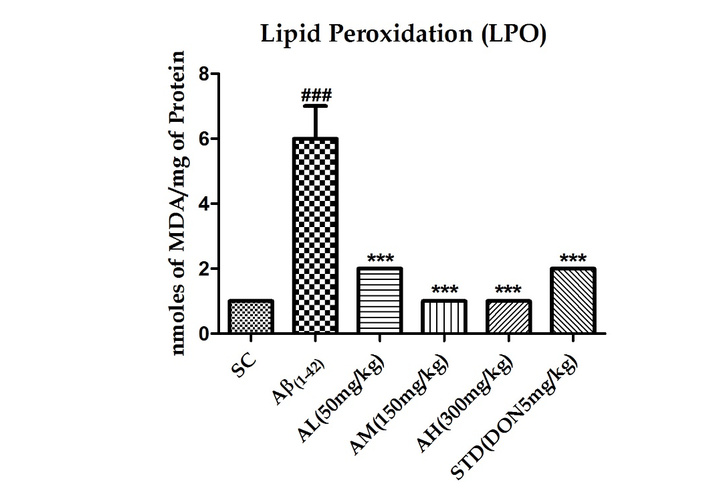
Effect on LPO in the hippocampus of different study groups. Data expressed as mean ± SEM. n = 6. ###P < 0.001 compared with sham control group and ***P <0.001 compared with Aβ1–42 treatment group. Data analysed by using One-way ANOVA followed by Dunnett’s test as a post ANOVA test. AH: apocynin high dose; AL: apocynin low dose; AM: apocynin medium dose; Aβ1–42: negative control (NC) group; SC: sham control group; STD: standard treatment.
TNF-α, an inflammatory cytokine, triggers a cascade leading to caspase activation and apoptosis. Rat hippocampal TNF-α levels post Aβ1–42 treatment (shown in Figure 5) significantly rose (P < 0.01). Apocynin at 50 mg/kg (P < 0.05) and 150 mg/kg (P < 0.01) reduced this dose-dependently. The highest dose (300 mg/kg) had no further effect, suggesting a ceiling effect. Standard drug treatment couldn’t counter peptide effects in the brain.
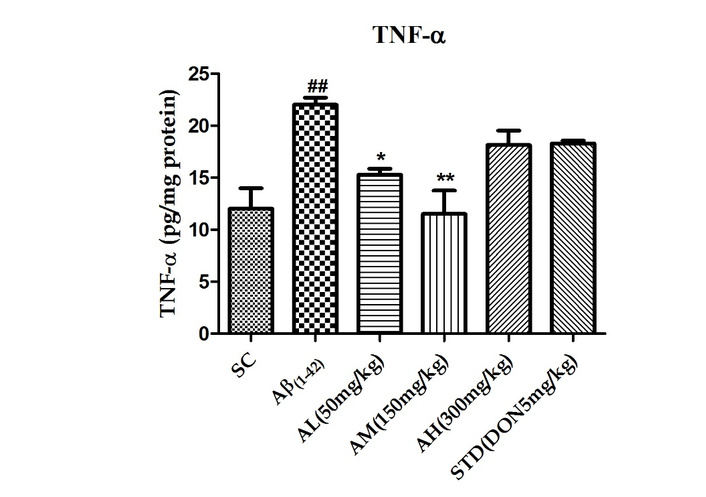
Effect on TNF-α in the hippocampus of different study groups. Data expressed as mean ± SEM. n = 6. ##P < 0.01 compared with sham control group. *P < 0.05 and **P < 0.01 compared with Aβ1–42 treatment group. Data analysed by using One-way ANOVA followed by Dunnett’s test as a post ANOVA test. AH: apocynin high dose; AL: apocynin low dose; AM: apocynin medium dose; Aβ1–42: negative control (NC) group; SC: sham control group; STD: standard treatment.
Caspase-3, a key player in apoptosis, signifies cell demise. Aβ1–42 treatment’s impact on caspase-3 was assessed via gene expression in rat brains. The peptide increased caspase-3 expression in the hippocampus (Figure 6). Apocynin effectively suppressed it at all doses (P < 0.001 for 50 mg/kg and 150 mg/kg, P < 0.05 for 300 mg/kg). Standard treatment couldn’t reduce hippocampal caspase-3 levels.
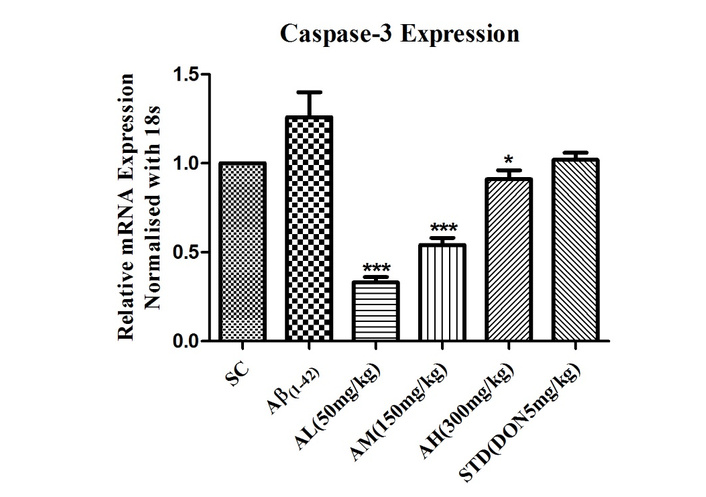
Effect on expression of caspase-3 in the hippocampus of different study groups. Data expressed as mean ± SEM. *P < 0.05 and ***P < 0.001 compared with Aβ1–42 treatment group. Data analysed by using One-way ANOVA followed by Dunnett’s test as a post ANOVA test. AH: apocynin high dose; AL: apocynin low dose; AM: apocynin medium dose; Aβ1–42: negative control (NC) group; SC: sham control group; STD: standard treatment.
For RAGE gene expression, the hippocampal tissue and the cortex were processed separately. Post processing, it was observed that the Aβ1–42 treatment lowered RAGE gene expression in the hippocampus as compared to the cortex, as seen in Figure 7A and B, respectively. Apocynin and standard treatment upregulated RAGE gene expression without significance in the hippocampus (Figure 7A). In the cortex, Aβ1–42 treatment notably increased gene expression in the Aβ1–42 group. Apocynin significantly reduced it at all doses (P < 0.001), as did standard treatment (P < 0.001) in the cortex (Figure 7B).
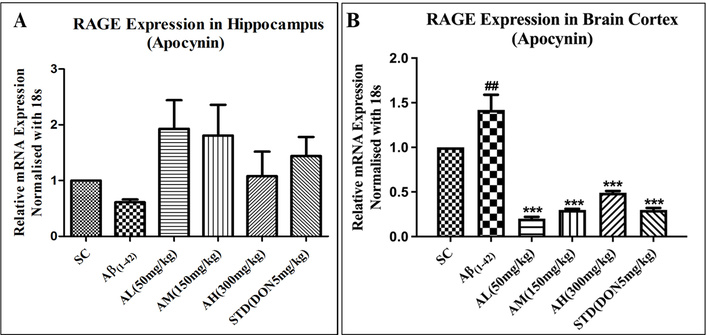
Effect on expression of RAGE in hippocampus (A) and cortex (B) of different study groups. Data expressed as mean ± SEM. ##P < 0.01 compared with sham control group and ***P < 0.001 compared with Aβ1–42 treatment group. Data analysed by using One-way ANOVA followed by Dunnett’s test as a post ANOVA test. AH: apocynin high dose; AL: apocynin low dose; AM: apocynin medium dose; Aβ1–42: negative control (NC) group; SC: sham control group; STD: standard treatment.
Aβ1–42 treatment decreased hippocampal PGC-1α expression in the negative control but wasn’t significantly different from the sham group (Figure 8). Apocynin at 50 mg/kg notably upregulated gene expression (***P < 0.001), suggesting mitochondrial biogenesis. Standard drug treatment also significantly increased expression (**P < 0.01) compared to the negative control in the hippocampus.
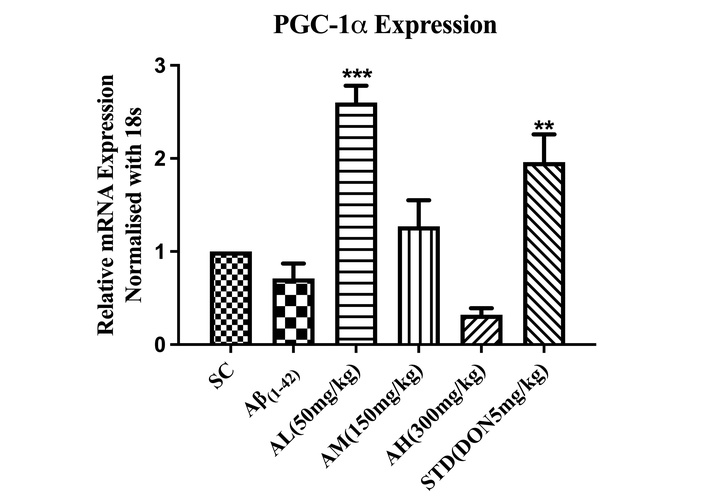
Effect on expression of PGC-1α in the hippocampus of different study groups. Data expressed as mean ± SEM. **P < 0.01, and ***P < 0.001, compared with Aβ1–42 treatment group. Data analysed by using One-way ANOVA followed by Dunnett’s test as a post-ANOVA test. AH: apocynin high dose; AL: apocynin low dose; AM: apocynin medium dose; Aβ1–42: negative control (NC) group; SC: sham control group; STD: standard treatment.
Aβ1–42 showed significant amyloid deposits in the negative control hippocampus (Figure 9) versus the sham control group. Apocynin orally reduced the load at all doses, but non-significantly due to sample variation. Standard treatment couldn’t reduce amyloid load.
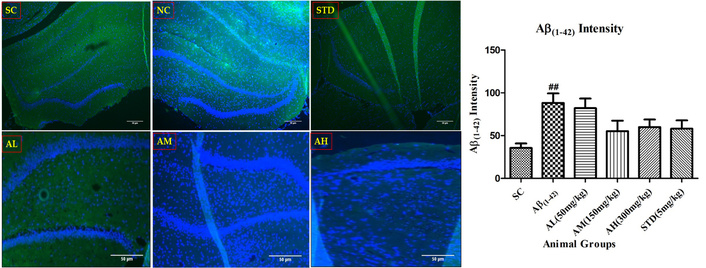
Aβ1–42 immunohistochemistry in dentate gyrus of hippocampus with different study groups. Data expressed as mean ± SEM. ##P < 0.01 compared with sham control group. Data analysed by using One-way ANOVA followed by Dunnett’s test as a post-ANOVA test. AH: apocynin high dose; AL: apocynin low dose; AM: apocynin medium dose; Aβ1–42: negative control (NC) group; SC: sham control group; STD: standard treatment.
Aβ1–42 reduced BDNF-positive neurons in the hippocampus (Figure 10) versus the sham control group. Apocynin treatment boosted BDNF compared to the negative control. All doses increased BDNF, with 50 and 150 mg/kg significantly enhancing it (P < 0.05). Apocynin showed better neuroprotective activity than standard treatment, which didn’t notably alter BDNF-positive neurons.
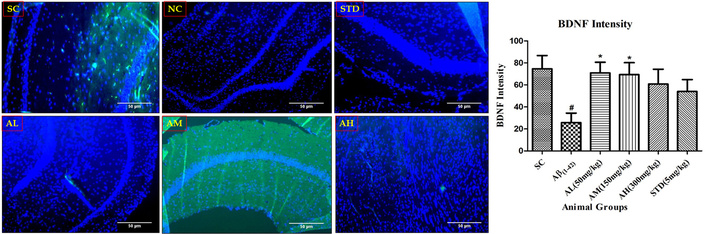
BDNF immunohistochemistry in the dentate gyrus of hippocampus with different study groups. Data expressed as mean ± SEM. #P < 0.05 compared with sham control group. *P < 0.05 compared with Aβ treatment group. Data analysed by using One-way ANOVA followed by Dunnett’s test as a post-ANOVA test. AH: apocynin high dose; AL: apocynin low dose; AM: apocynin medium dose; Aβ1–42: negative control (NC) group; SC: sham control group; STD: standard treatment.
Aβ1–42 notably reduced Ki-67 nuclei in the hippocampus (Figure 11) versus the sham control group. Apocynin increased Ki-67 compared to the negative control, significantly protecting in a dose-dependent manner (P < 0.05 at 50 mg/kg, P < 0.001 at 150 and 300 mg/kg, with a ceiling effect at 150 mg/kg). The results imply that apocynin-induced neuronal proliferation. Standard treatment, however, didn’t alter Ki-67 significantly compared to peptide treatment.
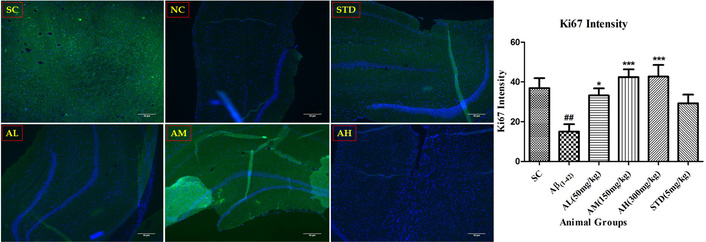
Ki-67 immunohistochemistry in the dentate gyrus of hippocampus with different study groups. Data expressed as mean ± SEM. ##P < 0.01 compared with sham control group. *P < 0.05 and ***P < 0.001 compared with Aβ treatment group. Data analysed by using One-way ANOVA followed by Dunnett’s test as a post-ANOVA test. AH: apocynin high dose; AL: apocynin low dose; AM: apocynin medium dose; Aβ1–42: negative control (NC) group; SC: sham control group; STD: standard treatment.
Aβ1–42 notably reduced hippocampal DCX-positive neurons (Figure 12) versus the sham control group. Apocynin-induced neural stem cell proliferation into progenitors, increasing DCX compared to the negative control. Apocynin significantly boosted adult hippocampal cell proliferation dose-dependently (P < 0.05 at 150 mg/kg, plateauing at 300 mg/kg). Standard treatment failed to maintain hippocampal neurogenesis.
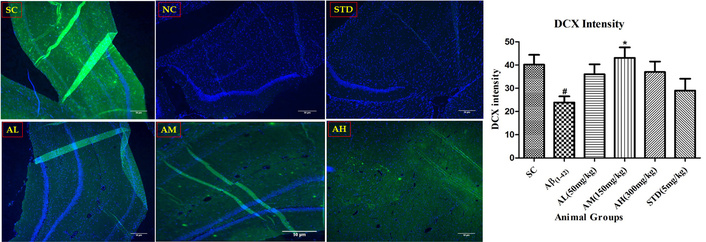
DCX immunohistochemistry in dentate gyrus of the hippocampus with different study groups. Data expressed as mean ± SEM. #P < 0.05 compared with sham control group. *P < 0.05 compared with Aβ treatment group. Data analysed by using One-way ANOVA followed by Dunnett’s test as a post-ANOVA test. AH: apocynin high dose; AL: apocynin low dose; AM: apocynin medium dose; Aβ1–42: negative control (NC) group; SC: sham control group; STD: standard treatment.
Aβ1–42 notably reduced hippocampal NeuN-positive neurons (Figure 13) compared to the sham control group. Apocynin showed increased NeuN compared to the negative control, but insignificant due to high SEM. Standard treatment didn’t alter NeuN-positive neurons.
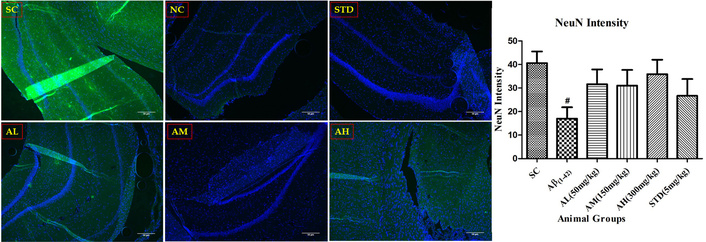
NeuN immunohistochemistry in the dentate gyrus of hippocampus with different study groups. Data expressed as mean ± SEM. #P < 0.05 compared with sham control group. Data analysed by using One-way ANOVA followed by Dunnett’s test as a post-ANOVA test. AH: apocynin high dose; AL: apocynin low dose; AM: apocynin medium dose; Aβ1–42: negative control (NC) group; SC: sham control group; STD: standard treatment.
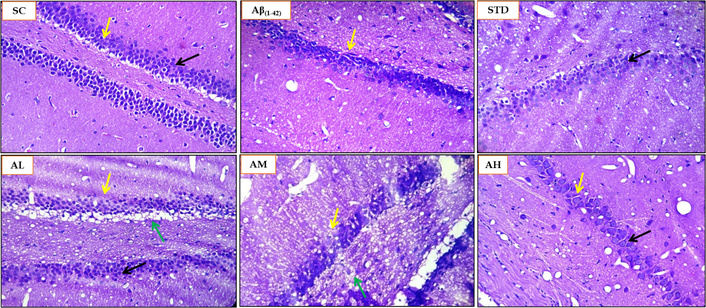
The Congo red staining was performed on the rat brain sections of the Aβ1–42 induced rat AD model to evaluate the amyloid deposit load in the hippocampus (CA and dentate gyrus) region. The sham control group did not display any amyloid deposits in the hippocampus, as seen in Figure 14. The highest load of the amyloid protein was found in the Aβ1–42 group with a score of 3, as seen in Table 3. Apocynin at all three doses was able to reduce the amyloid load and at 50 mg/kg was efficient amongst the three apocynin doses, with a score of 1, and the other two doses, 150 mg/kg and 300 mg/kg, displayed a score of 2. This aligns with the results obtained for inflammatory parameters seen with the low dose of apocynin, namely 50 mg/kg.
Histopathological analysis using Congo red staining for SC, Aβ1–42, STD, apocynin (AL, AM, AH) in the hippocampus at magnification of 100×. Yellow arrow: hippocampus brain CA region; red arrow: amyloid deposits stained red by Congo red stain; black arrow: healthy neuron. AH: apocynin high dose; AL: apocynin low dose; AM: apocynin medium dose; Aβ1–42: negative control (NC) group; SC: sham control group; STD: standard treatment.
Histopathological scoring of Congo red staining for rat brain samples.
| Animal groups | CA dentate gyrus hippocampus(Congo red amyloid deposits score) |
|---|---|
| SC | 0 |
| Aβ1–42 | 3 |
| STD (DON 5 mg/kg) | 1 |
| AL (APO 50 mg/kg) | 1 |
| AM (APO 150 mg/kg) | 2 |
| AH (APO 300 mg/kg) | 2 |
Scoring 3: severe damage/change; 2: moderate damage/change; 1: mild change; 0: no change. AH: apocynin (APO) high dose; AL: APO low dose; AM: APO medium dose; Aβ1–42: negative control (NC) group; SC: sham control group; STD: standard donepezil (DON) treatment.
The Nissl staining was performed on the rat brain sections of the Aβ1–42 induced rat AD model to evaluate the disrupted or damaged, or pyknotic nuclei in the hippocampus (CA and dentate gyrus). The sham control group displayed mild damage or pyknotic nuclei (Figure 15) with a score of 1 (Table 4). The Aβ1–42 showed a moderate presence of pyknotic nuclei with a score of 2. Apocynin was able to halt the neuronal damage with scores lower compared to the Aβ1–42 group. Apocynin at 300 mg/kg was able to stop the neuronal damage completely with score of 0. Apocynin at 50 mg/kg showcased moderate neuronal damage with a score of 2. Apocynin at 150 mg/kg and the standard treatment group all displayed mild neuronal damage with a score of 1.
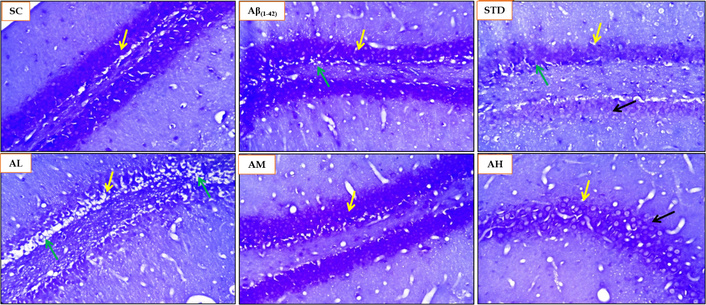
Histopathological analysis using Nissl staining for SC, Aβ1–42, STD and apocynin (AL, AM, AH) in the hippocampus at magnification of 100×. Yellow arrow: hippocampus brain CA region; green arrow: degenerative changes (Nissl staining) and neuronal damage, degeneration and pyknotic nuclei in dentate gyrus and CA region; black arrow: healthy neuron. AH: apocynin high dose; AL: apocynin low dose; AM: apocynin medium dose; Aβ1–42: negative control (NC) group; SC: sham control group; STD: standard treatment.
Histopathological scoring of Nissl staining for rat brain samples.
| Animal groups | CA dentate gyrus hippocampus[Nissl staining neuronal damage (degeneration and necrosis)] |
|---|---|
| SC | 1 |
| Aβ1–42 | 2 |
| STD (DON 5 mg/kg) | 1 |
| AL (APO 50 mg/kg) | 2 |
| AM (APO 150 mg/kg) | 1 |
| AH (APO 300 mg/kg) | 0 |
Scoring 2: moderate damage/change; 1: mild change; 0: no change. AH: apocynin (APO) high dose; AL: APO low dose; AM: APO medium dose; Aβ1–42: negative control (NC) group; SC: sham control group; STD: standard donepezil (DON) treatment.
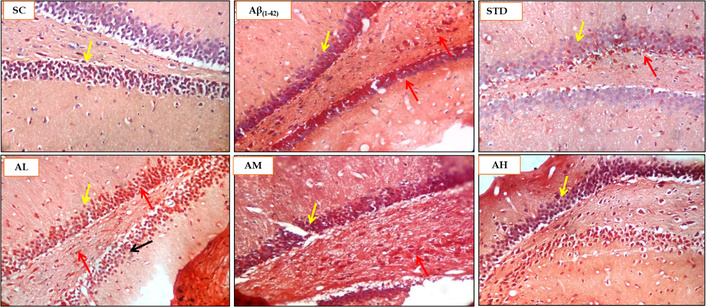
The H&E staining was performed on the rat brain sections of the Aβ1–42 induced rat AD model to evaluate the degenerative changes in the hippocampus (CA and dentate gyrus). The sham control group showed no neuronal degeneration or vacuolation in the hippocampus. The Aβ1–42 treatment induced moderate neuronal degeneration and vacuolation (Figure 16) as evidenced by the score of 2 (Table 5). Apocynin treatment curtailed neuronal degeneration and vacuolation. Apocynin at 300 mg/kg was highly effective in ameliorating the neuronal damage and vacuolation, with a score of 0. Apocynin at 50 mg/kg displayed a score of 2. The standard drug treatment group and the 150 mg/kg apocynin exhibited mild change or neuronal damage, with a score of 1.
Histopathological analysis using H&E staining for SC, Aβ1–42, STD and apocynin (AL, AM, AH) in the hippocampus at magnification of 100×. Yellow arrow: hippocampus brain CA region; green arrow: degenerative changes (H&E staining) and neuronal damage, degeneration and pyknotic nuclei in dentate gyrus and CA region; black arrow: healthy neuron. AH: apocynin high dose; AL: apocynin low dose; AM: apocynin medium dose; Aβ1–42: negative control (NC) group; SC: sham control group; STD: standard treatment.
Histopathological scoring of H&E staining for rat brain samples.
| Animal groups | CA dentate gyrus hippocampus(H&E staining degeneration of neuron and vacuolation) |
|---|---|
| SC | 0 |
| Aβ1–42 | 2 |
| STD (DON 5 mg/kg) | 1 |
| AL (APO 50 mg/kg) | 2 |
| AM (APO 150 mg/kg) | 1 |
| AH (APO 300 mg/kg) | 0 |
Scoring 2: moderate damage/change; 1: mild change; 0: no change. AH: apocynin (APO) high dose; AL: APO low dose; AM: APO medium dose; Aβ1–42: negative control (NC) group; SC: sham control group; STD: standard donepezil (DON) treatment.
AD presents a formidable therapeutic challenge, characterized by its multifactorial pathology involving Aβ aggregation, tau tangles, neuroinflammation, oxidative stress, and mitochondrial dysfunction, leading to neuronal complications. The 2025 AD pipeline has seen a growth in the number of trials and agents used to target AD pathology. A noticeable increase in Phase 1 trials demonstrates momentum toward identifying new therapies for the treatment of AD [24]. Prevailing therapeutic strategies, particularly recent monoclonal antibodies targeting Aβ (e.g., aducanumab, lecanemab), demonstrate the significance of amyloid clearance but offer modest cognitive benefits and are associated with notable adverse effects [25, 26]. Other approaches, such as BACE inhibitors, have faced high clinical failure rates, underscoring the limitations of single-pathway targeting [27]. All put together, the emerging failures of therapeutic options in various phases of clinical trials increase the cost of the overall drug discovery process, adding to the ongoing financial burden towards the search for a novel therapeutic strategy. Owing to the limitations of the current treatment options and the ever-increasing financial burden, researchers around the globe and many AD patients are experimenting and seeking complementary, alternative, and supportive salutary options in terms of medicines from natural sources. Thus, there is an increasing interest in the usage of alternative natural approaches in the treatment of AD along with the current available treatment. This has led to the development of medicinal food like Axona® (alternate energy source to neurons), Souvenaid® (precursors to enhance synaptic function), CerefolinNAC® (addresses oxidative stress associated with memory loss) [28].
This high attrition rate in AD drug development highlights a critical unmet need: The necessity for multi-target agents that can concurrently address the complex, interconnected pathological cascades of AD. This study explores the potential of apocynin, a natural compound with established antioxidant and anti-inflammatory properties, as one such multi-functional therapeutic candidate in a preclinical model of Aβ-induced neurodegeneration. Our findings demonstrate that apocynin confers comprehensive neuroprotection against Aβ1–42-induced toxicity. A key breakthrough is its superior nootropic effect over the standard acetylcholinesterase inhibitor donepezil. In the Barnes Maze test, apocynin (50 mg/kg) significantly enhanced spatial learning and memory retention more effectively than donepezil, suggesting benefits beyond mere cholinergic modulation. Furthermore, apocynin robustly restored the hippocampal antioxidant defence system, normalizing levels of SOD, GSH, and CAT, and effectively reduced LPO. Apocynin at all doses was able to increase the levels of SOD, the first crucial step in detoxifying superoxide radicals and restoring the antioxidant defence mechanisms. CAT levels were also augmented at all doses by apocynin, thus preventing the accumulation of hydrogen peroxide generated due to the detoxification of ROS by SOD. Further, the higher two doses of apocynin were able to significantly raise the levels of GSH, complementing CAT and protecting lipids from oxidation. The protection of lipids from oxidation was further documented by decreased levels of LPO at all doses of apocynin.
It also exhibited significant anti-inflammatory and anti-apoptotic efficacy, as evidenced by the reduction of TNF-α and the downregulation of caspase-3 expression. Crucially, apocynin promoted neurogenic activity, preserving BDNF-positive neurons and significantly increasing markers of cell proliferation (Ki-67) and neuronal differentiation (DCX) in the hippocampal neurogenic niche. These multi-faceted effects converged to yield strong histological improvements, with apocynin (300 mg/kg) markedly reducing apoptotic nuclei (Nissl stain) and neuronal vacuolation (H&E stain).
RAGE plays a dual role in AD pathogenesis as an inflammatory mediator and inducer of oxidative stress, with amyloidogenic APP processing regulated via RAGE-dependent activation of GSK3β and p38 MAPK as put forward by the work of Fang et al. [29]. In our study, Aβ treatment in rats showed region-specific modulation of RAGE, with downregulation in the hippocampus and upregulation in the cortex, contrary to some reports. In neurons, RAGE mediates Aβ-induced oxidative stress, transport, and mitochondrial dysfunction; in microglia, it amplifies inflammation. Immunohistochemistry revealed hippocampal Aβ accumulation, triggering neuronal and microglial RAGE expression, inflammation, caspase-3 activation, and apoptosis. The reduced RAGE in the hippocampus likely reflects the loss of RAGE-expressing neurons due to apoptosis, as supported by Nissl staining, which shows increased pyknotic nuclei [score 2 in the hippocampus; 1 in cortex (cortex data not discussed in the current manuscript)]. Pyknosis indicates irreversible chromatin condensation in apoptosis or necrosis, confirming neuronal damage and linking regional RAGE modulation to cell death in an Aβ-rich environment.
The mechanistic novelty of our work lies in the demonstration that apocynin’s benefits may be mediated through the upregulation of PGC-1α, a master regulator of mitochondrial biogenesis and antioxidant defence. The significant upregulation of hippocampal PGC-1α, particularly at the 50 mg/kg dose, an effect that surpassed donepezil, suggests a unique mechanism to counteract Aβ-induced mitochondrial dysfunction and oxidative stress, a core deficit in AD. This action, combined with its inhibition of neuroinflammation via reduction in TNF-α levels and apoptosis via downregulation of caspase-3 expression, positions apocynin as a pleiotropic modulator that simultaneously strengthens endogenous defences while attenuating multiple damaging pathways. While its direct impact on amyloid load was not significant in immunohistochemistry, the slight reduction observed in Congo red staining suggests its indirect effects on the amyloidogenic pathway. However, further investigations are warranted to understand the dose that can modulate the AD pathology at multiple levels. This ability to target several AD-related pathologies simultaneously addresses a critical shortcoming of current single-target therapies and underscores its significant potential as an adjuvant or standalone disease-modifying therapy.
While our results are promising, several limitations must be acknowledged to contextualize our findings and guide future research. Firstly, the inconsistencies observed in the efficacy of single doses across different AD-related targets highlight the need for further studies to establish the optimal dose required to effectively modulate multiple aspects of AD pathology. The pharmacokinetic profile of apocynin, specifically its blood-brain barrier permeability in this model, was not directly assessed. However, a recent study by Liu et al. [6] demonstrated that a short half-life, rapid clearance, good distribution, and inhibition of ROS production in major organs characterize the pharmacokinetic and pharmacodynamic correlation (PKPD) of apocynin. Apocynin can easily cross the blood-brain barrier and can reduce the brain oxidative stress associated with metabolic disorders and aging, which is seen in our study as well [6].
Secondly, this study utilized an acute Aβ injection model, which does not fully recapitulate the chronic, progressive nature of human AD. A chronic model shall also help to understand the synaptic integration of the newly formed neurons into the existing circuitry via evaluating the expression of NeuN, which our study was not able to demonstrate. Thirdly, although Stefanska and Pawliczak [30] reveal that the LD50 of apocynin is 9 g/kg, a thorough investigation into the long-term safety and potential side effects of chronic apocynin administration is crucial before clinical translation [30]. Future studies should focus on these pharmacokinetic and long-term safety assessments and explore the precise molecular mechanisms upstream of PGC-1α activation.
The present study demonstrated apocynin as a compelling multi-target therapeutic and adjuvant candidate for AD, capable of addressing its multifactorial pathology. By enhancing spatial learning, memory, and neurogenesis, restoring antioxidant defences (SOD, CAT, GSH), reducing LPO, and attenuating neuroinflammation (TNF-α, RAGE) and apoptosis (caspase-3), apocynin exhibits superior pleiotropic efficacy over donepezil. Its modulation of PGC-1α suggests a novel mechanism countering Aβ-induced mitochondrial dysfunction and oxidative stress, while histological improvements confirm neuroprotection. The region-specific RAGE modulation observed links its benefits directly to Aβ-rich pathological environments, further supporting its potential to improve neuronal health and cognitive performance. Collectively, these findings could support the integration of apocynin into the therapeutic regimen as an adjuvant or standalone disease-modifying strategy. However, further exploration in chronic AD models and long-term safety evaluations is warranted to optimise dosing and fully harness its neuroprotective, nootropic and neurotrophic potential.
AD: Alzheimer’s disease
CAT: catalase
DCX: doublecortin
GSH: glutathione
LPO: lipid peroxidation
NeuN: Neuronal Nuclei
NOX: NADPH oxidase
ROS: reactive oxygen species
SOD: superoxide dismutase
TNF-α: tumour necrosis factor-α
The authors would like to acknowledge Ms. Aayushi Trivedi, Ms. Priyanka Kashyap, and Mr. Pravin Salunkhe for their assistance in the experiment.
SB: Conceptualization, Data curation, Formal analysis, Investigation, Methodology, Writing—original draft, Writing—review & editing. SM: Writing—review & editing, Methodology, Investigation. VP: Writing—review & editing, Methodology, Investigation. AK: Writing—review & editing, Methodology, Investigation. VD: Writing—review & editing, Resources, Methodology, Investigation. SS: Writing—review & editing, Supervision, Resources, Methodology, Investigation, Funding acquisition, Formal analysis, Data curation, Conceptualization. All authors have read and have approved the submitted version.
The authors declare that they have no conflicts of interest.
The entire animal study was carried out according to a protocol approved by the Committee for the Purpose of Control and Supervision on Experiments on Animals (CPCSEA), India-registered Institutional Animal Ethics Committee (IAEC). The procedures followed for the animal study complied with the Guide for the Care and Use of Laboratory Animals. The approved protocol number is ICT/IAEC/2017/P26.
Not applicable.
Not applicable.
The datasets that support the findings of this study are available from the corresponding author upon reasonable request.
This work was supported by the University Grants Commission Basic Science Research (UGC-BSR) Fellowship [F.25-1/2014-15 (BSR)/No. F.5-63/2007 (BSR)]. The authors would like to declare that the funders had no role in study design, data collection and analysis, decision to publish, or preparation of the manuscript.
© The Author(s) 2025.
Open Exploration maintains a neutral stance on jurisdictional claims in published institutional affiliations and maps. All opinions expressed in this article are the personal views of the author(s) and do not represent the stance of the editorial team or the publisher.
Copyright: © The Author(s) 2025. This is an Open Access article licensed under a Creative Commons Attribution 4.0 International License (https://creativecommons.org/licenses/by/4.0/), which permits unrestricted use, sharing, adaptation, distribution and reproduction in any medium or format, for any purpose, even commercially, as long as you give appropriate credit to the original author(s) and the source, provide a link to the Creative Commons license, and indicate if changes were made.

View: 1666
Download: 29
Times Cited: 0
Leonel Pereira, Ana Valado
Sharon Smith ... David Heal
Prerna Sarup ... Sonia Pahuja
Ekaterina P. Krutskikh ... Artem P. Gureev
Susmita Das ... Shylaja Hanumanthappa
Luis Antonio Ramirez-Contreras ... Andrés Frausto de Alba
Agustina Lulustyaningati Nurul Aminin ... Muhammad Ajmal Shah
Sheyla Delgado-Lora ... Giselle Pentón-Rol