 Original Article

Affiliation:
1Internal Medicine Department, Faculty of Medicine, Tanta University, Tanta 31527, Egypt
Email: noora.nada2015@gmail.com
ORCID: https://orcid.org/0000-0002-6657-7430
Affiliation:
1Internal Medicine Department, Faculty of Medicine, Tanta University, Tanta 31527, Egypt
Affiliation:
1Internal Medicine Department, Faculty of Medicine, Tanta University, Tanta 31527, Egypt
ORCID: https://orcid.org/0000-0002-0448-4837
Affiliation:
2Clinical Pathology Department, Faculty of Medicine, Tanta University, Tanta 31527, Egypt
Affiliation:
1Internal Medicine Department, Faculty of Medicine, Tanta University, Tanta 31527, Egypt
ORCID: https://orcid.org/0000-0003-4056-7207
Explor Immunol. 2026;6:1003249 DOI: https://doi.org/10.37349/ei.2026.1003249
Received: September 13, 2025 Accepted: March 23, 2026 Published: April 20, 2026
Academic Editor: Jean Amiral, HYPHEN BioMed, France
Aim: To evaluate the relationship between serum calprotectin and serum amyloid A with musculoskeletal ultrasonographic findings in rheumatoid arthritis (RA) patients, as RA is the most common chronic inflammatory joint disease in which the infiltration and activation of inflammatory cells are important. Calprotectin and serum amyloid A protein are over-secreted in response to acute and chronic inflammation. Musculoskeletal ultrasound is more sensitive than physical examination for the evaluation of synovitis.
Methods: A control group of 30 healthy individuals, 30 patients with active RA, and 30 patients with inactive RA participated in this cross-sectional study. Utilizing the RA disease activity (Disease Activity Score 28, DAS28) score was evaluated. Serum amyloid A and serum calprotectin were measured in all participants, and musculoskeletal ultrasound on the hands and wrists were done for all subjects.
Results: A significant difference was observed among the studied groups with respect to serum calprotectin and serum amyloid A levels (P < 0.001). A significant positive correlation was observed between serum amyloid A and several inflammatory and clinical parameters, including C-reactive protein (CRP), erythrocyte sedimentation rate (ESR), DAS28 score, serum calprotectin, and synovitis. Similarly, serum calprotectin levels demonstrated a significant positive correlation with ESR, DAS28 score, serum amyloid A, and synovitis. These findings highlight the potential value of both serum amyloid A and serum calprotectin as biomarkers reflecting disease activity and inflammatory burden in RA.
Conclusions: Serum amyloid A and serum calprotectin can be used as markers of RA activity.
Rheumatoid arthritis (RA) is a systemic autoimmune condition characterized by persistent synovial inflammation, which ultimately results in the degradation of articular cartilage and erosion of the underlying subchondral bone [1]. The course of RA varies from mild arthritis to severe joint destruction with disability. The development of RA involves the recruitment and activation of inflammatory cells, which secrete various mediators that significantly contribute to disease pathogenesis [2].
Calprotectin consists of two proteins, S100A8 and S100A9, which constitute the predominant portion of the cytosolic protein content of monocytes and neutrophils [3]. Calprotectin is released from leukocytes localized at the site of inflammation, unlike C-reactive protein (CRP), erythrocyte sedimentation rate (ESR) [4]. Multiple studies have reported elevated serum calprotectin levels in RA patients exhibiting active disease, but its correlation with musculoskeletal ultrasound-determined synovitis, which represents the most sensitive tool for determining RA activity, has been discussed in this article [5].
Serum amyloid A (SAA) protein is released from hepatocytes in response to acute and chronic inflammation [6], and its secretion is induced by inflammatory cytokines, including interleukin-6 (IL-6), IL-1, and tumor necrosis factor (TNF) [7]. The level of acute phase SAA rises sharply in response to acute inflammatory processes and tissue injury, increasing to values that exceed normal levels by a factor of 1,000 within 5–6 hours [8].
Musculoskeletal ultrasonography (MSUS) is a universal non-invasive imaging technique known for its sensitivity in detecting joint inflammation [9]. Power Doppler (PD) imaging visualizes blood flow within the synovial tissue, which discriminates active synovial inflammation from synovial hypertrophy [10].
The aim of the study is to evaluate the relationship between serum calprotectin and SAA with musculoskeletal ultrasonographic findings in RA patients.
Ninety individuals participated in this cross-sectional research, who were split up as follows: 30 normal controls and 60 RA patients were identified using the 2010 American College of Rheumatology (ACR)/EULAR classification criteria of RA.
Additionally, RA patients were subdivided into 2 equal groups: group 1 and group 2, representing the RA active group Disease Activity Score 28 (DAS28) score ≥ 3.2 and the RA inactive group (DAS28 score < 3.2). As controls, there were thirty volunteers in good health who were matched for age and sex. The patients’ ages varied from 20 to 58. There were five males and twenty-five females.
Following clearance from Tanta University Hospitals Research Ethical Committee (Approval code: 36061/11/22), the study was conducted from November 2022 to October 2023 in Tanta, Egypt. Every patient provided written consent after being fully briefed.
Inclusion criteria: For every person who fulfilled the 2010 ACR/EULAR classification criteria of RA, the DAS28 score was utilized to assess the disease activity.
Exclusion criteria: The study excluded patients with inflammatory bowel diseases, chronic infections, diabetes mellitus, other autoimmune diseases, osteoarthritis, adolescents less than sixteen years old, pregnancy and breast feeding and Familial Mediterranean Fever (FMF) patients.
Complete blood count, ESR, CRP, liver function tests, serum urea and creatinine, rheumatoid factor (RF), anti-CCP (cyclic citrullinated peptide), SAA, serum calprotectin, and MSUS of both hands and wrists were performed for all patients.
Statistical Package for Social Science (SPSS) was employed for the analysis. Sorting, tabulation, and analysis of data were performed by using SPSS-V21. Descriptive statistics, including range, mean, and standard deviation, were calculated for quantitative data. Qualitative data were summarized using counts and expressed as percentages or proportions for each category; also, significance was tested whenever needed. The Chi-square test (χ2) or Monte Carlo simulation was employed to compare qualitative variables between the two groups. The independent t-test was used to compare the means of two groups for normally distributed independent samples. The Mann-Whitney U test was applied to compare distributions between two independent groups for non-normally distributed data. For comparison of means among the three groups, one-way ANOVA was used for parametric data, while the Kruskal-Wallis test was applied for non-parametric data. P < 0.05 was adopted as the level of significance.
Twenty-six females and four males, aged from 28 to 55 years old, with a median age of 40.40 ± 7.85, made up group 1 (inactive RA). Twenty-four females and six males in group 2, aged from 22 to 58 years, with a median age of 36.30 ± 7.69 (active RA). 30 healthy participants (25 females and 5 males) aged from 20 to 58 years, with a median age of 36.33 ± 10.12, made up group 3 (control group).
Table 1 shows that there were significant differences among the studied groups regarding morning stiffness, number of swollen and tender joints, and drugs taken (P < 0.05).
Clinical evaluation of the studied patients of different groups.
| Clinical evaluation of the studied patients of different groups | Group 1 (n = 30): active RA patients | Group 2 (n = 30): inactive RA patients | Sig. test | P value | |||
|---|---|---|---|---|---|---|---|
| N | % | N | % | ||||
| Morning stiffness > one hour | Absent | 11 | 36.7 | 0 | 0.0 | χ2 13.469 | < 0.001* |
| Present | 19 | 63.3 | 30 | 100.0 | |||
| Drugs | Steroids and biological DMARD | 0 | 0.0 | 4 | 13.3 | χ2 4.286 | 0.038* |
| Steroid and conventional synthetic DMARD | 30 | 100.0 | 26 | 86.7 | |||
| Duration of the disease (in years) | Mean ± SD | 5.53 ± 2.81 | 5.67 ± 3.18 | 429.00 | 0.754 | ||
| Median | 5 | 5.5 | |||||
| Range | 1–12 | 1–10 | |||||
| Number of swollen joints | Mean ± SD | 1 ± 1.11 | 8 ± 4.38 | T 8.923 | < 0.001* | ||
| Median | 1 | 7 | |||||
| Range | 0–4 | 2–16 | |||||
| Number of tender joints | Mean ± SD | 2 ± 1.01 | 10 ± 3.71 | T 11.227 | < 0.001* | ||
| Median | 2 | 9 | |||||
| Range | 0–4 | 4–16 | |||||
Data are presented as mean ± SD, range, or frequency (%). χ2: Chi-square test; *: significant as P < 0.05; P: comparison between active and inactive rheumatoid arthritis; T: independent t-test; DMARD: disease-modified anti-rheumatic drug.
Table 2 shows significant intergroup differences regarding ESR, CRP, RF, and anti-CCP (P < 0.001).
Inflammatory markers among the studied patients of different groups.
| Inflammatory markers among the studied patients of different groups | Group 1 (n = 30): active RA patients | Group 2 (n = 30): inactive RA patients | Group 3 (n = 30): control group | Kruskal-Wallis test | P value | ||
|---|---|---|---|---|---|---|---|
| ESR1 (mm/h) | |||||||
| Mean ± SD | 16.00 ± 2.21 | 52.57 ± 25.74 | 13.73 ± 0.74 | 68.371 | < 0.001* | ||
| Median | 15 | 50 | 14 | ||||
| Range | 13–20 | 15–135 | 13–15 | ||||
| ESR2 (mm/h) | |||||||
| Mean ± SD | 23.53 ± 5.23 | 80.03 ± 23.34 | 18.50 ± 1.83 | 64.787 | < 0.001* | ||
| Median | 25 | 80 | 19 | ||||
| Range | 15–30 | 32–145 | 15–20 | ||||
| CRP (mg/dL) | |||||||
| Mean ± SD | 28.28 ± 21.26 | 3.8 ± 3.12 | 1.0 ± 0.0 | 67.974 | < 0.001* | ||
| Median | 6 | 18 | 0 | ||||
| Range | 0–10 | 2–95 | 0–0 | ||||
| Rheumatoid factor (IU/mL) | |||||||
| Positive | 19 | 63.3% | 25 | 83.3% | - | χ2 23.655 | < 0.001* |
| Negative | 11 | 36.7% | 5 | 16.7% | - | ||
| Anti-CCP (U/mL) | |||||||
| Positive | 19 | 63.3% | 26 | 86.7% | - | χ2 21.361 | < 0.001* |
| Negative | 11 | 36.7% | 4 | 13.3% | - | ||
Data are presented as mean ± SD or frequency (%); the Kruskal-Wallis test was used for comparison among the three groups. χ2: Chi-square test; *: significant as P < 0.05 represents the overall comparison among the three groups; anti-CCP: anti-cyclic citrullinated peptide; CRP: C-reactive protein; ESR: erythrocyte sedimentation rate.
Table 3 shows that SAA and serum calprotectin were higher in group 2 than in group 1 and group 3. This analysis revealed significant intergroup variation in SAA and serum calprotectin levels (P < 0.001).
Serum amyloid A and Serum calprotectin among the studied patients of different groups.
| Serum amyloid A and serum calprotectin among the studied patients of different groups | Group 1 (n = 30): active RA patients | Group 2 (n = 30): inactive RA patients | Group 3 (n = 30): control group | Kruskal-Wallis test | P value |
|---|---|---|---|---|---|
| Serum amyloid A (mg/L) | |||||
| Mean ± SD | 16.25 ± 13.27 | 167.28 ± 99.47 | 5.83 ± 2.69 | 61.910 | < 0.001* |
| Median | 15.35 | 147 | 5.5 | ||
| Range | 3–41.8 | 47.5–408 | 1–10 | ||
| Serum calprotectin (pg/mL) | |||||
| Mean ± SD | 169.58 ± 140.14 | 250.46 ± 138.2 | 199.97 ± 49.11 | 14.915 | < 0.001* |
| Median | 129 | 229.1 | 180 | ||
| Range | 64–812.6 | 65.6–615.4 | 148–272 | ||
Data are presented as mean ± SD, range, or frequency (%); *: significant as P < 0.05 represents the overall comparison among the three groups; the Kruskal-Wallis test was used for comparison among the three groups.
A significant difference in synovitis was observed among the three groups, as shown in Table 4.
MSUS findings (synovitis) among the studied groups.
| MSUS findings (synovitis) among the studied groups. | Group 1 (n = 30): active RA patients | Group 2 (n = 30): inactive RA patients | Group 3 (n = 30): control group | Chi-square Test | P value | ||||
|---|---|---|---|---|---|---|---|---|---|
| N | % | N | % | N | % | ||||
| Synovitis | No | 10 | 33.3 | 0 | 0.0 | 27 | 90.0 | 13.469 | < 0.001* |
| Yes | 20 | 66.7 | 30 | 100.0 | 3 | 10.0 | |||
| Grade of synovitis | 1 | 20 | 100.0 | 4 | 13.3 | 3 | 100.0 | 35.081 | < 0.001* |
| 2 | 0 | 0.0 | 17 | 56.7 | - | - | |||
| 3 | 0 | 0.0 | 9 | 30.0 | - | - | |||
| Power Doppler | No | 30 | 100.0 | 26 | 86.7 | 3 | 100.0 | MC 4.286 | 0.038 |
| Yes | 0 | 0.0 | 4 | 13.3 | - | - | |||
| Affected joints | Wrist | 6 | 30.0 | 4 | 13.3 | 3 | 100.0 | MC 22.245 | < 0.001* |
| MCP | 9 | 45.0 | 8 | 26.7 | - | - | |||
| PIP | 3 | 15.0 | 5 | 16.7 | - | - | |||
| More than one | 2 | 10.0 | 13 | 43.3 | - | - | |||
| Side of synovitis | Right side | 3 | 15.0 | 0 | 0.0 | 2 | 66.7 | MC 16.596 | < 0.001* |
| Left side | 0 | 0.0 | 0 | 0.0 | 1 | 33.3 | |||
| Bilateral | 17 | 85.0 | 30 | 100.0 | - | - | |||
Data are presented as frequency (%); *: significant as P < 0.05 represents the overall comparison among the three groups; MC: Monte Carlo Exact Test was used for comparison among the three groups; MCP: metacarpophalangeal joint; MSUS: musculoskeletal ultrasonography; PIP: proximal interphalangeal joint.
Table 5 shows that SAA was significantly positively correlated with CRP, ESR, DAS28, calprotectin, and synovitis.
Correlation between serum amyloid A and different variables among the studied patients.
| Correlation between serum amyloid A and different variables among the studied patients | Serum amyloid A | |
|---|---|---|
| Hb | R | –0.199 |
| P | 0.060 | |
| PLT | R | –0.037 |
| P | 0.731 | |
| TLC | R | 0.179 |
| P | 0.091 | |
| CRP | R | 0.584 |
| P | < 0.001* | |
| ESR1 | R | 0.687 |
| P | < 0.001* | |
| ESR2 | R | 0.770 |
| P | < 0.001* | |
| Age | R | 0.003 |
| P | 0.980 | |
| (DAS28) ESR | R | 0.782 |
| P | < 0.001* | |
| Disease duration | R | 0.088 |
| P | 0.502 | |
| Serum calprotectin | R | 0.326 |
| P | 0.002* | |
| Synovitis | rs | 0.839 |
| P | < 0.001* | |
Data are presented as numbers. *: significant as P < 0.05; Hb: hemoglobin; PLT: platelets; TLC: total leucocyte count; CRP: C-reactive protein; ESR: erythrocyte sedimentation rate; (DAS28) ESR: Disease Activity Score 28 joint erythrocyte sedimentation rate; rs: Spearman correlation coefficient; R: Pearson correlation coefficient.
Table 6 shows that a statistically significant positive correlation was identified between serum calprotectin and ESR, DAS28, SAA, and synovitis.
Correlation between serum calprotectin and different variables among the studied patients.
| Correlation between serum calprotectin and different variables among the studied patients | Serum calprotectin | |
|---|---|---|
| Hb | R | –0.158 |
| P | 0.136 | |
| PLT | R | –0.003 |
| P | 0.979 | |
| TLC | R | 0.028 |
| P | 0.797 | |
| CRP | R | 0.205 |
| P | 0.052 | |
| ESR1 | R | 0.347 |
| P | < 0.001* | |
| ESR2 | R | 0.327 |
| P | 0.002* | |
| Age | R | –0.029 |
| P | 0.784 | |
| (DAS28) ESR | R | 0.311 |
| P | 0.016* | |
| Disease duration | R | 0.103 |
| P | 0.433 | |
| Serum amyloid A | R | 0.326 |
| P | 0.002* | |
| Synovitis | rs | 0.411 |
| P | < 0.001* | |
Data are presented as numbers. *: significant as P < 0.05; Hb: hemoglobin; PLT: platelets; TLC: total leucocyte count; CRP: C-reactive protein; ESR: erythrocyte sedimentation rate; (DAS28) ESR: Disease Activity Score 28 joint Erythrocyte Sedimentation Rate; rs: Spearman correlation coefficient; R: Pearson correlation coefficient.
Figure 1 illustrates the distribution of DAS28 ESR categories among the RA active and inactive groups.
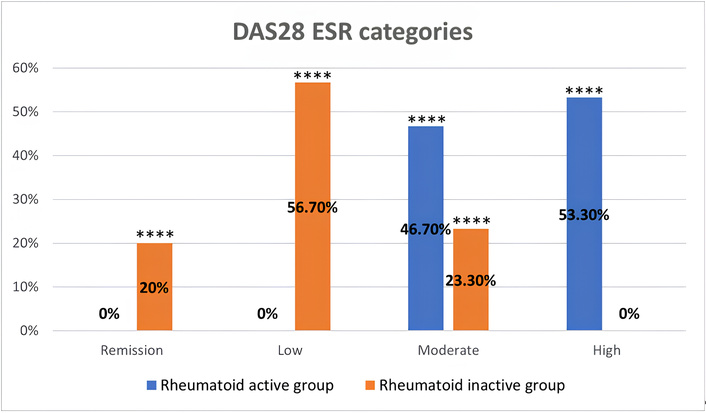
Distribution of DAS28 ESR categories among rheumatoid arthritis active and inactive groups. Data are presented as percentages of patients in each DAS28 ESR category (remission, low, moderate, and high disease activity), **** indicates a statistically significant difference between the two groups (P < 0.05). DAS28: Disease Activity Score 28; ESR: erythrocyte sedimentation rate.
Figure 2 shows examples of our MSUS findings in the RA groups and the control group.
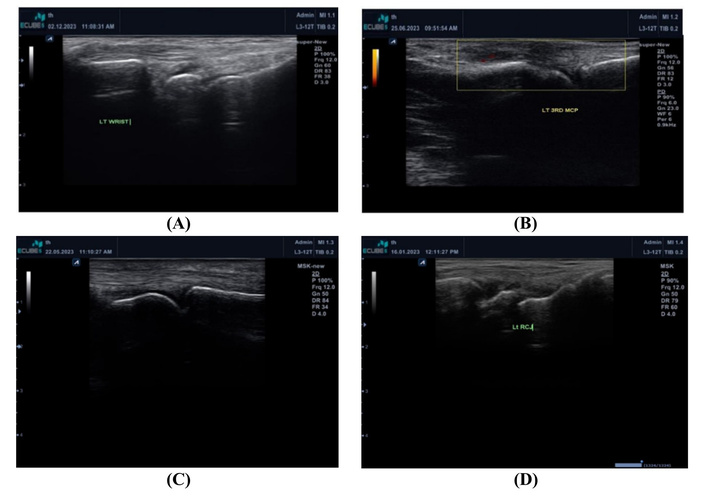
Examples of the MSUS findings in the RA groups and the control group. (A) Normal LT wrist in the control group; (B) Grade 2 synovitis in left 3rd MCP in a patient with power Doppler in RA active patient; (C) Grade 1 synovitis in LT 2nd PIP in a patient with inactive RA; (D) Grade 1 synovitis in LT wrist in the control group. Grade 1 synovitis was accepted especially in the dominant hand in the control group. LT: left; MCP: metacarpophalangeal joint; MSUS: musculoskeletal ultrasonography; PIP: proximal interphalangeal joint; RA: rheumatoid arthritis.
RA is a persistent autoimmune disorder marked by chronic joint inflammation and progressive joint damage [11].
Calprotectin contributes to processes such as cell differentiation, migration, apoptosis, and the generation of pro-inflammatory factors in RA [12].
In healthy individuals, SAA circulates at concentrations below 3 mg/L; however, its levels can surge, reaching up to a thousand times the normal level, within 24 hours in response to pro-inflammatory cytokines activated during the acute-phase reaction. This dynamic profile makes SAA a potentially more precise biomarker for assessing disease activity in RA [13].
Musculoskeletal ultrasound is a highly accurate imaging modality for detecting joint inflammation. PD selectively detects synovial blood flow, which reflects enhanced vascularization of the synovium, which allows for differentiation between active synovitis and mere synovial hypertrophy [14].
This study was conducted to evaluate the relationship between serum Calprotectin and SAA with musculoskeletal ultrasonographic findings in 60 RA patients compared with 30 control subjects.
This study was conducted on 90 subjects, including 60 RA patients divided into 30 patients with activity and 30 patients without activity, and 30 patients as a healthy control group. MSUS of the hands and wrists was examined, serum calprotectin and SAA were measured, and the three groups were compared.
Serum calprotectin and SAA were higher in group 2 than in group 1 and group 3. There was a significant positive correlation between SAA with ESR, CRP, DAS28 score, and synovitis. Also, serum calprotectin showed a significant correlation with ESR, DAS28 score, and synovitis.
In the current research, a statistically significant difference was observed among the study groups with respect to ESR and CRP levels, and this is in agreement with Shrivastava et al. [15], who found that the serum levels of inflammatory markers are elevated in most patients with RA as the disease is marked by chronic inflammation and synovial membrane hypertrophy. Joint inflammation occurs due to the release of growth factors, cytokines, and chemokines by various resident cells within the synovium and cartilage, along with infiltrating immune cells originating from the peripheral blood.
A comparative analysis of CRP levels among the study groups revealed a significant elevation in group 1 compared to both groups 2 and 3 and this is in agreement with Shrivastava et al. [15], as they revealed that CRP was increased in patients with RA, and Wang et al. [12] who demonstrated that CRP level was elevated in patients with greater disease activity.
Regarding serum RF levels (IU/mL), significant variation was observed between the 2 RA groups [16].
RF remains the most commonly utilized serologic marker in the detection of RA. In the 1987 classification criteria established by ACR, RF was identified as the sole serologic marker due to its high sensitivity. However, its diagnostic utility is limited by relatively low specificity, as RF can be detected in approximately 50% of patients with other connective tissue disorders—such as systemic lupus erythematosus, primary Sjögren’s syndrome, and dermatomyositis—as well as in certain infections and even among healthy elderly individuals [16].
The result of this work is in agreement with Knijff-Dutmer et al. [17], who demonstrated a considerable rise in RF in RA arthritis patients than control group. Also, RF, measured as a continuous variable, can be considered as a disease activity parameter in patients with RA.
In this study, anti-CCP was positive more in group 2 than in group 1, and this is in agreement with Serdaroğlu et al. [18], who support the hypothesis that RA patients who are positive for anti-CCP antibodies develop significantly greater radiographic joint damage compared to those who are anti-CCP negative.
Beyond its role in predicting radiological joint damage, anti-CCP has also been considered as a reliable indicator of disease activity. According to a study by Kastbom et al. [19], anti-CCP demonstrated greater predictive power than RF in assessing disease activity during the three years following the initial diagnosis of early RA.
In this study, SAA was higher in group 2 than in the control and group 1 (P < 0.001), and these results are consistent with the findings of Shen et al. [20], who reported a notable elevation in SAA levels among RA patients in comparison to both healthy controls and individuals with other diseases. Moreover, the strong correlation observed between SAA concentrations and DAS28 scores supports the role of SAA as a valuable marker for assessing RA activity.
Moreover, de Seny et al. [21] reported markedly increased plasma levels of SAA in patients with RA. The expression of SAA is strongly regulated by pro-inflammatory signaling cascades, particularly those mediated by IL-6 and IL-8. In response to acute-phase stimuli—such as inflammation or infection—SAA levels may surge up to 1,000-fold above normal concentrations.
This study demonstrated a significant positive correlation between SAA levels and clinical markers of inflammation, including CRP, ESR, the DAS28 score, serum calprotectin, and synovitis. These results are similar to those of Sorić Hosman et al. [22], who observed significantly elevated SAA levels in RA patients compared to healthy individuals. The increase in SAA concentration appears to correlate with disease severity, partly because SAA expression is characteristic of inflamed rheumatoid synovium, while normal synovial membranes do not exhibit such synthesis.
This local production promotes the secretion of pro-inflammatory cytokines, including TNFα, IL-1, IL-6, and IL-8, as well as chemokines, reactive oxygen species (ROS), and matrix metalloproteinases, which are involved in processes like cell proliferation, angiogenesis, invasion, and migration.
Consequently, SAA is implicated as a direct contributor to the processes of joint destruction and cartilage breakdown.
Additionally, SAA supports neutrophil survival and activates endothelial cells, further amplifying the inflammatory response by recruiting immune cells such as monocytes, leukocytes, and T lymphocytes, and increasing the production of cytokines, including TNFα, IL-1, IL-6, IL-8, and IL-17 [22].
The present research revealed a significant association between SAA levels and synovitis in RA patients, corroborating the findings of Hwang et al. [23], who reported a notable correlation between SAA and PD ultrasound (PDUS) scores. Notably, angiogenesis is recognized as a fundamental and early event in the pathogenesis of synovial inflammation in RA.
PDUS offers real-time visualization of vascular movement, allowing detection of increased microvascular perfusion associated with ongoing synovial inflammation in RA [24].
The association between SAA levels and PDUS findings may be attributed, at least in part, to the pro-angiogenic effect of SAA. Since PDUS detects newly developed blood vessels within inflamed synovial tissue, elevated SAA levels could reflect active vascular proliferation characteristic of RA.
In this study, serum calprotectin levels revealed a notable variation between the examined groups, with notably higher levels observed in group 2 compared to groups 1 and 3. Additionally, serum calprotectin was positively correlated with ESR, DAS28-ESR scores, SAA, and synovitis. These findings align with those of Wang et al. [12], who reported elevated calprotectin levels in RA patients in contrast to healthy individuals.
Calprotectin has the ability to stimulate cytokine secretion in macrophages and endothelial cells, modulate apoptosis in chondrocytes, and facilitate the differentiation of osteoclasts [12].
Plasma calprotectin levels were found to be strongly correlated with synovial fluid concentrations in individuals diagnosed with RA.
Both serum and synovial fluid calprotectin concentrations represent valuable indicators for diagnosing arthritis and predicting disease progression.
Comparable to other inflammatory markers like CRP and ESR, serum calprotectin levels have been shown to correlate with disease activity across a spectrum of inflammatory conditions, including sepsis, Kawasaki disease, psoriasis, and cystic fibrosis [25].
Hammer et al. [26] demonstrated that serum calprotectin levels are a more sensitive indicator of disease activity compared to routine clinical examination. Additionally, serum calprotectin levels showed a significant correlation with synovitis as assessed by ultrasound.
Inciarte-Mundo et al. [27] observed a significant association between serum calprotectin concentrations and ultrasound measures, proposing that calprotectin could be an effective marker for identifying PD activity in RA and psoriatic arthritis patients who are clinically in remission or have low disease activity.
Hurnakova et al. [5] identified a significant relationship between serum calprotectin concentrations and grayscale synovitis. Calprotectin exhibited a stronger association with both ultrasound parameters than CRP. Additionally, multiple regression analysis revealed that calprotectin serves as a more accurate predictor of PDUS synovitis compared to CRP.
The limitations of the current research include the small study population and the absence of longitudinal assessment to confirm the findings. Additionally, only the hands and wrists were examined, with no other joints assessed. Furthermore, SAA and serum calprotectin were not evaluated in synovial fluid, which could have provided beneficial insights into the pathogenic role of these markers in RA.
In conclusion, SAA and serum calprotectin can be used as markers of RA activity.
ACR: American College of Rheumatology
CCP: cyclic citrullinated peptide
CRP: C-reactive protein
DAS28: Disease Activity Score 28
ESR: erythrocyte sedimentation rate
IL-6: interleukin-6
MSUS: musculoskeletal ultrasonography
PD: power Doppler
PDUS: power Doppler ultrasound
RA: rheumatoid arthritis
RF: rheumatoid factor
SAA: serum amyloid A
SPSS: Statistical Package for Social Science
TNF: tumor necrosis factor
NMAEMS: Conceptualization, Formal analysis, Investigation, Writing—original draft. MTYG: Conceptualization, Writing—original draft. AAMS and ASEB: Methodology, Writing—review & editing, Supervision, Validation. TFM: Methodology, Formal analysis, Investigation, Writing—review & editing, Supervision, Validation. All authors read and approved the final manuscript.
The authors declare no conflicts of interest.
The study was approved by the Tanta University Hospitals Research Ethical Committee (Approval code: 36061/11/22). This study complies with the Declaration of Helsinki (2013).
Informed consent to participate in the study was obtained from all participants.
Not applicable.
The raw data supporting the conclusions of this manuscript will be made available by the authors, without undue reservation, to any qualified researcher.
Not applicable.
© The Author(s) 2026.
Open Exploration maintains a neutral stance on jurisdictional claims in published institutional affiliations and maps. All opinions expressed in this article are the personal views of the author(s) and do not represent the stance of the editorial team or the publisher.
Copyright: © The Author(s) 2026. This is an Open Access article licensed under a Creative Commons Attribution 4.0 International License (https://creativecommons.org/licenses/by/4.0/), which permits unrestricted use, sharing, adaptation, distribution and reproduction in any medium or format, for any purpose, even commercially, as long as you give appropriate credit to the original author(s) and the source, provide a link to the Creative Commons license, and indicate if changes were made.

View: 857
Download: 14
Times Cited: 0
