Original Article

Affiliation:
1Food Science and Technology Program, School of Industrial Technology, Faculty of Applied Sciences, Universiti Teknologi MARA, Shah Alam 40450, Malaysia
ORCID: https://orcid.org/0009-0007-5589-5453
Affiliation:
2Department of Food Technology, Institute of Food and Biotechnology, Can Tho University, Can Tho 94000, Vietnam
ORCID: https://orcid.org/0000-0002-6807-6867
Affiliation:
1Food Science and Technology Program, School of Industrial Technology, Faculty of Applied Sciences, Universiti Teknologi MARA, Shah Alam 40450, Malaysia
3Food Science Research Group, Faculty of Applied Sciences, Universiti Teknologi MARA, Shah Alam 40450, Malaysia
4Integrative Pharmacogenomics Institute (iPROMISE), Universiti Teknologi MARA, Bandar Puncak Alam 42300, Malaysia
5Integrated Nutrition Science and Therapy Research Group (INSPiRE), Faculty of Health Sciences, Universiti Teknologi MARA, Bandar Puncak Alam 42300, Malaysia
Email: ekseow@uitm.edu.my
ORCID: https://orcid.org/0000-0001-8913-0781
Explor Foods Foodomics. 2026;4:1010113 DOI: https://doi.org/10.37349/eff.2026.1010113
Received: November 06, 2025 Accepted: December 22, 2025 Published: February 09, 2026
Academic Editor: Carlo Bicchi, University of Torino, Italy
Aim: Mango kernel has potential as an alternative flour source to enhance the nutritional value of flatbreads, providing a cost-effective means of promoting healthier foods. This study aimed to determine the effects of mango kernel flour (MKF) incorporation on the physicochemical and sensory properties of balady flatbread.
Methods: Balady flatbreads were prepared with different substitution levels of MKF (0%, 25%, 50%, 75%, and 100%). The samples were analyzed for proximate composition, mineral content, color attributes, texture profile, specific volume, microstructure (via scanning electron microscopy), and sensory characteristics.
Results: Chemical analysis revealed that MKF substitution significantly increased fat (3.74–13.35%), ash (1.51–2.13%), crude fiber (0.32–2.93%), and energy (266.65–328.78 kcal/g) contents, while protein content remained unaffected. In contrast, moisture (36.34–29.37%) and carbohydrate (54.75–47.98%) contents decreased significantly. Increasing MKF levels also elevated potassium, iron, and magnesium contents. The specific volume decreased (3.48–0.70 mL/g), and texture hardness increased markedly (184.67–9,373.42 g). Scanning electron microscopy showed a more compact structure (pore size reduced from 69.07 to 42.30 μm) with darker and less yellow coloration as MKF substitution increased. Sensory evaluation by 50 panelists indicated that the control sample (100% wheat flour) received significantly higher scores for all evaluated attributes.
Conclusions: Increasing levels of MKF incorporation enhanced fat, fiber, ash, and mineral contents but reduced loaf volume, increased hardness, decreased pore size, and lowered sensory acceptability. Among the formulations tested, flatbread containing 25% MKF (FB2) was identified as the optimal formulation, offering improved nutritional properties with acceptable sensory quality. These findings highlight the potential application of MKF as a sustainable, value-added ingredient for developing nutrient-enriched flatbreads and other bakery products, contributing to food waste reduction and functional food innovation.
Flatbread, one of the most widely consumed staple foods across the globe, has undergone numerous modifications over time to improve its nutritional value and sensory appeal. In recent decades, there has been increasing interest in formulating flatbreads with alternative ingredients to diversify flavors, enhance nutritional profiles, and address specific dietary needs. One such promising ingredient is mango kernel flour (MKF), produced from the dried kernels of mango fruits. MKF represents a valuable byproduct of mango processing that is often discarded, despite being rich in bioactive compounds, dietary fiber, and other nutrients with potential health benefits [1]. Incorporating MKF into traditional flatbread formulations offers an opportunity to develop nutritionally enhanced and functionally improved bakery products.
Food waste has become a major global concern in recent years, coinciding with persistent malnutrition in many parts of the world. While millions suffer from inadequate access to nutritious food, large quantities of edible byproducts, such as fruit seeds and peels, are routinely discarded [2, 3]. In low-income and agriculture-based economies, valorizing such food processing byproducts could provide an affordable and sustainable source of nutrients. Mango kernels, which constitute a significant portion of mango waste, can be converted into flour and utilized in staple foods to improve dietary quality while reducing dependence on imported wheat flour (WF). The growing global demand for wheat, coupled with supply disruptions and rising prices, has further highlighted the need for alternative flour sources, particularly in developing nations [2].
Previous studies have explored the incorporation of MKF into bakery products such as biscuits and cakes; however, limited research has focused on its application in bread, and none has examined its use in balady flatbread, a traditional Egyptian staple [4]. The rising consumer interest in flatbreads and the need for affordable, nutritious, and sustainable food products underscore the importance of developing improved formulations. Incorporating MKF into balady flatbread could not only enhance its nutritional profile but also reduce production costs by utilizing a material that is otherwise treated as waste [1].
Balady flatbread was selected for this study due to its increasing global popularity as a nutritious, versatile, and minimally processed food [4]. Additionally, the fortification of flatbread with nutrient-rich ingredients aligns with current efforts to improve the nutritional quality of staple foods and meet the growing demand for plant-based and sustainable diets. The global flatbread market is projected to reach USD 62.8 billion by 2026, up from USD 41.17 billion in 2019, reflecting a steady annual growth driven by consumer interest in convenient and healthier food options [5].
Beyond its nutritional potential, the utilization of MKF in flatbread production supports sustainable food system practices by reducing agro-industrial waste and creating value-added opportunities for the mango processing industry. This approach can benefit farmers, processors, and other stakeholders in the mango supply chain, while also contributing to food security and circular economy initiatives [6].
Therefore, the objective of this study was to evaluate the effects of varying levels of MKF incorporation on the physicochemical and sensory properties of balady flatbread. The study aims to determine the potential of MKF as a functional ingredient that enhances the nutritional quality, texture, and consumer acceptability of flatbread while promoting sustainable food production practices.
The raw material used in this study consisted of seeds from ripe Susu mangoes (Thailand variety) obtained from a local market in Shah Alam, Malaysia. This variety was selected due to its ripening season, which extends from June to November. All mangoes were purchased from the same vendor to minimize variations in nutritional composition and ensure sample consistency.
The preparation of MKF was carried out following a modified method described by Nguyen et al. [7] with some modifications [8]. Ripe mangoes were first washed thoroughly and peeled, after which the pulp (mesocarp) was separated from the endocarp. The endocarp was then cracked open to extract the kernel. The kernels were washed and cleaned to remove any residual pulp or foreign materials. To reduce antinutritional factors, the kernels were soaked in water for 30 min, followed by boiling for 15 min. The boiled kernels were subsequently dried in a cabinet dryer at 60°C for 24 h. The dried kernels were then milled into flour and sieved through a 30-mesh standard sieve to obtain a fine, uniform powder. Figure 1 shows the mango kernel after boiling and before drying, and the milled MKF.
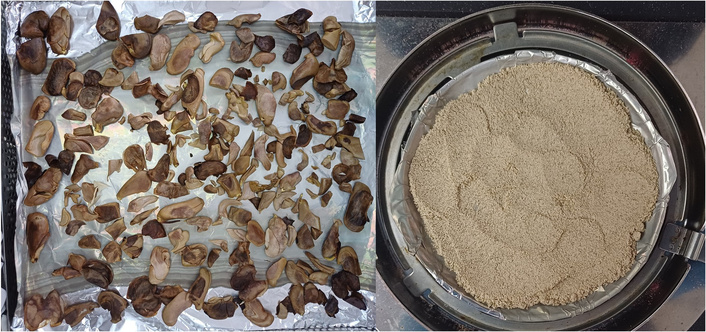
Mango kernel just before drying (left), and MKF after milling (right). MKF: mango kernel flour.
Balady flatbread was prepared following a modified method [4, 9, 10]. Five formulations were developed by substituting WF with MKF at 0%, 25%, 50%, 75%, and 100%, as shown in Table 1. The control formulation consisted of 100 g WF, 3.5 g palm oil, 6 g sugar, 1.5 g salt, 50 mL water, and 3 g yeast. Ingredients were mixed sequentially to form a homogeneous dough, which was fermented for 60 min at room temperature. The dough was divided into 85 g portions and proofed for an additional 40 min. Baking was conducted at 260°C for 8 min in an electric oven. The baked flatbreads were cooled to room temperature, packed in polyethylene bags, and stored for subsequent analyses.
The different formulations of balady flatbread with different levels of MKF and WF incorporated.
| Ingredients | FB1 | FB2 | FB3 | FB4 | FB5 |
|---|---|---|---|---|---|
| WF | 100 g | 75 g | 50 g | 25 g | - |
| MKF | - | 25 g | 50 g | 75 g | 100 g |
| Palm oil | 3.5 g | 3.5 g | 3.5 g | 3.5 g | 3.5 g |
| Sugar | 6 g | 6 g | 6 g | 6 g | 6 g |
| Salt | 2 g | 2 g | 2 g | 2 g | 2 g |
| Water | 50 mL | 50 mL | 50 mL | 50 mL | 50 mL |
| Yeast | 3 g | 3 g | 3 g | 3 g | 3 g |
FB1 = 100% WF, FB2 = 75% WF + 25% MKF, FB3 = 50% WF + 50% MKF, FB4 = 25% WF + 75% MKF, FB5 = 100% MKF. FB: flatbread; MKF: mango kernel flour; WF: wheat flour; -: not added.
The total fat content of the balady flatbread samples was determined using the Soxhlet extraction method in accordance with the Association of Official Analytical Chemist (AOAC) Official Method 948.22. All analyses were conducted in triplicate. Approximately 2 g of sample was wrapped in filter paper and secured to prevent sample loss, then placed in the Soxhlet extractor. Petroleum ether (180 mL) was used as the extraction solvent. The extraction was carried out for 8 h using an electrothermal extraction unit. After extraction, the solvent was evaporated on a steam bath until all residual petroleum ether was removed. The flasks were then dried in an oven at 105°C for 1 h, cooled in a desiccator, and weighed. The total fat content was calculated using the following equation:
The crude protein content of balady flatbread was determined using the Kjeldahl method according to AOAC Official Method 2001.11. Approximately 0.7 g of ground sample was placed in a digestion flask, followed by the addition of two catalyst tablets (containing 5 mg selenium and 5 mg potassium sulfate) and 25 mL concentrated sulfuric acid. The digestion unit was fitted with suction gaskets and operated at 200°C for 1 h, followed by 400°C for 3 h. After digestion, the samples were allowed to cool to room temperature. The volume of hydrochloric acid used during titration was recorded, and crude protein content was calculated using the following equation:
Where VS is the volume of acid used for sample titration, VB is the volume of acid used for blank titration, M is the molarity of standard acid, W is the weight of the sample, and F is the nitrogen-to-protein conversion factor.
The ash content of the balady flatbread was determined using the dry ashing method in accordance with AOAC Official Method 942.05. Porcelain crucibles were first dried in an oven at 105°C for 3 h, cooled in a desiccator to room temperature, and weighed to obtain a constant mass. Approximately 2 g of the dried sample was then placed in each crucible. The muffle furnace was preheated to 550°C, and samples were ashed at this temperature for 3 h until a whitish or greyish residue was obtained. The crucibles were subsequently cooled in a desiccator and reweighed after reaching room temperature.
The moisture content of the balady flatbread was determined according to AOAC Method 930.15. Aluminum dishes with covers were first dried in an oven at 105°C for 1 h, cooled in a desiccator to room temperature, and weighed. Approximately 5 g of the homogenized sample was placed in each dish and dried in an oven at 105°C for 3 h. After drying, the dishes were immediately covered, removed from the oven, cooled in a desiccator to room temperature, and reweighed. The moisture content (%) was calculated using the following equation:
The crude fiber content of the balady flatbread was determined according to AOAC Official Method 978.10. Approximately 2 g of dried sample was placed in a 500 mL beaker, and 200 mL of 0.255 N sulfuric acid was added. The mixture was boiled for 30 min from the onset of boiling. The contents were then filtered through a muslin cloth and washed with hot water until free from acid, as confirmed by blue litmus paper. The residue was transferred back into the original beaker and digested with 200 mL of 0.313 N sodium hydroxide, followed by boiling for another 30 min. Afterward, the contents were filtered again and washed with hot water. The residue was further washed twice with 15 mL of 1% hydrochloric acid and then repeatedly washed with hot water until acid-free. The insoluble material was transferred to a pre-dried and weighed crucible and oven-dried at 105°C for 3 h. The dried residue was cooled in a desiccator and weighed. The crucible was subsequently placed in a muffle furnace and ashed at 550°C for 3 h. After cooling in a desiccator, the crucible was reweighed to determine the crude fiber content.
The total carbohydrate (TC) content of the flatbreads was determined by difference, calculated from the subtraction of the sum of protein, fat, ash, moisture, and total fiber contents from 100%, according to the method described by Irshad et al. [11].
The total energy content of the flatbread was calculated by multiplying the amounts (in grams per 100 g sample) of carbohydrates, protein, crude fiber, and fat by their respective energy conversion factors: 4 kcal/g for carbohydrates, 4 kcal/g for protein, 2 kcal/g for crude fiber, and 9 kcal/g for fat. The total energy value was then obtained by summing all these components [12].
Where E is the energy, C is carbohydrate, P is protein, F is fat, and CF is crude fiber.
Mineral determination was carried out using inductively coupled plasma-optical emission spectrometry (ICP-OES) with a PerkinElmer Optima 2100 DV instrument. Sample digestion was performed using a microwave digestion system following the method described by Akin et al. [13]. Approximately 1 g of flatbread sample was weighed and placed into a Teflon digestion vessel, followed by the addition of 5 mL of 65% nitric acid and 2 mL of 30% hydrogen peroxide. The mixture was allowed to stand for 10 minutes before digestion. Microwave digestion was conducted in three steps: 170°C for 5 min, 190°C for 15 min, and 50°C for 10 min. The resulting clear solution was transferred into a 10 mL volumetric flask and diluted to volume with deionized water. The minerals analyzed included calcium, iron, manganese, zinc, potassium, magnesium, copper, and cadmium. The mineral content in the flatbread was calculated using the following equation.
Where C is mineral concentration measured by ICP-OES (ppm or mg/L), V is the final volume of digested and diluted sample (L), and W is the weight of the sample used for digestion (g).
Texture profile analysis (TPA) of the flatbreads was conducted using a TA.XT2i Texture Analyzer with 5 kg load cell as described by Dou et al. [14]. The parameters evaluated included hardness, springiness, cohesiveness, gumminess, chewiness, and resilience. The instrument was calibrated for force using a 2,000 g weight and for probe height with a P/75 compression plate. Test settings were: pre-test speed 1.0 mm/s, test speed 5.0 mm/s, post-test speed 5.0 mm/s, target distance 5 mm, and test time 5 s. Flatbread samples (5 cm × 5 cm) were placed under the probe, and TPA curves were recorded using Exponent software to calculate the texture parameters.
The specific volume of the flatbread was determined using the rapeseed displacement method according to AACC Method 10-05.01. A container large enough to hold the flatbread was first filled with rapeseeds until overflowing, and the surface was leveled using a ruler to determine the container’s total volume. The rapeseeds were then transferred to a graduated cylinder to record this volume. Each flatbread sample was weighed and placed in the container, which was then refilled with rapeseeds and leveled again. The displaced volume was measured, and the specific volume of the flatbread was calculated based on the difference between the two volumes.
The surface morphology of the flatbread was examined using a scanning electron microscopy (SEM), using the Hitachi TM3030Plus tabletop microscope. Sample preparation followed the method described by Palmkron et al. [15] and Fischer et al. [16], with slight modifications. The flatbread samples were first freeze-dried, and small surface fragments were carefully broken off and mounted on aluminum stubs using double-sided carbon tape. The mounted samples were then sputter-coated with a thin layer of gold to enhance conductivity.
For imaging, the SEM instrument was switched on, and the system was evacuated until the EVAC indicator showed stable vacuum conditions. The specimen stub was secured on the stage, and the sample height was adjusted to approximately 1 mm below the height gauge. Once the chamber reached the appropriate vacuum, imaging was performed under optimized observation conditions. Pore size measurements were conducted using the built-in measurement function of the microscope. The SEM software automatically applies a calibrated pixel-to-micrometer scale based on the selected magnification, enabling direct dimensional measurements on the micrographs. For each flatbread formulation, pore diameters were measured by manually selecting pore boundaries using the measurement tool at 300×. A minimum of three pores per sample was measured, and the average pore size was calculated for each formulation.
The color of the flatbread samples was determined following the method described by Koksel et al. [17]. A Konica Minolta CR-400 chromameter was used to measure the color parameters of lightness (L*), redness (a*), and yellowness (b*) of the crumb and crust. The sample was cut into 2 cm × 2 cm from the center of the flatbread. The crust region measured was the bottom part of the crust, and the crumb region measured is the inside of the flatbread. The light source of the chromameter is a D65, pulsed xenon lamp, with a 2° observation angle and a measurement aperture size of 8 mm. The chromameter was calibrated using a standard calibration white tile before measuring. The number of readings per type of flatbread is 3 from 3 different flatbread samples at the same position. Measurements were taken on both the crust and crumb portions of each flatbread sample to evaluate color uniformity.
Sensory evaluation was conducted with 50 untrained panelists to assess the taste, texture, aroma, color, appearance, and overall acceptability of the flatbread samples [18]. Each sample (2 cm × 2 cm) was coded using random digits and presented in white containers in a randomized order. Evaluations were performed using a 9-point hedonic scale (1 = dislike extremely, 9 = like extremely). Panelists rinsed their mouths with water before and between tastings. The sensory protocol was approved by the Ethics Committee of Universiti Teknologi MARA (Ref. No.: FERC/FSG/23/001) and in compliance with the Declaration of Helsinki (2013 revision).
The data were analyzed using Statistical Package Social Sciences (SPSS) version 26. One-way analysis of variance (ANOVA) and Tukey test were used to compare for any significant differences between samples. The mean and standard deviation were expressed as the values of different parameters. Differences were considered significant at p < 0.05. All analyses were carried out in triplicate.
The chemical composition of the balady flatbread samples was determined through proximate analysis, which included measurements of moisture, protein, fat, ash, and crude fiber contents. The carbohydrate content was calculated by difference, while the total energy value (per 100 g) was estimated based on the fat, carbohydrate, protein, and crude fiber contents. The proximate composition of the balady flatbread formulations is presented in Table 2.
Proximate composition of balady flatbreads.
| Parameter | FB1 | FB2 | FB3 | FB4 | FB5 |
|---|---|---|---|---|---|
| Moisture (%) | 36.34 ± 1.09a | 34.16 ± 0.10b | 32.44 ± 0.84bc | 31.28 ± 0.02cd | 29.37 ± 0.29d |
| Fat (%) | 3.74 ± 0.30d | 5.62 ± 0.24c | 7.94 ± 0.70b | 13.35 ± 0.30a | 12.14 ± 0.55a |
| Protein (%) | 3.82 ± 0.34a | 3.11 ± 0.07a | 3.02 ± 0.10a | 2.76 ± 0.01a | 3.69 ± 1.09a |
| Ash (%) | 1.51 ± 0.03d | 1.66 ± 0.02c | 1.73 ± 0.04c | 2.04 ± 0.02b | 2.13 ± 0.01a |
| Crude fiber (%) | 0.32 ± 0.12d | 0.57 ± 0.14d | 1.42 ± 0.30c | 2.46 ± 0.09b | 2.93 ± 0.11a |
| Carbohydrate (%) | 54.14 ± 1.54a | 54.75 ± 0.14a | 53.33 ± 0.23a | 47.98 ± 0.32b | 49.59 ± 1.41b |
| Energy (kcal/100 g) | 266.65 ± 4.75d | 283.65 ± 1.46c | 300.19 ± 6.78b | 328.56 ± 1.96a | 328.78 ± 1.55a |
Values expressed as mean ± SD of triplicate measurement. Values in the same row with different superscripts are significantly different at p < 0.05. FB1 = 100% WF, FB2 = 75% WF + 25% MKF, FB3 = 50% WF + 50% MKF, FB4 = 25% WF + 75% MKF, FB5 = 100% MKF. FB: flatbread; MKF: mango kernel flour; WF: wheat flour.
As shown in Table 2, the moisture content was highest in the control sample (FB1, 36.34%), followed by FB2 (34.16%), FB3 (32.44%), FB4 (31.28%), and FB5 (29.37%). All formulations were significantly different (p < 0.05) except FB3, which did not differ significantly from FB2, and FB4, which was not significantly different from FB5. Fat content increased significantly (p < 0.05) with higher levels of MKF substitution, ranging from 3.74% in FB1 to 13.35% in FB4. FB4 and FB5 (12.14%) were not significantly different (p > 0.05) from each other.
Protein content showed no significant differences (p > 0.05) among all formulations. However, ash content increased significantly (p < 0.05) with higher MKF incorporation, from 1.51% in FB1 to 2.13% in FB5. Similarly, crude fiber content increased progressively (p < 0.05) from 0.32% (FB1) to 2.93% (FB5), with all formulations differing significantly from each other. This indicates that MKF incorporation effectively enhanced the fiber content of the flatbread.
Carbohydrate content, determined by difference, showed no significant difference (p > 0.05) among FB1, FB2, and FB3, but these were significantly different (p < 0.05) from FB4 and FB5. The carbohydrate content decreased as MKF substitution increased. In contrast, total energy content increased with higher MKF substitution, with all formulations differing significantly (p < 0.05) except FB4 and FB5, which showed no significant difference (p > 0.05).
The mineral composition of the balady flatbread formulations, determined using ICP-OES, is presented in Table 3. The potassium content varied significantly (p < 0.05) among the formulations, except for FB2, which did not differ significantly (p > 0.05) from FB1 and FB3. The calcium content was detected only in FB1, FB2, and FB3, with all showing significant differences (p < 0.05) from one another. In contrast, magnesium was detected only in FB4 and FB5, and these two formulations differed significantly (p < 0.05) from each other.
Mineral composition of balady flatbread in mg/100 g.
| Mineral | FB1 | FB2 | FB3 | FB4 | FB5 |
|---|---|---|---|---|---|
| Potassium (mg/100 g) | 107.33 ± 0.58c | 99.67 ± 0.58cd | 95.00 ± 0.00d | 243.33 ± 2.08a | 223.67 ± 7.23b |
| Calcium (mg/100 g) | 89.00 ± 0.58a | 54.33 ± 0.58b | 30.67 ± 0.58c | ND | ND |
| Magnesium (mg/100 g) | ND | ND | ND | 24.33 ± 0.58a | 14.33 ± 4.62b |
| Manganese (mg/100 g) | 8.00 ± 0.00a | 8.00 ± 0.00a | 8.00 ± 0.00a | 9.00 ± 0.00a | 8.00 ± 0.00a |
| Iron (mg/100 g) | ND | ND | ND | 2.00 ± 0.00a | 3.33 ± 0.00a |
| Zinc (mg/100 g) | ND | ND | ND | ND | ND |
| Copper (mg/100 g) | ND | ND | ND | ND | ND |
| Cadmium (mg/100 g) | ND | ND | ND | ND | ND |
Values expressed as mean ± SD of triplicate measurement. Values in the same row with different superscripts are significantly different at p < 0.05. FB1 = 100% WF, FB2 = 75% WF + 25% MKF, FB3 = 50% WF + 50% MKF, FB4 = 25% WF + 75% MKF, FB5 = 100% MKF. FB: flatbread; MKF: mango kernel flour; ND: not detected; WF: wheat flour.
The manganese content did not differ significantly (p > 0.05) among all formulations. Iron was detected only in FB4 and FB5, but didn’t show a significant difference (p > 0.05) in their iron levels. Meanwhile, zinc, copper, and cadmium were not detected in any of the flatbread samples, as their concentrations were below the detection limit of the prepared standards (1–5 ppm).
As presented in Table 4, the hardness, gumminess, and chewiness of the flatbread increased, while springiness, cohesiveness, and resilience decreased with increasing MKF incorporation. The hardness values were significantly different (p < 0.05) among all formulations, with FB1 showing the lowest hardness (184.67 g) and FB5 the highest (9,373.42 g), followed by FB4 (7,754.51 g), FB3 (5,093.85 g), and FB2 (1,602.73 g). Similarly, gumminess increased significantly (p < 0.05) with higher MKF substitution, except between FB1 and FB2, which were not significantly different (p > 0.05). The gumminess values ranged from 177.04 g (FB1) to 7,404.32 g (FB5).
Texture profile analysis of the balady flatbread.
| Parameter | FB1 | FB2 | FB3 | FB4 | FB5 |
|---|---|---|---|---|---|
| Hardness (g) | 184.67 ± 8.72e | 1,602.73 ± 204.54d | 5,093.85 ± 207.85c | 7,754.51 ± 168.51b | 9,373.42 ± 533.87a |
| Springiness | 1.10 ± 0.02a | 0.92 ± 0.01b | 0.89 ± 0.079b | 0.88 ± 0.04b | 0.88 ± 0.01b |
| Cohesiveness | 0.96 ± 0.01a | 0.83 ± 0.05b | 0.79 ± 0.05b | 0.77 ± 0.03b | 0.71 ± 0.00b |
| Gumminess (g) | 177.04 ± 8.36d | 1,329.67 ± 325.80d | 3,916.15 ± 228.76c | 5,514.95 ± 198.50b | 7,404.32 ± 400.71a |
| Chewiness (g) | 194.50 ± 12.74d | 1,227.42 ± 192.76d | 3,484.78 ± 213.10c | 4,859.03 ± 265.04b | 6,513.89 ± 327.99a |
| Resilience | 0.68 ± 0.01a | 0.47 ± 0.06b | 0.43 ± 0.06b | 0.40 ± 0.01b | 0.46 ± 0.02b |
Values expressed as mean ± SD of triplicate measurement. Values in the same row with different superscripts are significantly different at p < 0.05. FB1 = 100% WF, FB2 = 75% WF + 25% MKF, FB3 = 50% WF + 50% MKF, FB4 = 25% WF + 75% MKF, FB5 = 100% MKF. FB: flatbread; MKF: mango kernel flour; WF: wheat flour.
The chewiness trend was consistent with gumminess, increasing from FB1 to FB5, and differences among formulations were statistically significant (p < 0.05) from FB2 to FB5, but not between FB1 and FB2. In contrast, springiness, cohesiveness, and resilience were significantly higher (p < 0.05) in FB1 compared to FB2–FB5, among which no significant differences (p > 0.05) were observed.
As shown in Table 5, the specific volume of the flatbread decreased with increasing levels of MKF substitution. FB1 exhibited the highest specific volume, followed by FB2, FB3, FB4, and FB5. All formulations were significantly different (p < 0.05) from each other, except FB3, FB4, and FB5, which showed no significant differences (p > 0.05).
Specific volume of the balady flatbread.
| Parameter | FB1 | FB2 | FB3 | FB4 | FB5 |
|---|---|---|---|---|---|
| Specific volume (mL/g) | 3.48 ± 0.01a | 1.20 ± 0.04b | 0.83 ± 0.03c | 0.72 ± 0.16c | 0.70 ± 0.07c |
Values expressed as mean ± SD of triplicate measurement. Values in the same row with different superscripts are significantly different at p < 0.05. FB1 = 100% WF, FB2 = 75% WF + 25% MKF, FB3 = 50% WF + 50% MKF, FB4 = 25% WF + 75% MKF, FB5 = 100% MKF. FB: flatbread; MKF: mango kernel flour; WF: wheat flour.
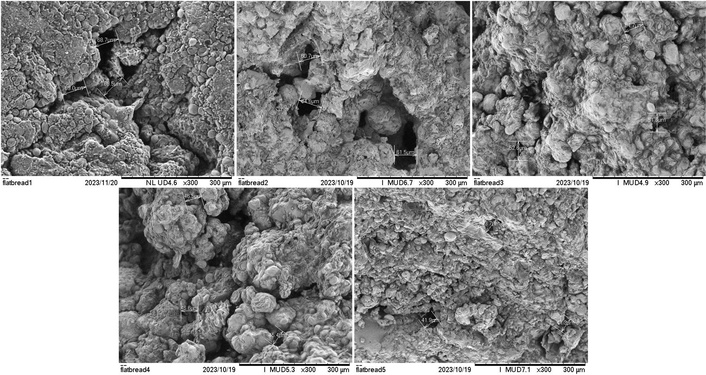
The SEM analysis was conducted to examine the microstructure and surface morphology of the flatbreads. Figure 2 presents the surface morphology and pore size measurements of the samples at 300× magnification. As shown in Figure 2 and Table 6, FB1 exhibited the largest pore size, followed by FB2, FB3, FB4, and FB5. The pore sizes were significantly different (p < 0.05) among the formulations.
Pore size of balady flatbread from scanning electron micrographs.
| Parameter | FB1 | FB2 | FB3 | FB4 | FB5 |
|---|---|---|---|---|---|
| Pore size at 300× magnification (μm) | 69.07 ± 0.01a | 62.27 ± 0.04b | 52.97 ± 0.03c | 46.17 ± 0.16d | 42.30 ± 0.07e |
Values expressed as mean ± SD of triplicate measurement. Values in the same row with different superscripts are significantly different at p < 0.05. FB1 = 100% WF, FB2 = 75% WF + 25% MKF, FB3 = 50% WF + 50% MKF, FB4 = 25% WF + 75% MKF, FB5 = 100% MKF. FB: flatbread; MKF: mango kernel flour; WF: wheat flour.
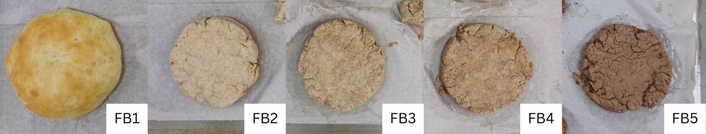
Table 7 presents the color parameters, L*, a*, and b*, of the flatbreads, while Figure 3 illustrates their physical appearance. The L* value indicates brightness (higher = lighter, lower = darker), a* value represents the red–green axis (higher = redder, lower = greener), and b* value corresponds to the yellow–blue axis (higher = yellower, lower = bluer).
Color attributes of the balady flatbread.
| Parameter | FB1 | FB2 | FB3 | FB4 | FB5 | |
|---|---|---|---|---|---|---|
| Crumb | L* | 61.61 ± 1.18a | 53.92 ± 0.08b | 51.60 ± 0.04c | 50.57 ± 0.61c | 46.44 ± 0.16d |
| a* | –0.91 ± 0.14c | 6.21 ± 0.08a | 6.10 ± 0.22a | 5.64 ± 0.09b | 6.32 ± 0.08a | |
| b* | 14.21 ± 0.77a | 9.89 ± 0.08b | 9.49 ± 0.11bc | 9.12 ± 0.09bc | 8.88 ± 0.13c | |
| Crust | L* | 58.52 ± 1.09a | 54.04 ± 0.04b | 49.66 ± 0.48c | 48.77 ± 0.65c | 44.63 ± 0.20d |
| a* | –0.65 ± 0.16c | 6.92 ± 0.02a | 6.25 ± 0.18b | 6.08 ± 0.13b | 5.94 ± 0.08b | |
| b* | 13.14 ± 0.72a | 11.83 ± 0.07b | 10.16 ± 0.25c | 9.95 ± 0.31c | 8.49 ± 0.26d | |
Values expressed as mean ± SD of triplicate measurement. Values in the same row with different superscripts are significantly different at p < 0.05. FB1 = 100% WF, FB2 = 75% WF + 25% MKF, FB3 = 50% WF + 50% MKF, FB4 = 25% WF + 75% MKF, FB5 = 100% MKF. FB: flatbread; MKF: mango kernel flour; WF: wheat flour.
Both crumb and crust lightness decreased with higher MKF substitution, where crumb L* values ranged from 61.61 (FB1) to 46.44 (FB5), and crust L* values from 58.52 (FB1) to 44.63 (FB5). The differences were significant (p < 0.05) except between FB3 and FB4. The a* values increased with more MKF, indicating a redder tone, with FB1 differing significantly (p < 0.05) from other formulations. For b* values, crust samples were all significantly different (p < 0.05), while in crumb samples, only FB1, FB2, and FB5 differed significantly (p < 0.05). From Figure 3, the FB1 appearance was golden brown and bigger. As more MKF substitutions were done, the color became darker and browner, and the flatbread became much smaller than the control variation.
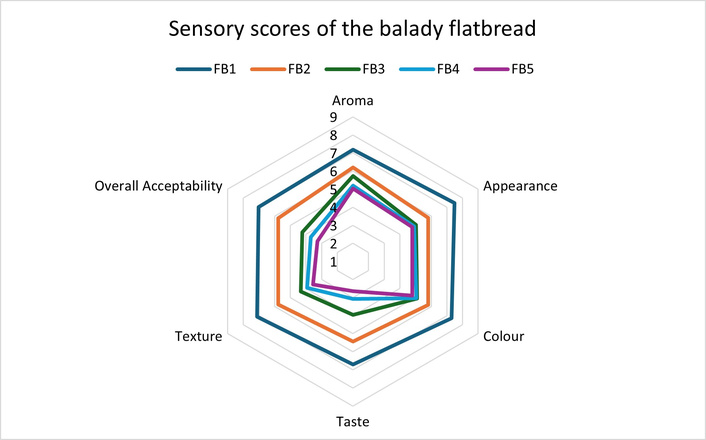
Table 8 and Figure 4 present the sensory evaluation results of the balady flatbreads as assessed by 50 panelists. For aroma, FB1 (7.18) received the highest score, followed by FB2 (6.20), FB3 (5.72), FB4 (5.20), and FB5 (5.04). FB1 and FB2 were significantly different (p < 0.05) from FB4 and FB5, which did not differ (p > 0.05), while FB3 differed significantly from FB1 but not from FB2.
Sensory scores of the balady flatbread.
| Parameter | FB1 | FB2 | FB3 | FB4 | FB5 |
|---|---|---|---|---|---|
| Aroma | 7.18 ± 1.19a | 6.20 ± 1.69b | 5.72 ± 1.67bc | 5.20 ± 1.73c | 5.04 ± 2.05c |
| Appearance | 7.48 ± 1.33a | 5.82 ± 1.62b | 5.04 ± 1.47bc | 4.90 ± 1.64c | 4.80 ± 1.94c |
| Color | 7.30 ± 1.09a | 5.82 ± 1.69b | 5.10 ± 1.73bc | 5.06 ± 1.86bc | 4.80 ± 1.98c |
| Taste | 6.70 ± 1.49a | 5.44 ± 2.05b | 3.96 ± 1.91c | 3.08 ± 1.66cd | 2.64 ± 1.63d |
| Texture | 7.12 ± 1.24a | 5.76 ± 1.92b | 4.34 ± 1.89c | 3.92 ± 1.87c | 3.56 ± 1.90c |
| Overall acceptability | 7.02 ± 1.20a | 5.78 ± 2.02b | 4.24 ± 1.78c | 3.68 ± 1.77cd | 3.26 ± 1.78d |
Values expressed as mean ± SD of triplicate measurement. Values in the same row with different superscripts are significantly different at p < 0.05. FB1 = 100% WF, FB2 = 75% WF + 25% MKF, FB3 = 50% WF + 50% MKF, FB4 = 25% WF + 75% MKF, FB5 = 100% MKF. FB: flatbread; MKF: mango kernel flour; WF: wheat flour.
A similar trend was observed for appearance, where FB1 was significantly different (p < 0.05) from all other formulations, and FB2 differed (p < 0.05) only from FB4 and FB5, which were not significantly different (p > 0.05) from each other. For color, FB1 (7.30) was significantly higher (p < 0.05) than FB2 (5.82), FB3 (5.10), FB4 (5.06), and FB5 (4.80). FB2 differed significantly from FB1 and FB5 (p < 0.05) but not from FB3 and FB4.
For taste, FB1 (6.70), FB2 (5.44), FB3 (3.96), and FB5 (2.64) all showed significant differences (p < 0.05). The texture scores showed that FB1 (7.12) and FB2 (5.76) were significantly higher (p < 0.05) than the other formulations. In terms of overall acceptability, FB1 (7.02), FB2 (5.78), FB3 (4.24), and FB5 (3.26) were all significantly different (p < 0.05) from each other.
The moisture content of the flatbreads decreased significantly with increasing incorporation of MKF, attributable to the lower inherent moisture in MKF compared to WF. Hasan et al. [19] reported their mango peel flour (MPF) containing 5.00% moisture, while Sharaf et al. [20] reported 9.42% moisture in MKF versus 11.79% and 12.40% in WF, where they are consistent with findings by Das et al. [8], who observed a significantly lower (p < 0.05) moisture in cakes containing 40% MKF substitution. Moreover, the moisture changes observed may be attributed to alterations in the dough and crumb microstructure after incorporating a fiber-rich, non-gluten flour. The diluted gluten network and the modified starch gelatinization likely reduce the crumb’s ability to retain water, causing some of the water absorbed during mixing to be more easily lost during baking [21]. Similar reductions in final moisture have been reported in breads and cakes formulated with mango kernel and other fiber-rich flours. Nkiru [22] observed that cakes made with 100% WF showed higher moisture content (33.25%) compared to cakes substituted with 2.5% and 5% MKF (27.20% and 26.36%, respectively). Likewise, Mala et al. [12] reported that control wheat crackers had the highest moisture (6.56%), whereas crackers substituted with dried pineapple peel powder, which was characterized by its higher crude fiber content, showed lower moisture levels (4.94% to 5.49%). Fat content increased proportionally with higher MKF levels due to its richer lipid composition. Sharaf et al. [20] reported that MKF contains 12.00% fat, compared to only 1.02% in WF, a trend also observed by Das et al. [8]. This higher fat content was the primary contributor to the increased energy value of flatbreads, as fat provides 9 kcal/g and represents the most energy-dense macronutrient. Additionally, Omada et al. [23] reported that bread with 75% MKF substitution contained higher crude fat (10.9%) than bread made with 100% WF (9.3%). Similarly, Yee and Mohamad [24] observed that increasing MKF substitution in pasta (2.5% to 7.5%) raised its fat content from 0.27% to 0.81%, compared to 0.18% in the WF control.
Protein content did not differ significantly (p > 0.05) among the formulations, although a slight decline was observed as more MKF was incorporated. This trend aligns with findings by Hussain et al. [25], who reported that increasing MKF in biscuit formulations reduced protein content (from 7.16% in 100% WF to 6.70% with 10% MKF). A similar pattern was noted by Thenabadu and Seneviratne [26], where WF muffins had higher protein levels (5.58%) than muffins with 30% MKF substitution (5.21%). The distinction in the present study is that the decrease in protein was not statistically significant, likely due to the larger standard deviation observed in FB5. The progressive increase in ash content with MKF substitution was consistent with its higher mineral residue (2.09%) relative to WF (0.61%) [20]. The higher ash content observed in the MKF-substituted balady flatbread is consistent with findings from Hussain et al. [25], who reported increased ash levels in biscuits containing 5% and 10% MKF (1.02% and 1.29%, respectively) compared to WF biscuits (0.75%). Likewise, crude fiber content increased significantly (p < 0.05) with MKF incorporation, reflecting its higher intrinsic fiber content (4.38%) relative to WF (0.88%) [20, 27]. Similar trends were reported by Nkiru [22], whose 2.5% MKF cake displayed higher fiber content (5.36%) than the WF control (3.76%), and by Yee and Mohamad [24], who found that MKF-enriched pasta (0.74–0.81%) also exceeded the fiber content of standard WF pasta (0.65%).
Because the crude fiber method used in this study does not account for soluble dietary fiber, the fiber values presented likely underestimate the true total dietary fiber content of the flatbread. Future work employing AOAC 991.43 or related enzymatic–gravimetric methods would yield a more accurate assessment. Carbohydrate content showed only slight variation, as WF generally contains marginally higher carbohydrate levels—reported at 72.20% and 72.51% by Sharaf et al. [20] and Hasan et al. [19] as compared to MKF, reported at 70.69% by Thenabadu and Seneviratne [26]. This may explain the non-significant decrease (p > 0.05) observed at lower substitution levels in the balady flatbread. In other MKF-based products, Omada et al. [23] reported lower carbohydrate content in cakes with 50% and 75% MKF substitution (55.9% and 50.0%) compared to WF cakes (59.5%). Meanwhile, Yee and Mohamad [24] found that pasta with 2.5% MKF substitution had slightly higher carbohydrates (38.53%), whereas 7.5% substitution resulted in slightly lower carbohydrates (33.71%) relative to WF pasta (35.66%), a pattern consistent with the trends observed in the balady flatbread at both low and high substitution levels.
Overall, the higher fat and fiber, together with lower moisture content, accounted for the increased energy value of flatbreads containing MKF. These findings demonstrate that MKF enhances the nutritional density of balady flatbread, contributing to higher energy and fiber contents while maintaining comparable protein levels [8, 23]. Although proximate analysis of the MKF used in this experiment was not conducted, previously published studies on MKF versus WF were included to provide context.
The significant increase (p < 0.05) in potassium content of the flatbreads was attributed to the substantially higher potassium concentration in MKF compared to WF. Potassium content in MKF was approximately 751.33 mg to 863.70 mg per 100 g, whereas WF contains only 154.00 mg per 100 g [20, 27]. Similarly, Omada et al. [23] reported that bread with 25% MKF substitution exhibited significantly higher (p < 0.05) potassium content (248.2 to 304.2 mg/100 g) compared to the control of WF bread (146.4 mg/100 g).
Calcium was not detected in FB4 and FB5, likely due to its low concentration in MKF (12.03 mg/100 g) relative to WF (11 to 196.00 mg/100 g) [20, 28]. In contrast, magnesium was detected only in the higher MKF substitution levels (FB4 and FB5), aligning with the substantially greater magnesium content of MKF (88.33 mg/100 g and 126.50 mg/100 g) compared to WF (40.34 mg/100 g) [20, 25]. Similarly, Hussain et al. [25] reported that biscuits containing 5% and 10% MKF had significantly higher magnesium levels (26.33 mg/100 g and 34.72 mg/100 g; p < 0.05) than the WF control (17.21 mg/100 g).
Manganese levels did not differ significantly (p > 0.05) across formulations, likely due to the comparable manganese contents of MKF (0.98 mg/100 g) and WF (0.94 mg/100 g) [29, 30]. The detection of iron only at higher substitution levels is also consistent with the markedly higher iron content of MKF (8.39 mg/100 g and 19.52 mg/100 g) relative to WF (3.14 mg/100 g) [20, 25]. Supporting this trend, Omada et al. [23] observed elevated iron levels in breads containing 50% and 75% MKF (1.96 mg/100 g and 4.11 mg/100 g) compared to WF bread (0.46 mg/100 g).
The observed increase in hardness, gumminess, and chewiness, along with the reduction in springiness, cohesiveness, and resilience, was likely attributed to the absence of gluten-forming proteins in MKF [31]. The soft texture of flatbread made with WF primarily results from gluten proteins, gliadin and glutenin, which interact upon hydration and mixing to form a viscoelastic gluten network. During dough development, hydrogen, van der Waals, and disulfide bonds form among these proteins, establishing the gluten matrix that traps carbon dioxide produced by yeast fermentation [32]. This entrapment creates air cells that contribute to the bread’s soft, elastic structure and ease of bite.
In contrast, MKF lacks gluten-forming proteins, and its incorporation disrupts the formation of the gluten network, leading to reduced gas retention and a denser crumb structure. Consequently, flatbreads with higher MKF substitution exhibited a more compact texture and greater hardness. The reduction in cohesiveness and resilience can be further explained by the absence of gliadin and glutenin, which respectively contribute to dough cohesiveness and elasticity in wheat-based formulations [32]. This is consistent with the findings of Dahdah et al. [31], who reported that increasing the substitution of WF with gluten-deficient olive pomace flour in bread formulations led to increased hardness, gumminess, and chewiness, i.e., characteristics also observed in balady flatbread.
The specific volume of the flatbread decreased with increasing MKF substitution, primarily due to the absence of gluten-forming proteins in MKF. Gluten from gliadin and glutenin in WF promotes gas retention during fermentation, enhancing expansion and loaf volume. Without sufficient gluten, gas escapes more readily, resulting in a denser product. Similar observations were reported by Das et al. [8] and Sharaf et al. [20], where increasing MKF in cake and cupcakes formulations reduced their specific volumes (from 2.85 to 3.14 mL/g and 2.76 to 3.35 mL/g, respectively), compared to the WF-only counterparts (3.38 mL/g and 3.54 mL/g).
SEM analysis supported this finding, showing smaller and fewer pores as MKF substitution increased. In WF-based flatbread, the gluten network traps carbon dioxide, forming an open and aerated structure, while MKF incorporation produced a compact and dense matrix [31].
This denser structure corresponded with higher hardness, gumminess, and chewiness, and lower springiness, cohesiveness, and resilience. The lack of gluten limited the formation of a viscoelastic protein network, reducing elasticity and lightness typically provided by gliadin and glutenin [33].
The decrease in L* and b* values and the increase in a* values with higher MKF substitution were attributed to the darker and redder color of MKF compared to WF. Thenabadu and Seneviratne [26] reported that muffins with the highest MKF substitution exhibited L*, a*, and b* values of 56.25, 9.30, and 23.43, respectively, compared to 78.22, 3.73, and 25.86 for WF muffins. Increasing MKF levels consistently produced muffins with lower L* and b* values and higher a* values than the WF control. Similarly, Sharaf et al. [20] observed that cupcakes containing MKF became progressively darker (L* 43.72 to 36.02), redder (a* 9.01 to 17.33), and less yellow (b* 28.47 to 21.42) as substitution increased.
The darker appearance of the flatbread at higher MKF levels can therefore be attributed primarily to the natural brown pigments and higher reducing sugar content of MKF, both of which promote intensified Maillard browning during baking. These factors collectively explain the reduction in lightness and yellowness and the increase in redness observed [19].
Sensory evaluation results further supported the instrumental findings. Panelists showed a clear preference for FB1 (control, 100% WF), which had the softest texture and lightest color. The lower acceptability of MKF-containing flatbreads was mainly due to their firmer texture and darker appearance. The absence of gluten led to reduced expansion and increased hardness, negatively affecting the perceived mouthfeel [32]. Additionally, the darker color of the MKF flatbreads correlated with lower L* and b* values, which may have reduced their visual appeal. The lower scores in taste and aroma were likely associated with the presence of tannins in MKF, which impart a mild bitterness and characteristic earthy aroma, absent in the control formulation [33]. Overall, the incorporation of MKF altered the physicochemical, structural, and sensory characteristics of balady flatbread, mainly due to the absence of gluten and the compositional differences between MKF and WF.
This study demonstrated that MKF substitution significantly influenced the chemical composition, mineral profile, physical properties, and sensory characteristics of balady flatbread. Among the formulations tested, 25% MKF substitution (FB2) achieved the optimal balance between nutritional enhancement and consumer acceptability. Higher substitution levels negatively affected texture and sensory attributes, likely due to reduced gluten content and the presence of tannins. These findings indicate that partial replacement of WF with MKF is a viable approach to producing nutritionally enriched flatbreads. Future research should explore the use of different mango varieties and optimized MKF processing to minimize tannin content, thereby improving palatability while maintaining the nutritional benefits. In addition, since mango kernel is a potential source of phenolics and bioactive compounds, future studies should incorporate antioxidant assays and phenolic profiling to more comprehensively evaluate the functional attributes of MKF in flatbread products.
AOAC: Association of Official Analytical Chemist
FB: flatbread
ICP-OES: inductively coupled plasma-optical emission spectrometry
MKF: mango kernel flour
MPF: mango peel flour
SEM: scanning electron microscopy
TPA: texture profile analysis
WF: wheat flour
The authors wish to thank the Faculty of Applied Sciences, Universiti Teknologi MARA, especially the laboratory assistants, for their excellent assistance in making this research a success.
HJ: Conceptualization, Formal analysis, Investigation, Methodology, Visualization, Writing—original draft, Writing—review & editing. THQ: Formal analysis, Writing—review & editing. EKS: Conceptualization, Methodology, Resources, Supervision, Validation, Writing—review & editing. All authors read and approved the submitted version.
The authors declare that they have no conflicts of interest.
The sensory evaluation study was approved by the Research Ethics Committee of Universiti Teknologi MARA (FERC/FSG/23/001) and in compliance with the Declaration of Helsinki (revision 2013).
Informed consent to participate in the study was obtained from all participants.
Informed consent to publication was obtained from relevant participants.
The data that support the findings of this study are available from the corresponding author upon reasonable request.
This research received no specific grant from any funding agency in the public, commercial, or not-for-profit sectors.
© The Author(s) 2026.
Open Exploration maintains a neutral stance on jurisdictional claims in published institutional affiliations and maps. All opinions expressed in this article are the personal views of the author(s) and do not represent the stance of the editorial team or the publisher.
Copyright: © The Author(s) 2026. This is an Open Access article licensed under a Creative Commons Attribution 4.0 International License (https://creativecommons.org/licenses/by/4.0/), which permits unrestricted use, sharing, adaptation, distribution and reproduction in any medium or format, for any purpose, even commercially, as long as you give appropriate credit to the original author(s) and the source, provide a link to the Creative Commons license, and indicate if changes were made.