Original Article

Affiliation:
1Nutrition and Dietetics Area, Colegio de San Juan de Letran, Manila 1002, Philippines
Email: melvin.bernardino@letran.edu.ph
ORCID: https://orcid.org/0000-0002-3625-6775
Affiliation:
2Engineering Area, Colegio de San Juan de Letran, Manila 1002, Philippines
Affiliation:
3Food Technology Area, Colegio de San Juan de Letran, Manila 1002, Philippines
Explor Foods Foodomics. 2026;4:1010110 DOI: https://doi.org/10.37349/eff.2026.1010110
Received: July 07, 2025 Accepted: January 08, 2026 Published: January 27, 2026
Academic Editor: Zuhaib F Bhat, SKUAST-Jammu, India
Aim: This study aims to investigate the enablers and barriers influencing the adoption of plant-based diets among Filipino adult consumers in Metro Manila.
Methods: A cross-sectional survey was conducted among Filipino adults responsible for household food decisions, particularly those with the capacity to purchase food or plan meals within their household, residing in Metro Manila. The questionnaire, adapted from validated instruments and guided by the COM-B behavioral model, assessed demographic characteristics, food consumption patterns, attitudes, and intentions toward plant-based diets. Data were collected via an online platform and analyzed using cluster segmentation, chi-square tests, and logistic regression to identify key determinants of dietary intentions and behaviors.
Results: Respondents were categorized into four food consumption clusters ranging from high meat-high plant, high meat-low plant, low meat-low plant, and low meat-high plant intake based on the food frequency consumption by applying the k-means clustering method. Monthly household income was significantly associated with food consumption patterns. Overall, 39.34% of participants intended to reduce meat consumption, while 54.10% aimed to increase plant-based food intake. Behavioral analysis revealed that psychological capability (knowledge of plant-based cooking) and reflective motivation (enjoyment of vegetarian dishes) significantly increased intentions to shift diets. Conversely, barriers included perceptions that plant-based meal preparation is time-consuming and satisfaction with reducing but not eliminating meat intake. Social opportunity factors showed mixed effects, with autonomy supporting dietary shifts, but social normalization of meat reduction potentially reducing individual motivation.
Conclusions: There is a growing intention among Filipino consumers to adopt plant-based diets, yet practical and perceptual barriers remain. Addressing these challenges through education, improving accessibility, and leveraging social influences is essential to facilitate dietary shifts. Economic factors, particularly income disparities, also influence food choices, highlighting the need for equitable policies. Supporting plant-based diets can advance public health, environmental sustainability, and climate resilience in the Philippine context.
Plant-based diets have recently gained increasing attention due to their lower environmental impacts and potential health benefits compared to animal-based foods [1, 2]. Plant-based diets are generally defined as diets consisting only or mostly of plant foods. Accordingly, they can encompass a wide variety of diets, including vegan, vegetarian, or even an omnivorous diet with small amounts of animal foods [3, 4]. An integrated and balanced plant-based dietary approach, which promotes both environmental sustainability and human health, is increasingly recognized as essential in guiding policy decisions for food system transformations [5].
Changing current dietary patterns to more sustainable ones is paramount to reduce the pressure that food systems exert on the planet and on people’s health and well-being. However, modifying consumers’ behavior is extremely challenging, as food choices are influenced by multiple factors, including personal, socioeconomic, cultural, and external determinants. At the national level, adopting healthy diets from sustainable food systems is a key strategy, complemented by measures to reduce food waste and improve productivity [6]. A shift towards sustainable consumption patterns is therefore critical to harmonizing global societal and environmental goals and ensuring that humanity can prosper sustainably and equitably in the coming years [7].
Climate change remains one of the most pressing global challenges of the 21st century [8, 9] with profound impacts on the agricultural industry [10]. These climatic disruptions shorten growing seasons, reduce crop yields, and intensify drought risks [11–14]. Furthermore, existing structural challenges such as limited capital, low income, and slow technology adoption compound the sector’s fragility under climate stress [15, 16]. Among the major contributors to climate change is the food system, particularly the consumption and production of animal-based foods [17]. Food production activities from farming to processing significantly contribute to greenhouse gas (GHG) emissions [18, 19], raising urgent concerns over the environmental sustainability of current dietary patterns. Despite growing awareness of the health risks associated with processed meats and dairy, a lack of understanding about the connection between meat consumption and climate change persists [20, 21], particularly in countries like the Philippines [17, 22]. Raising awareness can drive dietary shifts that align with climate goals [9].
Transitioning to plant-based diets offers a promising strategy for reducing environmental degradation, conserving resources, and promoting public health [23, 24]. Although such diets can reduce GHG emissions by up to 46%, depending on dietary patterns [9], the broader social and economic dimensions of this shift remain underexplored [25]. Plant-based diets are eating patterns that emphasize food items such as legumes, whole grains, vegetables, fruits, nuts, seeds, plant-based alternatives, and discourage most or all animal products [26]. This kind of eating pattern focuses on foods that are primarily from plants. A move toward more sustainable and health-oriented food systems is progressively recognized as essential to meeting global climate targets and enhancing adaptive capacity [27–30].
Literature has extensively documented the health, environmental, and economic benefits of a plant-based diet [26, 31–35]; there is a lack of focus on the behavioral and contextual factors influencing dietary transitions [36, 37]. Given these developments, this study aims to investigate the enablers and barriers to adopting a plant-based diet among selected Filipino adult consumers in Metro Manila, Philippines. By identifying these enablers and barriers, this study contributes to designing effective strategies that encourage sustainable dietary practices and support climate mitigation efforts at the consumer level.
This study utilized a cross-sectional design to investigate the enablers and barriers towards adopting a plant-based diet among selected Filipino adults in Metro Manila, Philippines. The use of a cross-sectional design was deemed appropriate as it enables the systematic collection and analysis of data at a single point in time, providing a comprehensive snapshot.
The research instrument was adapted from the study of Reipurth et al. [38] and van den Berg et al. [39]. It was designed to evaluate factors that facilitate or hinder the adoption of a plant-based diet and included items related to demographic characteristics, food consumption, and attitudes toward plant-based food consumption. The original instrument, evaluated by a food science and nutrition expert, was adapted to better suit the local context. The updated version was then tested for reliability. The reliability statistics yielded a Cronbach’s alpha of 0.85, indicating a high internal consistency of the items and suggesting that the questionnaire reliably measures the intended constructs. The study employed the Capability, Opportunity, and Motivation Behavior (COM-B) model [40] to guide the identification of consumers’ intentions toward shifting to a plant-based diet, focusing particularly on the role of attitudes as a key component influencing behavior change.
Participants in the study were selected based on specific inclusion and exclusion criteria. To be eligible, individuals had to be Filipino citizens residing in Metro Manila for at least one year. They also needed to be responsible for purchasing food or planning meals within their household and be at least 18 years of age. Both sexes were included to capture diverse perspectives. Individuals from various socioeconomic backgrounds and districts within Metro Manila were considered to reflect the heterogeneity of the urban population. Individuals who did not meet any of these inclusion criteria were excluded from the study. Demographic information, including age, sex, educational attainment, income level, and household size, was collected.
Data were collected using an online survey platform. A QR code linking to the survey was displayed in major markets and grocery stores within the study area to encourage participation. Participants were informed about the purpose of the study and gave their informed consent voluntarily. They were assured of their right to withdraw at any time and were encouraged to respond with honesty. The study upheld ethical standards related to anonymity and confidentiality. Personal identifiers were excluded from the data, and information collected was used solely for the purposes of this research. After completion of the study, all data were properly disposed of in accordance with ethical research practices. Incomplete survey responses were not included in the data analysis and were permanently deleted from the system to ensure data integrity and participant confidentiality.
Sociodemographic characteristics, including gender, age, educational attainment, household size, and monthly household income, were analyzed using frequencies and percentages. A chi-square test of independence was conducted to examine associations between sociodemographic variables and food consumption clusters, with a significance level set at p < 0.05. Additionally, segmentation of respondents into food consumption clusters was conducted using Python’s stats models module. Logistic regression analysis was performed to compute odds ratios (ORs), identifying the likelihood of belonging to specific consumption clusters based on demographic variables.
Respondents were segmented into food consumption clusters based on frequency of intake of red meat, white meat, fish, mollusks and crustaceans, fruits and vegetables, and grains and legumes by applying the k-means clustering method implemented using Python statsmodels module. The clustering resulted in four segments identified as (1) high meat-high plant cluster, (2) high meat-low plant cluster, (3) low meat-low plant cluster, and (4) low meat-high plant cluster. The segmentation of respondents into food consumption clusters and the median frequency of intake of red meat, white meat, fish, mollusks and crustaceans, fruits and vegetables, and grains and legumes are presented in Table 1.
Food consumption clusters.
| Food consumption cluster | Food product consumption frequency* median | |||||
|---|---|---|---|---|---|---|
| Red meat | White meat | Fish | Mollusks and crustaceans | Fruits and vegetables | Grains and legumes | |
| High meat-high plant cluster | 5 | 5 | 5 | 3 | 6 | 6 |
| High meat-low plant cluster | 4 | 4 | 4 | 2 | 4 | 4 |
| Low meat-low plant cluster | 3 | 3 | 2 | 2 | 3 | 3 |
| Low meat-high plant cluster | 4 | 4 | 4 | 2 | 5 | 6 |
*Food product consumption: 1 = never or about less than once a month, 2 = 1–3 times per month, 3 = once a week, 4 = 2–4 times a week, 5 = 5–7 times a week, 6 = 2–3 times a day, 7 = 4 or more times per day.
As visualized in the radar chart in Figure 1, the high meat-high plant cluster exhibited the most diverse and frequent consumption across all food categories, with median intake frequencies of 5–6 for meat, fish, fruits, and grains. This suggests a balanced but high-volume dietary pattern, potentially associated with higher caloric intake and broader food variety.
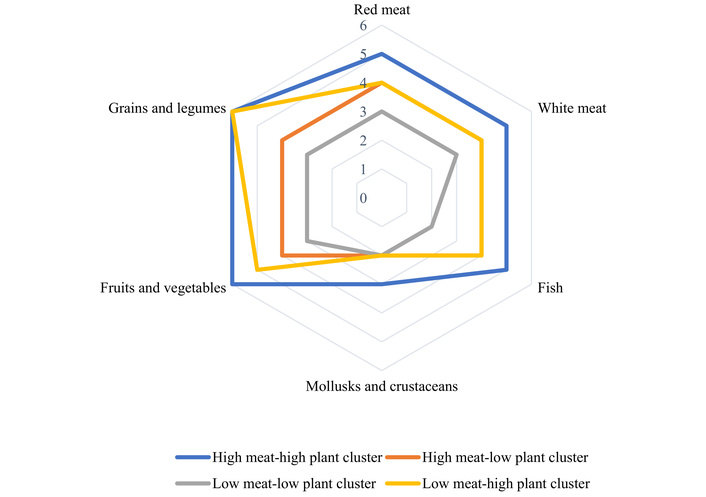
Dietary profile by food consumption cluster. Food product consumption: 1 = never or about less than once a month, 2 = 1–3 times per month, 3 = once a week, 4 = 2–4 times a week, 5 = 5–7 times a week, 6 = 2–3 times a day, 7 = 4 or more times per day.
The high meat-low plant cluster consumed moderate amounts of animal-based foods (median 4) but reported lower intake of plant-based items (median 4 or less), indicating a meat-centered dietary profile with reduced fiber and micronutrient diversity. In contrast, the low meat-low plant cluster reported the lowest overall consumption frequencies across all food categories (medians 2–3), which may reflect minimal dietary variety intake patterns.
The low meat-high plant cluster stood out for its higher consumption of plant-based foods—particularly grains and legumes (median = 6) and fruits and vegetables (median = 5)—despite moderate intake of animal proteins. This cluster aligns closely with plant-forward, suggesting a shift toward healthier or more sustainable eating patterns.
Sociodemographic characteristics—gender, age, educational attainment, household size, and monthly household income—were analyzed with frequencies and percentages for the total sample and by food consumption clusters, and the results of the chi-square test of independence are presented in Table 2. According to the result, food consumption has no significant association with gender, age, educational attainment, location, or household size. However, there is a significant association between monthly household income and food consumption, χ2(18, N = 427) = 31.40, p = 0.03.
Sociodemographic profile of the sample by food consumption groups.
| Sociodemographic | n | % | Food consumption cluster n (%) | Chi-square test | |||
|---|---|---|---|---|---|---|---|
| High meat-high plant | High meat-low plant | Low meat-low plant | Low meat-high plant | ||||
| N | 427 | 100 | 67 (15.69) | 130 (30.44) | 109 (25.53) | 121 (28.34) | |
| Gender | |||||||
| Male | 151 | 35.36 | 28 (18.54) | 45 (29.80) | 39 (25.83) | 39 (25.83) | χ2 = 1.77; p = 0.62 |
| Female | 276 | 64.64 | 39 (14.13) | 85 (30.80) | 70 (25.36) | 82 (29.71) | |
| Age | |||||||
| 18 to 25 years old | 298 | 69.79 | 49 (16.44) | 82 (27.52) | 77 (25.84) | 90 (30.20) | χ2 = 6.24; p = 0.40 |
| 26 to 30 years old | 67 | 15.69 | 11 (16.42) | 24 (35.82) | 14 (20.90) | 18 (26.87) | |
| 31 years old and above | 62 | 14.52 | 7 (11.29) | 24 (38.71) | 18 (29.03) | 13 (20.97) | |
| Educational attainment | |||||||
| Elementary graduate | 2 | 0.47 | 1 (50.00) | 1 (50.00) | 0 (0) | 0 (0) | χ2 = 31.18; p = 0.15 |
| Secondary undergraduate | 14 | 3.28 | 1 (7.14) | 3 (21.43) | 6 (42.86) | 4 (28.57) | |
| Secondary graduate | 31 | 7.26 | 5 (16.13) | 5 (16.13) | 9 (29.03) | 12 (38.71) | |
| College undergraduate | 211 | 49.41 | 40 (18.96) | 54 (25.59) | 55 (26.07) | 62 (29.38) | |
| College graduate | 135 | 31.62 | 12 (8.89) | 54 (40.00) | 33 (24.44) | 36 (26.67) | |
| Master’s degree units | 20 | 4.68 | 4 (20.00) | 9 (45.00) | 4 (20.00) | 3 (15.00) | |
| Master’s degree | 9 | 2.11 | 2 (22.22) | 3 (33.33) | 2 (22.22) | 2 (22.22) | |
| Doctoral degree units | 4 | 0.94 | 1 (25.00) | 1 (25.00) | 0 (0.00) | 2 (50.00) | |
| Doctoral degree | 1 | 0.23 | 1 (100.00) | 0 (0.00) | 0 (0.00) | 0 (0.00) | |
| Household size | |||||||
| Single (1 person) | 49 | 11.48 | 6 (12.24) | 15 (30.61) | 17 (34.69) | 11 (22.45) | χ2 = 7.26; p = 0.61 |
| Couple (2 persons) | 25 | 5.85 | 3 (12.00) | 7 (28.00) | 7 (28.00) | 8 (32.00) | |
| 3 to 4 persons | 139 | 32.55 | 20 (14.39) | 49 (35.25) | 28 (20.14) | 42 (30.22) | |
| More than 5 persons | 214 | 50.12 | 38 (17.76) | 59 (27.57) | 57 (26.64) | 60 (28.04) | |
| Monthly household income | |||||||
| Less than Php 11,000 | 69 | 16.16 | 10 (14.49) | 13 (18.84) | 25 (36.23) | 21 (30.43) | χ2= 31.40; p = 0.03* |
| Php 11,001–22,000 | 91 | 21.31 | 14 (15.38) | 34 (37.36) | 21 (23.08) | 22 (24.18) | |
| Php 22,001–44,000 | 119 | 27.87 | 14 (11.76) | 40 (33.61) | 33 (27.73) | 32 (26.89) | |
| Php 44,001–75,000 | 68 | 15.93 | 12 (17.65) | 16 (23.53) | 16 (23.53) | 24 (35.29) | |
| Php 75,001–130,000 | 45 | 10.54 | 7 (15.56) | 19 (42.22) | 7 (15.56) | 12 (26.67) | |
| Php 130,001–220,000 | 20 | 4.68 | 3 (15.00) | 5 (25.00) | 7 (35.00) | 5 (25.00) | |
| More than Php 220,001 | 15 | 3.51 | 7 (46.67) | 3 (20.00) | 0 (0.00) | 5 (33.33) | |
*: Significant at α = 0.05.
The study sample comprised 427 participants, of whom 64.64% were female, and 35.36% were male. The age distribution was predominantly skewed toward younger adults, with 69.79% of participants aged 18–25 years. Regarding educational attainment, nearly half of the sample were college undergraduates (49.41%), followed by college graduates (31.62%). Household composition varied, with approximately 50% of participants residing in households of more than five members.
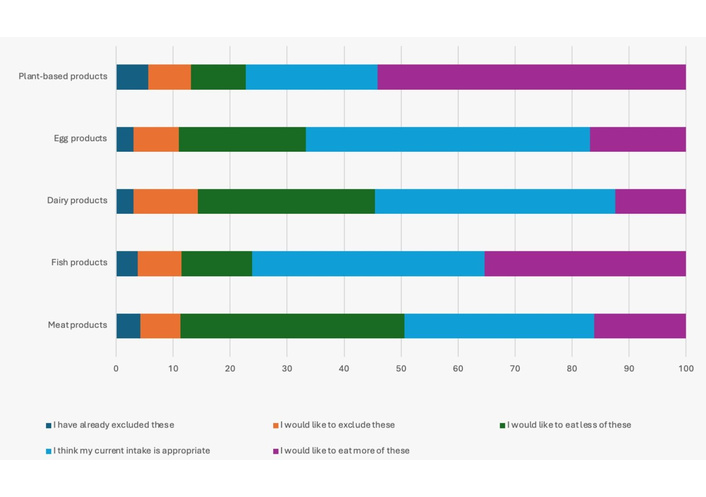
Participant intentions towards diet change were analyzed for the total sample and by food consumption cluster using percentages and frequencies. The results of the frequency and percentage analysis of intentions toward diet change, both overall and by food cluster, are presented in Table 3, while Figure 2 provides a visual summary of the overall data.
Intentions towards a diet change.
| Food clusters | Intentions toward a diet change n (%) | ||||
|---|---|---|---|---|---|
| I have already excluded these | I would like to exclude these | I would like to eat less of these | I think my current intake is appropriate | I would like to eat more of these | |
| All | |||||
| Meat products | 18 (4.22) | 30 (7.03) | 168 (39.34) | 142 (33.26) | 69 (16.16) |
| Fish products | 16 (3.75) | 33 (7.73) | 53 (12.41) | 174 (40.75) | 151 (35.36) |
| Dairy products | 13 (3.04) | 48 (11.24) | 133 (31.15) | 180 (42.15) | 53 (12.41) |
| Egg products | 13 (3.04) | 34 (7.96) | 95 (22.25) | 213 (49.88) | 72 (16.86) |
| Plant-based products | 24 (5.62) | 32 (7.49) | 41 (9.60) | 99 (23.19) | 231 (54.10) |
| High meat-high plant | |||||
| Meat products | 3 (4.48) | 2 (2.99) | 21 (31.34) | 27 (40.30) | 14 (20.90) |
| Fish products | 1 (1.49) | 2 (2.99) | 9 (13.43) | 34 (50.75) | 21 (31.34) |
| Dairy products | 2 (2.99) | 6 (8.96) | 18 (26.87) | 31 (46.27) | 10 (14.93) |
| Egg products | 2 (2.99) | 7 (10.45) | 9 (13.43) | 37 (55.22) | 12 (17.91) |
| Plant-based products | 3 (4.48) | 2 (2.99) | 4 (5.97) | 22 (32.84) | 36 (53.73) |
| High meat-low plant | |||||
| Meat products | 5 (3.85) | 9 (6.92) | 49 (37.69) | 47 (36.15) | 20 (15.38) |
| Fish products | 4 (3.08) | 9 (6.92) | 14 (10.77) | 50 (38.46) | 53 (40.77) |
| Dairy products | 3 (2.31) | 11 (8.46) | 37 (28.46) | 62 (47.69) | 17 (13.08) |
| Egg products | 2 (1.54) | 6 (4.62) | 27 (20.77) | 72 (55.38) | 23 (17.69) |
| Plant-based products | 9 (6.92) | 3 (2.31) | 12 (9.23) | 30 (23.08) | 76 (58.46) |
| Low meat-low plant | |||||
| Meat products | 7 (6.42) | 11 (10.09) | 41 (37.61) | 28 (25.69) | 22 (20.18) |
| Fish products | 9 (8.26) | 15 (13.76) | 19 (17.43) | 36 (33.03) | 30 (27.52) |
| Dairy products | 6 (5.50) | 15 (13.76) | 36 (33.03) | 35 (32.11) | 17 (15.60) |
| Egg products | 7 (6.42) | 12 (11.01) | 29 (26.61) | 38 (34.86) | 23 (21.10) |
| Plant-based products | 10 (9.17) | 18 (16.51) | 18 (16.51) | 25 (22.94) | 38 (34.86) |
| Low meat-high plant | |||||
| Meat products | 3 (2.48) | 8 (6.61) | 57 (47.11) | 40 (33.06) | 13 (10.74) |
| Fish products | 2 (1.65) | 7 (5.79) | 11 (9.09) | 54 (44.63) | 47 (38.84) |
| Dairy products | 2 (1.65) | 16 (13.22) | 42 (34.71) | 52 (42.98) | 9 (7.44) |
| Egg products | 2 (1.65) | 9 (7.44) | 30 (24.79) | 66 (54.55) | 14 (11.57) |
| Plant-based products | 2 (1.65) | 9 (7.44) | 7 (5.79) | 22 (18.18) | 81 (66.94) |
Overall, the most common intention for meat products was to reduce intake, with 39.34% of respondents indicating they would like to eat less meat. Conversely, the most common intention for plant products or plant-based foods was to increase intake (54.10%), while the majority considered their fish, dairy, and egg consumption to be appropriate. Differences emerged when comparing dietary clusters. In the high meat-high plant cluster, most participants (40.30%) felt their meat intake was appropriate, and only 31.34% expressed a desire to reduce it. A large proportion also wanted to eat more plant products or plant-based foods (53.73%). The high meat-low plant group showed similar trends, though a slightly smaller portion (15.38%) wanted to increase meat intake, and 58.46% wished to eat more plant products or plant-based foods, despite lower baseline consumption. The low meat-low plant cluster reported the highest proportion of people wanting to reduce meat intake (37.61%) and the highest share wanting to reduce fish (17.43%) and dairy (33.03%). Notably, this cluster also had the largest share wanting to exclude certain foods entirely, particularly fish and plant products or plant-based foods. The low meat-high plant group had the highest percentage of respondents wanting to reduce meat intake (47.11%) and the highest intention to increase plant products or plant-based foods (66.94%), reflecting a strong inclination toward a more plant-based dietary pattern.
ORs of belonging to the food consumption clusters were determined using logistic regression. The dependent variable was the food consumption cluster, while the independent variable was the intention towards diet change for each food product category. For each food consumption cluster, a confidence interval (CI) of the OR was calculated. A higher OR value indicates that respondents who have higher intentions to exclude or reduce the food product category from their diet are more likely to belong to a particular cluster. A CI entirely above or below 1 indicates that 95% of the time, the OR is significant.
ORs of belonging to the food consumption clusters by intentions towards diet change are presented in Table 4. Those who have higher intentions to exclude or reduce their consumption of meat products have significantly low odds of belonging to the high meat-high plant cluster, OR = 0.69, 95% CI: 0.51–0.94, and the low meat-low plant cluster, OR = 0.74, 95% CI: 0.58–0.95. Those who have higher intentions to exclude or reduce their consumption of dairy products have significantly low odds of belonging to the low meat-low plant cluster, OR = 0.78, 95% CI: 0.61–1.00. Those who have higher intentions to exclude or reduce their consumption of plant-based food have significantly low odds of belonging to the low meat-high plant cluster, OR = 0.67, 95% CI: 0.52–0.86, and significantly high odds of belonging to the low meat-low plant cluster, OR = 1.39, 95% CI: 1.13–1.72.
Odds ratios of belonging to the clusters by intentions towards a diet change.
| Food product category | Odds ratio of belonging to the food consumption clusters** (95% confidence interval) | |||
|---|---|---|---|---|
| High meat-high plant | High meat-low plant | Low meat-high plant | Low meat-low plant | |
| Meat products | 0.69 (0.51–0.94)* | 1.09 (0.87–1.38) | 0.98 (0.77–1.24) | 0.74 (0.58–0.95)* |
| Fish products | 0.93 (0.67–1.29) | 0.96 (0.74–1.24) | 0.78 (0.59–1.02) | 1.26 (0.97–1.65) |
| Dairy products | 0.81 (0.60–1.10) | 0.85 (0.67–1.08) | 1.01 (0.79–1.28) | 0.78 (0.61–1.00)* |
| Egg products | 1.11 (0.77–1.60) | 0.82 (0.61–1.10) | 1.17 (0.87–1.59) | 0.75 (0.55–1.01) |
| Plant-based food | 0.83 (0.63–1.10) | 0.95 (0.77–1.17) | 0.67 (0.52–0.86)* | 1.39 (1.13–1.72)* |
*: Significant at α = 0.05 when the confidence interval is entirely above 1 or below 1; **: all clusters combined.
ORs of intention towards shifting to a plant-based diet were determined using logistic regression. The dependent variable was the intention to shift to a plant-based diet, while the independent variables were the statements of attitudes. A CI of the OR was calculated. A higher OR value indicates that respondents who agree with the statement are more likely to have an intention to shift to a plant-based diet. A CI entirely above or below 1 indicates that 95% of the time, the OR is significant.
Table 5 presents the ORs of individuals’ intentions to shift toward a plant-based diet, analyzed through the lens of the COM-B model. The findings provide important behavioral insights. Interestingly, individuals who find it easy to prepare meals with smaller meat portions (physical capability) have significantly lower odds of intending to shift to a plant-based diet (OR = 0.72, 95% CI: 0.53–0.97). This counterintuitive result may indicate that reducing meat intake alone might give individuals a sense of partial achievement, thereby reducing motivation dietary shift. Similarly, those who perceive that preparing plant-based meat alternatives (PBMAs) takes too much time (physical opportunity) are significantly less likely to intend a dietary shift (OR = 0.71, 95% CI: 0.53–0.95), emphasizing the practical barrier of time and effort in daily food preparation.
Odds ratios of intention towards shifting to a plant-based diet by attitudes [37].
| Categories | Attitudes | Odds ratio of shifting to a plant-based diet (95% confidence interval) |
|---|---|---|
| Automatic motivation | Eating meat is my habit. | 0.80 (0.59–1.07) |
| I enjoy a meal with more meat than a meal with a plant-based alternative of meat. | 1.00 (0.72–1.39) | |
| I enjoy a meal with a small portion of meat as much as a meal with a normal portion of meat. | 1.08 (0.78–1.49) | |
| I enjoy eating meat. | 0.91 (0.59–1.40) | |
| I feel guilty when eating meat. | 1.07 (0.83–1.39) | |
| I thoughtlessly add meat to my meals. | 1.09 (0.80–1.49) | |
| When meat is offered to me, I accept it. | 0.81 (0.55–1.18) | |
| Physical capability | I find it difficult to replace meat in a dish with plant-based alternatives. | 1.20 (0.88–1.65) |
| I find it easy to locate plant-based alternatives for meat at takeaways and delivery restaurants. | 1.06 (0.74–1.50) | |
| I find it easy to locate plant-based alternatives for meat in restaurants. | 0.98 (0.70–1.37) | |
| I find it easy to locate plant-based alternatives for meat in the stores. | 0.77 (0.56–1.05) | |
| I find it easy to prepare a meal with a smaller portion of meat than I am used to. | 0.72 (0.53–0.97)* | |
| It takes less time to prepare a meal without meat than to prepare a meal with meat. | 1.15 (0.89–1.48) | |
| Physical opportunity | It takes too much time to prepare a meal with a plant-based alternative of meat. | 0.71 (0.53–0.95)* |
| Plant-based alternatives of meat are more expensive than meat. | 0.87 (0.67–1.12) | |
| Restaurants offer satisfying plant-based alternatives for meat. | 0.96 (0.71–1.31) | |
| Takeaways and delivery restaurants offer satisfying plant-based alternatives for meat. | 1.15 (0.81–1.62) | |
| The canteen at work or school offers satisfying plant-based alternatives for meat. | 1.03 (0.78–1.37) | |
| The stores offer satisfying plant-based alternatives for meat. | 0.95 (0.68–1.33) | |
| Psychological capability | I do not become full from eating plant-based food. | 1.04 (0.81–1.33) |
| I do not get enough protein if I eat a more plant-based diet. | 0.88 (0.66–1.17) | |
| I find it hard to come up with a dish without meat. | 1.08 (0.82–1.41) | |
| I know how much meat I am allowed to eat according to the Filipino Food Guide Pyramid. | 0.83 (0.63–1.10) | |
| I know how to replace meat in a dish with a plant-based account. | 1.37 (1.04–1.80)* | |
| I know which consequences meat consumption has on the environment. | 1.21 (0.87–1.66) | |
| It is healthy to eat a plant-based diet. | 1.23 (0.89–1.70) | |
| Plant-based food tastes good. | 0.81 (0.55–1.20) | |
| Reflective motivation | A dish without meat lacks flavor. | 0.90 (0.65–1.24) |
| A meal without meat is not satisfying filling. | 1.00 (0.73–1.39) | |
| A plant-based alternative of meat is healthier than meat. | 0.96 (0.71–1.31) | |
| Animal welfare plays an important role in my decision whether to eat meat. | 1.22 (0.92–1.61) | |
| Eating meat is important to stay healthy. | 0.80 (0.54–1.19) | |
| I like trying vegetarian dishes. | 1.56 (1.14–2.14)* | |
| It is good for the environment to eat more plant-based. | 1.37 (0.94–2.00) | |
| It is natural to eat meat. | 0.96 (0.65–1.43) | |
| My decision whether to eat meat is mainly based on price. | 0.92 (0.71–1.20) | |
| My decision whether to eat meat mainly depends on what I enjoy eating. | 0.97 (0.71–1.34) | |
| My health plays an important role in my decision whether to eat meat. | 0.98 (0.71–1.35) | |
| The environment plays an important role in my decision whether to eat meat. | 0.89 (0.64–1.22) | |
| Social opportunity | Eating meat is part of my culture. | 1.35 (0.96–1.89) |
| I can decide for myself whether I eat meat or not. | 1.43 (1.03–1.99)* | |
| My colleagues/fellow students accept people who want to eat less meat. | 0.85 (0.60–1.22) | |
| My colleagues/fellow students find it important to eat meat. | 0.97 (0.69–1.37) | |
| My family finds it important to eat meat. | 1.22 (0.83–1.81) | |
| My family takes people who want to eat less meat into account. | 0.94 (0.70–1.25) | |
| My friends accept people who want to eat less meat. | 1.19 (0.85–1.68) | |
| My friends find it important to eat meat. | 0.99 (0.72–1.36) | |
| My household finds it important to eat meat. | 1.02 (0.68–1.52) | |
| My household takes people who want to eat less meat into account. | 0.79 (0.57–1.10) | |
| People in my environment eat less and less meat. | 0.73 (0.56–0.95)* |
*: Significant at α = 0.05 when the confidence interval of the odds ratio is entirely above 1 or below 1.
In contrast, psychological capability plays a facilitating role: individuals who know how to replace meat in dishes with plant-based alternatives have significantly higher odds of intending to shift (OR = 1.37, 95% CI: 1.04–1.80), highlighting the importance of cooking knowledge and food literacy. Similarly, reflective motivation, as seen in those who enjoy trying vegetarian dishes, increases the likelihood of a shift (OR = 1.56, 95% CI: 1.14–2.14), suggesting that openness to new food experiences is a key enabler.
The social opportunity yields mixed effects. Those who feel they can independently decide whether to eat meat have higher odds of shifting (OR = 1.43, 95% CI: 1.03–1.99), reflecting the role of autonomy in dietary change. However, those who perceive that people around them are eating less meat have lower odds of intending to shift (OR = 0.73, 95% CI: 0.56–0.95). This may point to social normalization of meat reduction, leading some individuals to feel less urgency or personal responsibility to change, suggesting a diffusion of accountability within social groups.
Monthly household income showed a significant association with food consumption clusters. This finding aligns with Guenther et al. (2005) [41], who revealed that sociodemographic factors broadly predict food choices, but contradicts their emphasis on multiple factors beyond income. Additionally, in the Philippine context, households experiencing food insecurity, often linked to low income, consume inadequate nutrients, supporting the relevance of income as a key determinant [42]. International evidence also corroborates this pattern, where the International Food Information Council [43] reported that in the United States, higher-income consumers are more likely to adopt plant-based alternatives, a trend also observed in India, where consumers with more financial flexibility are willing to pay a premium for plant-based products [44]. However, studies in Europe noted that consumers perceive plant-based products as too expensive, and price or income had no significant effect on purchasing decisions, suggesting regional variations in the impact of income [45]. In the Philippines, PBMAs generally have higher costs per gram of protein compared to traditional animal-based meats. This suggests that, despite the growing availability of PBMAs, affordability may remain a barrier to wider adoption. Income, therefore, becomes a significant determinant of consumption, as higher-income consumers are more able to access these products [46].
The economic theory of consumer choice may help explain this finding, where individuals maximize utility based on budget constraints; those with higher income can afford broader food choices, including healthier or alternative options. Additionally, according to Maslow’s hierarchy of needs, only when basic needs such as food security are met can individuals prioritize health, sustainability, or ethical food considerations in their food choices [47, 48]. The implication of this finding is twofold. For theory, it underscores the need to refine food choice models to account for income as a dominant factor, especially in low- to middle-income settings [49, 50]. For practice, it suggests that policies aimed at improving food consumption quality should prioritize income-based interventions, such as subsidies or social protection for low-income households, rather than solely focusing on awareness campaigns or education [51–53].
There is a general trend toward decreasing meat consumption and increasing plant-based food intake across different dietary clusters, though motivations and intentions vary depending on current eating patterns. The most common intention regarding meat was to reduce consumption, while for plant-based foods, it was to increase intake. This may signal a broader shift toward sustainable or health-driven dietary motivations. In contrast, most people viewed their consumption of fish, dairy, and eggs as appropriate.
Multiple factors contribute to the shift from animal-based to plant-based diets [54, 55]. Among the most prominent motivators are health considerations, as individuals often associate plant-based eating with a reduced risk of chronic diseases and improved overall well-being [56, 57]. The four food consumption clusters identified in this study have distinct nutritional and public health implications. The high meat-high plant cluster represents a relatively balanced diet, providing diverse nutrients from both animal and plant sources, though excessive meat intake may pose health risks depending on the type of meat. The high meat-low plant cluster is protein- and fat-heavy but low in fiber and phytochemicals, which could increase the risk of chronic diseases and lower overall diet quality. The low meat-low plant cluster reflects limited consumption of both animal and plant foods, potentially leading to nutrient deficiencies and inadequate energy or protein intake [58, 59]. The low meat-high plant cluster emphasizes plant-based foods, providing increased dietary fiber, essential micronutrients, and fermented vegetables that supply probiotics to support gut health and immune function [60]. This pattern may help reduce the risk of chronic diseases, although careful attention is required to ensure sufficient intake of protein, iron, and vitamin B12 [61].
Those who intend to reduce or avoid meat are less likely to belong to the high meat-high plant group or the low meat-low plant group. Likewise, participants who intend to eat less plant-based food are less likely to be in the high meat-high plant group but more likely to be in the low meat-low plant group. These results suggest that people’s intentions to change their intake of meat or plant-based foods are reflected in the types of dietary patterns they follow. Importantly, adopting a plant-based diet may help reduce the risk of malnutrition when such dietary changes are guided and supported by healthcare professionals, including primary care physicians and dietitians [62].
Environmental concerns are a key factor influencing dietary behaviors, driven by increasing awareness of the negative ecological consequences of animal agriculture. Meat production contributes significantly to GHG emissions, deforestation, excessive water use, and land degradation [63]. By reducing meat consumption and adopting plant-based diets, individuals can help mitigate these environmental impacts, supporting more sustainable food systems and reducing the overall ecological footprint of the population [64].
Furthermore, social influences, particularly peer pressure and the norms established within social networks, can significantly shape dietary decisions [65]. Gender differences have also been observed, with women generally more inclined to adopt plant-based diets, often due to heightened concern for personal health, ethics, and the environment. Lastly, political ideology, particularly liberal political orientation, has been linked to a greater likelihood of embracing plant-based eating, reflecting values aligned with environmentalism, animal rights, and social equity [66–70].
The current study identified several key enablers and barriers to adopting a plant-based diet. Among the barriers were: (1) individuals who find it easy to prepare meals with slightly less meat than usual, suggesting limited motivation to make a full shift (related to physical capability), and (2) individuals who perceive that preparing plant-based alternatives takes too much time, reflecting a lack of physical opportunity.
The difficulty of preparing plant-based meals may function as a barrier to the adoption of this diet [71]. This is due to the fact that people demand convenience in food preparation in order to reduce time and mental strain [72]. The findings of the current study are consistent with those of van den Berg et al. (2022) [39] on young Dutch adults, who also believe that preparing a meal with a plant-based alternative to meat is time-consuming. This is common among young Dutch adults who have high meat consumption. These patterns may also reflect broader social and cultural norms around typical meal composition, which could influence dietary choices and the degree of willingness to adopt plant-based alternatives. Similarly, a study conducted on Finnish adults aged 18 to 75 years old reveals that making a plant-based diet was not seen as a simple chore by many respondents [37]. Aside from difficulty in preparation, difficulty in finding the ingredients in stores, as they are not always available, is also one of the reasons why it is believed that it is inconvenient and time-consuming to switch to a plant-based diet [73].
On the other hand, several enablers were identified that support the shift toward a plant-based diet: (1) individuals who know how to substitute meat in a dish with plant-based alternatives (psychological capability), (2) those who enjoy trying vegetarian dishes (reflective motivation), (3) individuals who feel they can make independent decisions about whether or not to eat meat (social opportunity), and (4) those who perceive that people around them are eating less meat (social opportunity).
In the study by van den Berg et al. [39], knowledge of how to prepare meals using PBMAs was more common among vegetarians than among individuals with high meat consumption. While this skill represents a clear opportunity for promoting plant-based diets, it also highlights a barrier: among high meat consumers, the lack of knowledge and cooking skills related to plant-based meals can hinder dietary change. This gap in information and culinary ability has been identified in multiple studies as a significant obstacle to reducing meat intake. For example, regular meat consumers often cite lack of knowledge, limited cooking skills, and uncertainty about how to prepare plant-based meals as key barriers [36, 74–76].
The findings of the current study highlight a dynamic interplay between enablers and barriers to adopting a plant-based diet in the Philippine context. On the one hand, certain barriers limit the shift toward plant-based eating. The interaction between these factors suggests that while structural and behavioral barriers exist, such as convenience, habits, and limited motivation, these can be mitigated by enhancing skills, motivation, and supportive social environments. In the Philippine setting, where meat-centered meals are culturally prevalent, interventions that combine practical guidance on plant-based cooking with social encouragement and normalization of reduced meat consumption may effectively shift dietary behaviors. To the best of our knowledge, this study is the first to investigate the shift toward plant-based diets specifically among Filipino consumers, while also exploring the enablers and barriers affecting this change.
While this study offers valuable insights into the enablers and barriers to adopting a plant-based diet among Filipino adults in Metro Manila, it has several limitations. The use of a cross-sectional design restricts the ability to determine causality between attitudes and dietary behavior. The sample was limited to participants from Metro Manila, which may not reflect dietary practices in rural or other regional areas of the Philippines. Recruitment via QR codes in markets and grocery stores may have introduced sampling bias, favoring higher-income or more tech-savvy consumers. Potential confounding variables, such as religion, health conditions, or other lifestyle factors that could influence dietary choices, were not accounted for.
Despite these limitations, the study has notable strengths. It is one of the few to explore plant-based diet adoption in the Philippine context, using a structured framework to identify key influencing factors. Future studies should consider longitudinal approaches, include more diverse populations, and incorporate qualitative methods to gain deeper insight into behavioral drivers.
The study found that there is an increasing intention among Filipino adult consumers in Metro Manila to shift towards a plant-based diet. However, the barriers need to be addressed to facilitate a successful transition. Efforts in educating consumers about plant-based alternatives, in providing accessibility and convenient options, and in promoting social support for dietary changes could help facilitate the adoption of a plant-based diet.
Understanding the factors that influence dietary shifts toward plant-based eating is crucial for promoting healthier and more sustainable food systems. Income disparities significantly impact food choices, meaning low-income households often face barriers to accessing nutritious and environmentally friendly foods. Addressing these economic challenges through targeted subsidies or social support can improve food security for vulnerable populations. Encouraging plant-based diets also has positive implications for reducing the environmental footprint of food production, as meat production is a major contributor to GHG emissions, deforestation, and water use. Making plant-based foods more convenient and accessible can overcome practical barriers, helping more people adopt sustainable eating habits. Enhancing cooking skills and knowledge empowers individuals to prepare nutritious plant-based meals confidently. Social influences and shifting norms around meat consumption can accelerate societal acceptance of sustainable diets. By reducing reliance on animal-based foods, societies can mitigate climate change while promoting public health. Integrating sociodemographic factors into food policy ensures more equitable and effective interventions. Ultimately, supporting plant-based dietary transitions aligns with global goals to improve food security, protect the environment, and foster resilient communities.
CI: confidence interval
COM-B: Capability, Opportunity, and Motivation Behavior
GHG: greenhouse gas
ORs: odds ratios
PBMAs: plant-based meat alternatives
The authors gratefully acknowledge the College of Business and Administration and Accountancy (CBAA) and College of Engineering and Information Technology (CEIT) for the support and assistance they provided in the conduct of the study. During the preparation of this work, the authors used Grammarly and Chat-GPT for grammar checking and readability improvement. The authors reviewed the output carefully and take full responsibility for the final content of the manuscript.
MB: Conceptualization, Methodology, Data curation, Investigation, Formal analysis, Funding acquisition, Supervision, Writing—original draft, Writing—review & editing. AC: Conceptualization, Methodology, Data curation, Investigation, Formal analysis, Resources, Project administration, Funding acquisition, Supervision, Writing—original draft, Writing—review & editing. SMN: Data curation, Investigation, Resources, Project administration, Funding acquisition, Supervision. All authors read and approved the submitted version.
The authors declare that they have no conflicts of interest.
The ethical approval is waived by the Letran Research Publication Department as the study involves minimal risk to participants. The study was conducted in accordance with the Declaration of Helsinki of the World Medical Association, ensuring that all ethical principles for medical research involving human participants were strictly followed.
Participants’ rights, privacy, and confidentiality were protected throughout the study. Informed consent was obtained from all participants prior to data collection.
Informed consent to publication was obtained from relevant participants.
The raw data supporting the findings and conclusions of this study are available from the corresponding author upon reasonable request. Data will be provided without undue restriction to any qualified researcher for the purpose of academic, non-commercial research.
The conduct of the research study was made possible through the generous funding of the Research and Publication Department (RPD) of the Colegio de San Juan de Letran—Manila. The funders had no role in study design, data collection and analysis, decision to publish, or preparation of the manuscript.
© The Author(s) 2026.
Open Exploration maintains a neutral stance on jurisdictional claims in published institutional affiliations and maps. All opinions expressed in this article are the personal views of the author(s) and do not represent the stance of the editorial team or the publisher.
Copyright: © The Author(s) 2026. This is an Open Access article licensed under a Creative Commons Attribution 4.0 International License (https://creativecommons.org/licenses/by/4.0/), which permits unrestricted use, sharing, adaptation, distribution and reproduction in any medium or format, for any purpose, even commercially, as long as you give appropriate credit to the original author(s) and the source, provide a link to the Creative Commons license, and indicate if changes were made.