Original Article

Affiliation:
1Laboratory of Food Chemistry and Technology, Department of Chemical Engineering, University of Western Macedonia, Koila, 50100 Kozani, Greece
Email: pmitliagka@uowm.gr
ORCID: https://orcid.org/0000-0003-3145-5596
Affiliation:
1Laboratory of Food Chemistry and Technology, Department of Chemical Engineering, University of Western Macedonia, Koila, 50100 Kozani, Greece
Affiliation:
1Laboratory of Food Chemistry and Technology, Department of Chemical Engineering, University of Western Macedonia, Koila, 50100 Kozani, Greece
Affiliation:
1Laboratory of Food Chemistry and Technology, Department of Chemical Engineering, University of Western Macedonia, Koila, 50100 Kozani, Greece
Affiliation:
2Department of Agriculture, University of Western Macedonia, Terma Kontopoulou, 53100 Florina, Greece
ORCID: https://orcid.org/0000-0002-9902-8032
Affiliation:
2Department of Agriculture, University of Western Macedonia, Terma Kontopoulou, 53100 Florina, Greece
ORCID: https://orcid.org/0000-0002-0917-1151
Affiliation:
2Department of Agriculture, University of Western Macedonia, Terma Kontopoulou, 53100 Florina, Greece
Email: ekasapidou@uowm.gr
ORCID: https://orcid.org/0000-0003-2769-6063
Explor Foods Foodomics. 2026;4:1010108 DOI: https://doi.org/10.37349/eff.2026.1010108
Received: August 31, 2025 Accepted: December 30, 2025 Published: January 15, 2026
Academic Editor: Miguel Herrero, Institute of Food Science Research (CIAL-CSIC), Spain
Aim: This study aimed to evaluate and compare the antioxidant activity, phenolic and flavonoid content, proline, and protein levels of oak honeydew and oak honeydew-nectar honeys produced in Northwestern Greece, providing the first comparative compositional data for these honey types.
Methods: Thirty-four honey samples (16 oak honeydew and 18 oak honeydew-nectar) were collected from the region of Western Macedonia during the 2021–2022 harvest seasons. Total phenolic content (TPC), total flavonoid content (TFC), antioxidant activity (DPPH and FRAP assays), colour intensity (ABS450), and proline and protein contents were determined using spectrophotometric methods. Statistical analyses included independent-samples t-tests, Pearson correlation analysis, and multivariate techniques (PCA and hierarchical clustering) to assess variation and grouping patterns between honey types.
Results: Oak honeydew honey showed higher TPC (137.52 vs. 115.69 mg GAE/100 g), antioxidant activity (DPPH: 20.26 vs. 15.24% inhibition; FRAP: 53.25 vs. 41.26 μΜ TE/100 g), and colour intensity (ABS450: 802 vs. 623.3 mAU) compared with oak honeydew-nectar honey (P < 0.05). TFC (51.67 vs. 42.22 mg RUE/100 g), proline (965.62 vs. 1,095.68 mg/kg), and protein contents (0.24 vs. 0.27 mg/g) were similar between oak honeydew and oak honeydew-nectar honey, respectively, with no significant differences (P > 0.05). Correlation analysis revealed strong positive associations among antioxidant activity, colour intensity, and flavonoid content, while protein exhibited inverse correlations with antioxidant parameters in oak honeydew honey but positive ones in oak honeydew-nectar honey. PCA showed a clear differentiation trend between the two honey types.
Conclusions: Oak honeydew honey exhibited superior antioxidant capacity and phenolic content, reflecting a richer bioactive composition. These findings provide the first comparative insight into Greek oak honeys and highlight their practical significance for honey authentication, quality evaluation, and consumer awareness of honeydew honeys produced in Northwestern Greece.
Honey is a natural food product with a complex chemical composition that includes not only sugars but also a wide range of minor components such as minerals, free amino acids, proteins, vitamins, enzymes, organic acids, flavonoids, phenolic acids, and other phytochemicals [1]. The concentrations of these compounds are influenced by several factors, including the honey’s geographical origin, floral source, flowering stage, weather conditions, harvesting time, beekeeper handling practices, processing methods, and storage conditions [2–4].
Due to its diverse composition, honey is considered a functional food with numerous health-promoting properties [5]. Many of its constituents exhibit beneficial biological activities, such as antioxidant, anti-inflammatory, antibacterial, antiviral, and anti-ulcer effects [6]. In recent years, consumer preference has increasingly shifted toward honeydew honeys over nectar honeys, largely because of their enhanced functional attributes [7–9]. According to González-Paramás et al. [10], since the late 20th century, there has been growing consumer interest—especially in Central Europe—in honeys with a single botanical origin, particularly darker types such as oak honeydew. This increasing demand is driven not only by their unique sensory and physicochemical characteristics but also by their recognized health benefits. Furthermore, producing monofloral honeys allows beekeepers to better compete with inexpensive polyfloral honeys imported from other countries [11].
Oak honeydew honey is especially prized for its distinctive sensory profile, characterized by its dark amber colour, mild aroma, woody flavour, and notably slow crystallization—all of which contribute to its high market value [12]. It is regarded as one of the most reputable Greek honeys, with oak being among the most common botanical sources for monofloral honey production in Greece [13, 14]. Nevertheless, in Greek apiculture, it is common to produce honeys of mixed botanical origin, such as oak honeydew-blossom honey, as a result of natural foraging, in accordance with European honey legislation [15].
The therapeutic properties of honey are closely linked to its antioxidant activity, which is primarily attributed to its rich content of phenolic compounds—especially flavonoids—as well as minerals [7, 16]. These natural antioxidants have attracted increasing attention for their potential role in promoting human health. Phenolic compounds, which are secondary plant metabolites, represent one of the most important groups of bioactive substances found in honey. The main phenolic constituents in honey are flavonoids and phenolic acids [17], derived mainly from flower nectar and honeydew but also from other sources such as propolis and pollen transferred into the honey by bees [18]. Honey contains a diverse set of phenolic acids (e.g., gallic, caffeic, ferulic) and flavonoids (e.g., quercetin, rutin, chrysin), which vary depending on botanical origin and contribute to its antioxidant activity [19, 20]. Antioxidant capacity in honey is typically assessed through assays such as DPPH, FRAP, and ABTS, which measure radical scavenging ability or reducing power. Phenolics and flavonoids are generally the main contributors to this activity [21].
The colour intensity of honey, commonly quantified by absorbance at 450 nm (ABS450), serves as a reliable indicator of its bioactive potential. Darker honeys, which show higher ABS450 values, are usually richer in phenolic and flavonoid content, which correlates strongly with enhanced antioxidant activity. Numerous studies have reported significant associations between honey colour and antioxidant performance, particularly in darker honeys that contain pigments like melanoidins—compounds that contribute both to dark coloration and radical scavenging capability [22–24].
Proline, the predominant free amino acid in honey, is often used as a marker of total amino acid content and serves as an important quality indicator, reflecting the honey’s freshness and authenticity [8, 25]. In addition to its role in quality control, proline is also linked to antioxidant capacity, as studies have shown strong correlations between proline levels, phenolic content, and antioxidant assay results [25–28].
Although the composition and bioactivity of oak honeydew honey have been explored in several regions, there is currently a lack of data on naturally occurring blends of oak honeydew and nectar honeys, which are commonly produced in Greek apiculture due to natural foraging conditions. Moreover, no comparative studies have examined both oak honeydew and oak honeydew-nectar honeys in terms of their antioxidant properties and bioactive compound content. To our knowledge, this is the first comparative analysis of oak honeydew versus oak honeydew-nectar honeys from Northwestern Greece, a region where such blends are commonly produced.
Therefore, the primary objective of this study was to evaluate the content of phenolics, flavonoids, protein, and proline, as well as the antioxidant activity, in commercially available oak honeydew and oak honeydew-nectar honeys produced in the region of Western Macedonia, Greece. A secondary aim was to investigate potential relationships between antioxidant capacity and the contents of phenolics, flavonoids, protein, and proline.
All reagents used were of analytical grade and were employed without further purification. Folin-Ciocalteu reagent, gallic acid (C7H6O5), 2,2-diphenyl-1-picrylhydrazyl (DPPH, C18H12N5O6), ferric chloride (FeCl3), 2,4,6-tri(2-pyridyl)-1,3,5-triazine (TPTZ, C18H12N6·HCl), Trolox (6-hydroxy-2,5,7,8-tetramethylchroman-2-carboxylic acid, C14H18O4), and formic acid (HCOOH) were purchased from Sigma-Aldrich (St. Louis, MO, USA). Methanol (CH3OH), potassium acetate (CH3COOK), sodium acetate trihydrate (CH3COONa·3H2O), and ninhydrin (C9H6O4) were purchased from PanReac AppliChem (Barcelona, Spain). Sodium carbonate (Na2CO3), ethylene glycol monomethyl ether (CH3OCH2CH2OH), 2-propanol (C3H8O), and proline (C5H9NO2) were purchased from Chem-Lab NV (Zedelgem, Belgium). Aluminum trichloride (AlCl3) and bovine serum albumin (BSA, Albumin Fraction V, M ≈ 66,000 g/mol) were obtained from Carl Roth GmbH + Co. KG (Karlsruhe, Germany), and rutin trihydrate (C27H30O16·3H2O) from Alfa Aesar GmbH (Kandel, Germany). Glacial acetic acid (CH3COOH) was supplied by VWR Chemicals (Radnor, PA, USA). Methanol (CH3OH) and 2-propanol (C3H8O) were suitable for spectrophotometric UV/VIS analysis.
Honey samples were directly collected from professional beekeepers from the region of Western Macedonia during the 2021 and 2022 harvest seasons. A total of 34 honey samples were analyzed, comprising 16 oak honeydew honey and 18 oak honeydew-nectar honey samples. The honey samples were stored at –20°C until analyzed [11, 29], and prior to analysis, they were placed in a water bath and brought to room temperature (20°C) [30].
An aqueous solution of each honey was prepared to determine the total phenolic content (TPC), total flavonoid content (TFC), and antioxidant profile [31, 32]. Briefly, the samples were homogenized by hand with a glass stirrer. Following that, the sample (1 g) was mixed with 10 mL of distilled water in a 15 mL screw capped test tube. The tubes were placed in a bath sonicator (40°C, 60 Hz) (Transsonic 570/H, Elma Schmidbauer GmbH, Singen, Germany) for approximately 5 min until a clear solution was obtained [33, 34].
TPC was determined using the Folin-Ciocalteu micro-method described by Singleton et al. [35]. An aliquot (40 μL) of the honey aqueous solution was mixed with 200 μL of Folin-Ciocalteu reagent, 2.4 mL of distilled water, and 600 μL of sodium carbonate solution (Na2CO3, 20% w/v). The test tubes were vortexed and left in the dark at room temperature for 2 h. Absorbance was measured at 725 nm against a distilled-water blank. Quantification was based on a standard curve (y = 1.5806x – 0.0467, R² = 0.9891) prepared from gallic acid (C7H6O5) standard solutions (10–400 mg/L). Analyses were performed in triplicate, and results were expressed as mg gallic acid equivalents (GAE) per 100 g honey.
TFC was determined using the aluminum chloride colorimetric method described by Bhaigyabati et al. [36]. Briefly, 0.5 mL of the honey solution was mixed with 1.5 mL methanol (CH3OH), 100 μL aluminum chloride solution (AlCl3, 10% w/v), 100 μL potassium acetate solution (CH3COOK, 1 M), and 2.8 mL distilled water. The mixture was vortexed, and absorbance was recorded at 415 nm using a Helios Zeta UV/VIS spectrophotometer (Thermo Fisher Scientific Inc., Waltham, MA, USA). A blank was prepared identically, but replacing the AlCl3 solution with water. Rutin (C27H30O16·3H2O) was used for the calibration curve (y = 0.0028x + 0.0251, R² = 0.9963, concentrations 0–600 mg/L). Each sample was analyzed in triplicate, and results were expressed as mg rutin equivalents (RUE) per 100 g of honey.
Free radical scavenging activity of honey samples was measured with the DPPH (2,2-diphenyl-1-picrylhydrazyl, C18H12N5O6) method as described by Sánchez-Moreno et al. [37] with slight modifications. Briefly, 100 μL of the honey aqueous solution was vortex mixed with 3.9 mL of freshly made DPPH solution, prepared by diluting a 0.5 mM DPPH stock solution in methanol (CH3OH) to achieve an absorbance of 0.718 ± 0.005 before use. The contents of the tubes were incubated in the dark at room temperature for 30 min, and absorbance was measured at 517 nm using a Helios Zeta UV/VIS spectrophotometer (Thermo Fisher Scientific Inc., Waltham, MA, USA), after zeroing the instrument with methanol as the blank. The control consisted of methanol in place of the honey sample. Each sample was analyzed in triplicate, and the radical scavenging activity was calculated using the following equation:
where,
Acontrol = absorbance of the control;
Asample = absorbance of the sample.
The reducing power activity of honey samples was measured with the FRAP method, as described by Pulido et al. [38] with slight modifications. Briefly, 100 μL of the aqueous honey mixture was transferred to a glass test tube, and 2.9 mL of freshly made FRAP solution was added. FRAP solution was prepared by mixing 10 mL acetic acid-sodium acetate buffer solution (CH3COOH/CH3COONa, 0.3 M, pH 3.6), 1 mL of 0.02 M ferric chloride (FeCl3) solution, and 1 mL of 0.01 M TPTZ [2,4,6-tri(2-pyridyl)-1,3,5-triazine] acidified solution. The tubes were vortexed and incubated at 37°C for 10 min. Absorbance was measured at 593 nm against a blank (2.9 mL FRAP reagent and 100 μL distilled water) using a Helios Zeta UV/VIS spectrophotometer (Thermo Fisher Scientific Inc., Waltham, MA, USA). Trolox (6-hydroxy-2,5,7,8-tetramethylchroman-2-carboxylic acid, C14H18O4) was used as a standard for the calibration curve (y = 0.0015x + 0.0017 and R² = 0.9987 with the concentrations of the standard solutions ranging from 0–900 μΜ). Each sample was analyzed in triplicate, and the results were expressed as μM of Trolox equivalents (TE) per 100 g honey.
Honey samples were prepared by a modification of the method of Beretta et al. [24]. Briefly, honey samples were diluted to 50% (w/v) with warm water (45–50°C), placed in a sonicated bath for 5 min to dissolve any sugar crystals, and then centrifuged for 15 min to remove any particles. The absorbance of the supernatant was measured at 450 and 720 nm using a Helios Zeta UV/VIS spectrophotometer (Thermo Fisher Scientific Inc., Waltham, MA, USA), against a water blank. The net difference in absorbance readings between the two wavelengths was expressed in milli-absorbance units (mAU) to obtain the colour value. The analyses were performed in triplicate.
Determination of proline content was performed according to the Harmonised Methods of the International Honey Commission [39]. A 5% (w/v) aqueous stock honey solution was prepared. Subsequently, 0.5 mL of the honey solution was mixed with 1 mL of formic acid (HCOOH, 80%) and 1 mL of ninhydrin solution (C9H6O4, 3% w/v in ethylene glycol monomethyl ether, CH3OCH2CH2OH). The mixture was vortexed for 15 min, heated in a boiling water bath for 15 min, and then transferred to a water bath at 70°C for 10 min. After incubation, 5 mL of 2-propanol (C3H8O, 50% v/v in water) was added, and the mixture was allowed to cool to room temperature. Absorbance was measured at 510 nm, 45 min after removal from the 70°C bath. Distilled water was used as the blank, and a proline solution (C5H9NO2, 0.032 mg/mL) was used as the standard. The analysis was performed in triplicate, and results were expressed as mg proline per kg of honey, calculated according to the following equation:
where,
Es = absorbance of the sample solution;
Ea = absorbance of the proline standard solution;
E1 = mg proline taken for the standard solution;
E2 = weight of honey in grams;
80 = dilution factor.
The protein content was determined using the colorimetric protein assay kit PierceTM BCA Protein Assay Kits (Thermo Fisher Scientific, Rockford, Illinois, USA) [40]. Shortly, 0.5 g of a thoroughly homogenized honey sample was mixed well with 0.5 mL of water. Following that, 0.1 mL of the honey mixture was transferred to a screw capped test tube, and 2 mL of freshly prepared BCA (bicinchoninic acid, C14H10N2O8) reagent was added to each sample. BCA reagent was prepared according to the manufacturer’s instructions. The contents of the tubes were vortex mixed and placed in a water bath (37°C) for 30 min. Then, they were cooled at room temperature, and the absorbance was read against a blank (prepared with water instead of the sample) at 562 nm. Protein concentration was calculated from a standard curve (y = 1.2621x + 0.0358, R² = 0.9972) prepared using BSA (C293H452N80O90S) standards (0–1 mg/mL). The analysis was conducted in triplicate, and results were expressed as mg protein per g of honey.
Results are presented as mean values, standard deviation (SD), and range for each group. Differences between groups (oak honeydew and oak honeydew-nectar honeys) were assessed using an independent samples t-test and were considered statistically significant at P < 0.05 (two-tailed). Levene’s test was applied to examine the homogeneity of variances between the two groups. Pearson’s correlation analysis was conducted to identify relationships between the examined parameters, and correlation heatmaps were generated to visually represent the strength and direction of these associations. All statistical analyses were performed using IBM SPSS Statistics (version 29.0; IBM Corp., Armonk, NY, USA). Correlation heatmaps were created in Python 3.11 using the Seaborn (v0.12.2), Matplotlib (v3.7.1), and Pandas (v2.0.3) libraries.
Additionally, a multivariate approach was employed using R (version 4.4.2) to explore patterns within the dataset further. Principal Component Analysis (PCA) was performed on standardized variables (TPC, TFC, DPPH, FRAP, ABS450, proline, and protein) in order to reduce dimensionality and identify the significant sources of variation among samples. Hierarchical cluster analysis was conducted using Ward’s method and Euclidean distance to examine grouping tendencies between honey types. All graphical outputs (PCA score plots and dendrograms) were generated in R using the packages ggplot2, factoextra, and dendextend.
The study was carried out in the Regional Unit of Western Macedonia, Greece (Figure 1) in the years 2021 and 2022. The region of Western Macedonia is located in the Northwest part of Greece, bordering Albania to the west and North Macedonia to the north, and is the only Greek region not bordering the sea. It consists of the Regional Units of Grevena, Florina, Kastoria, and Kozani. It covers an area of 9,451 km2 (7.16% of the country’s total area), and comprises mostly mountainous and semi-mountainous land. The region is characterized by natural forests that form ecosystems defined by rich biodiversity, as well as pastures [41]. Beekeeping is a traditional and widespread activity in the region, contributing significantly to the local economy and rural livelihoods. Between 2013 and 2022, total honey production in the region of Western Macedonia increased by nearly 109%, rising from 253 tonnes in 2013 to 528 tonnes in 2022 [42]. However, data on the production volumes of the honey types examined in the present study are not available.
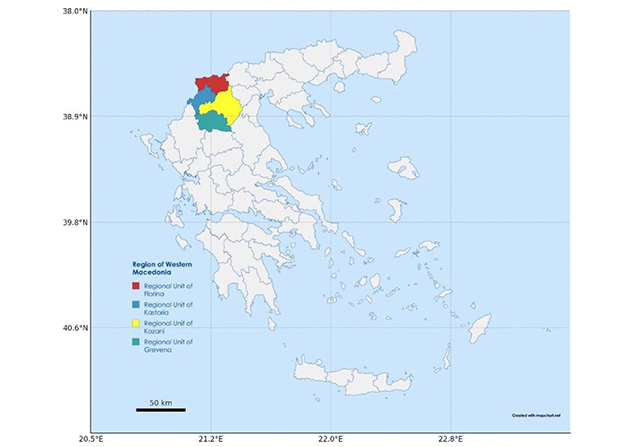
Location of the region of Western Macedonia and its four Regional Units in Greece. Created with https://www.mapchart.net/.
Table 1 presents information on the examined honey samples—oak honeydew and oak honeydew-nectar honey—classified by harvest year (2021 and 2022) and Regional Unit within Western Macedonia. Most oak honeydew honey samples, particularly in 2022, originated from the Regional Unit of Grevena, which accounted for six of the nine samples analyzed that year. In contrast, oak honeydew-nectar honey samples showed a more balanced distribution across the Regional Units and harvest years, with Grevena and Kozani consistently contributing multiple samples. This distribution reflects both regional production patterns and the availability of honey types during the collection periods in relation to the weather conditions.
Sampling information of examined samples in relation to harvest year and regional origin.
| Year | Regional Unit | |||
|---|---|---|---|---|
| Florina | Grevena | Kastoria | Kozani | |
| Oak honeydew honey | ||||
| 2021 | 1 | 4 | 2 | 0 |
| 2022 | 0 | 6 | 2 | 1 |
| Oak honeydew-nectar honey | ||||
| 2021 | 2 | 1 | 1 | 3 |
| 2022 | 3 | 4 | 1 | 3 |
Honey labeling relied entirely on the beekeeper’s declaration, reflecting real-world commercial practices. Samples were identified as pure oak honeydew or oak honeydew-nectar honeys, based on hive location information provided by the beekeepers, without melissopalynological verification. This approach is consistent with other studies where the floral origin was specified by beekeepers or attributed directly from the declared label [43, 44]. However, electrical conductivity (EC) (data not presented), considered the most useful quality parameter for the classification of unifloral honeys [45], was also taken into account to support the classification. In our samples, oak honeydew honeys exhibited a mean EC of 0.94 mS/cm, whereas oak-nectar blends averaged 0.67 mS/cm. These values are consistent with the European legislation, which recognizes EC values above 0.8 mS/cm as characteristic of honeydew honeys, while lower values are typical of blossom honeys [15]. While a common beekeeping practice in Greece is to identify a sample as oak honeydew honey when the honeydew component from oak exceeds 60% of the total composition, it is important to acknowledge the regulatory framework that officially guides honey classification. According to Greek legislation, the minimum percentage of the dominant pollen grain required to classify a honey as monofloral is 45% [46]. In general, the estimation of pollen content for determining the botanical origin of honey follows this classification: predominant pollen (> 45%), secondary pollen (16–45%), important minor pollen (3–15%), minor pollen (< 3%), and isolated pollen (approximately < 1%) [47]. In addition, a honey sample is classified as oak honeydew honey when it contains elements of oak honeydew and the proportion of Castanea sativa pollen grains is less than 87% [12]. As for oak honeydew-nectar honey samples, the nectar source was either sage, paliurus (Christ’s thorn), wild thyme, or acacia—either individually or in various combinations. The locations of the beehives used for honey collection are shown in Figure 2.
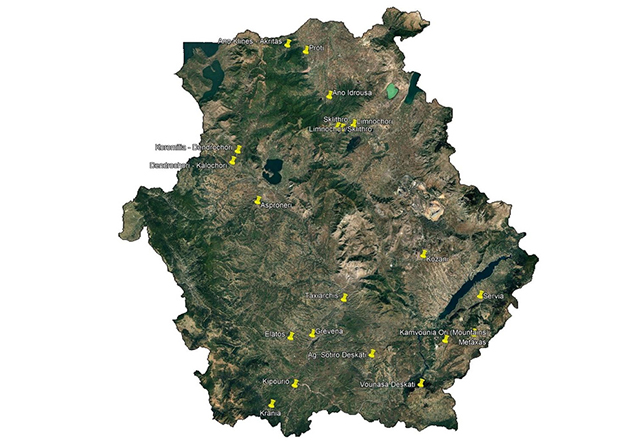
Location of bee hives in the region of Western Macedonia, Greece. The map was generated using Google Earth Pro (v7.3) with custom placemarks added by the authors. Base imagery: Google Earth—Imagery © Maxar Technologies; Map data © Google (accessed 2025).
The TPC and TFC of the examined samples are presented in Table 2. The oak honeydew honey samples exhibited significantly higher TPC values compared to the oak honeydew-nectar honey samples (P < 0.05). In contrast, no statistically significant (P > 0.05) difference was observed in TFC between the two honey types, although the oak honeydew honey showed higher mean TFC values than the oak honeydew-nectar honey. The variability within each honey type is reflected in the SDs and value ranges for both TPC and TFC, indicating notable differences even within the same honey category.
Total phenolic and flavonoid content of the honey samples (mean values, SD, and range).
| Honey type | TPC (mg GAE/100 g)1 | TFC (mg RUE/100 g)2 | ||||
|---|---|---|---|---|---|---|
| Mean | SD | Range | Mean | SD | Range | |
| Oak honeydew (n = 16) | 137.52 | 26.098 | 73.41–179.70 | 51.67 | 16.604 | 30.63–90.75 |
| Oak honeydew-nectar (n = 18) | 115.69 | 21.582 | 89.02–160.72 | 42.22 | 12.547 | 25.15–75.51 |
| Significance | * | NS | ||||
1: total phenolic content (TPC) expressed as mg of gallic acid equivalents (GAE)/100 g; 2: total flavonoid content (TFC) expressed as mg of rutin equivalents (RUE)/100 g; *: P < 0.05; NS: non-significant.
As shown in Table 3, both DPPH radical scavenging activity and FRAP values differed significantly between oak honeydew honeys and oak honeydew-nectar honey samples (P < 0.05). Oak honeydew exhibited higher mean values for both antioxidant activity measures. The SD and the range indicate variability within each group, but the overall trend shows that oak honeydew samples consistently demonstrated greater antioxidant potential compared to the oak honeydew-nectar honey samples, based on both DPPH and FRAP assays. The results indicate that the antioxidant capacity, as assessed by both methods, is significantly higher in oak honeydew honey samples than in the oak honeydew-nectar honey samples.
Antioxidant profile of the honey samples (mean values, SD, and range).
| Honey type | DPPH (%)1 | FRAP (μM TE/100 g)2 | ||||
|---|---|---|---|---|---|---|
| Mean | SD | Range | Mean | SD | Range | |
| Oak honeydew (n = 16) | 20.26 | 6.880 | 6.21–32.15 | 53.25 | 12.325 | 25.73–69.77 |
| Oak honeydew-nectar (n = 18) | 15.24 | 7.155 | 4.13–30.17 | 41.26 | 14.997 | 16.82–64.13 |
| Significance | * | * | ||||
1: free radical scavenging activity expressed as inhibition percentage; 2: ferric reducing antioxidant power expressed as μΜ of Trolox equivalents (TE)/100 g; *: P < 0.05.
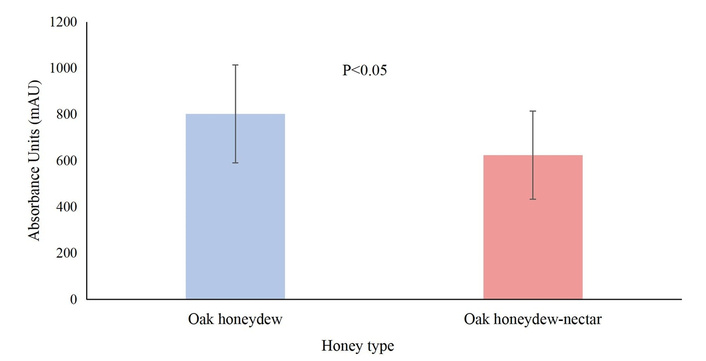
The colour intensity (ABS450) of the honey samples exhibited statistically significant differences (P < 0.05) between the oak honeydew honeys and the oak honeydew-nectar honeys. Specifically, oak honeydew honeys were notably darker compared to the oak honeydew-nectar honeys. In detail, the mean colour intensity of oak honeydew honey was 802 mAU, with values ranging from 358 to 1,187 mAU. In contrast, the oak honeydew-nectar samples showed a lower mean value of 623.3 mAU, ranging from 305 to 992 mAU (Figure 3). Indicative pictures of the two examined honey types, showing colour variations within each type, are presented in Figure 4.
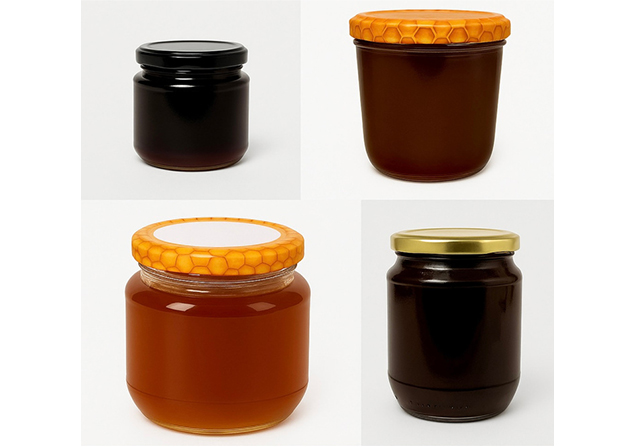
Representative images of the analyzed honey samples. Top row: oak honeydew honeys; bottom row: oak honeydew-nectar honeys.
Table 4 presents the proline and protein content of oak honeydew and oak honeydew-nectar honey samples. No statistically significant differences (P > 0.05) were observed between the two honey types for both examined parameters. The mean proline content was slightly higher in the oak honeydew-nectar honey samples compared to monovarietal oak honeydew honeys, but the difference was not statistically significant (P > 0.05). Both honey types exhibited relatively wide ranges in proline content, indicating variability within each group. The SDs were also comparable, indicating similar dispersion of values.
Proline and protein content (mean values, SD, and range).
| Honey type | Proline (mg/kg) | Protein (mg/g) | ||||
|---|---|---|---|---|---|---|
| Mean | SD | Range | Mean | SD | Range | |
| Oak honeydew (n = 16) | 965.6 | 265.39 | 600.8–1,718.7 | 0.24 | 0.133 | 0.03–0.49 |
| Oak honeydew-nectar (n = 18) | 1,095.7 | 241.83 | 697–1,541.4 | 0.27 | 0.149 | 0.08–0.58 |
| Significance | NS | NS | ||||
NS: non-significant.
Similarly, the protein content did not differ significantly (P > 0.05) between the two honey types. The mean values and ranges were close, and the overlapping intervals indicate that protein levels in both groups were broadly similar. Variability within each group, as indicated by the SDs, was again comparable.
In oak honeydew honey, the Pearson correlation matrix (Figure 5) shows a weak relation between TPC and TFC, while TFC was moderately and positively correlated with antioxidant activity and colour intensity. Strong and statistically significant correlations (P < 0.01) were observed among DPPH, FRAP, and ABS450, indicating consistency between antioxidant assays and their relationship with colour. In contrast, TPC showed weak or slightly negative correlations with these parameters. Proline was very weakly associated with antioxidant indicators, while protein showed negative correlations with TFC, antioxidant activity, and colour intensity, with the correlation with DPPH being statistically significant (P < 0.05).
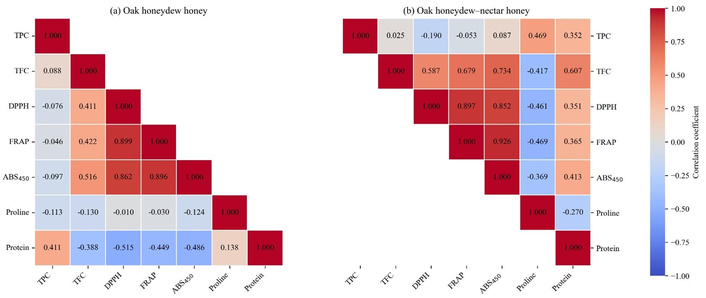
Pearson correlation matrices for bioactive compounds, antioxidant activity, and colour intensity for oak honeydew honey (a) and oak honeydew-nectar honey (b). TFC: total flavonoid content; TPC: total phenolic content.
In the oak honeydew-nectar honey, the correlation patterns were generally stronger and more consistent. Very strong and statistically significant correlations (P < 0.01) were observed among DPPH, FRAP, and ABS450, indicating a high degree of agreement between antioxidant activity and colour intensity. TFC was strongly and significantly correlated with FRAP and ABS450 (P < 0.01), and moderately with DPPH (P < 0.05), supporting its contribution to both antioxidant function and colour. A strong positive correlation was also found between TFC and protein (P < 0.01), a relationship not observed in oak honeydew honey. TPC was moderately correlated with proline (P < 0.05), while protein showed positive associations with FRAP and ABS450. Proline was negatively correlated with TFC, DPPH, and FRAP, with the correlation with FRAP being statistically significant (P < 0.05).
Overall, the correlation patterns for TPC, TFC, DPPH, FRAP, and ABS450 were similar in both honey types, indicating a consistent relation between phenolic content, antioxidant activity, and colour intensity.
PCA was carried out to evaluate the multivariate differentiation between oak honeydew and oak honeydew-nectar honey samples based on TPC, TFC, DPPH, FRAP, ABS450, proline, and protein. The first two principal components explained 68.1% of the total variance (PC1: 49.5%, PC2: 18.6%) (Figure 6). PC1 represented the main axis of separation and reflected a contrast between proline and the antioxidant-related parameters (FRAP, DPPH) and colour intensity (ABS450). Samples with higher antioxidant capacity and colour density were positioned toward the positive PC1 values, while those with elevated proline but lower antioxidant activity appeared toward the negative PC1 scores.
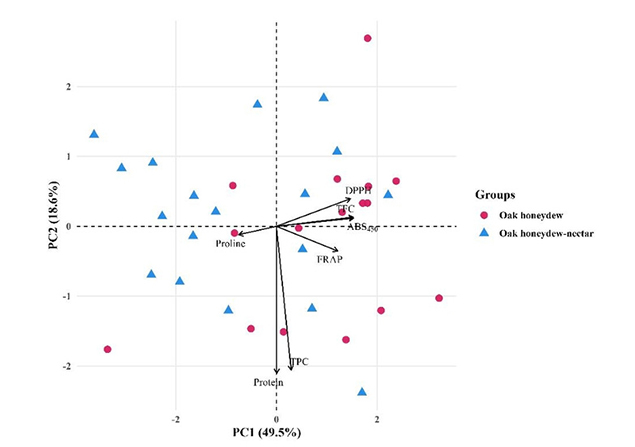
PCA score plot (PC1 vs. PC2) of oak honeydew and oak honeydew-nectar samples based on biochemical parameters. TFC: total flavonoid content; TPC: total phenolic content; PCA: Principal Component Analysis.
Hierarchical cluster analysis using Ward’s method further supported this separation (Figure 7). The dendrogram divided the samples into two well-defined clusters, each corresponding to one honey type. Oak honeydew samples were grouped in one cluster, while oak honeydew-nectar samples formed a distinct cluster. This pattern reflects high internal compositional consistency within each honey type and low similarity between the groups.
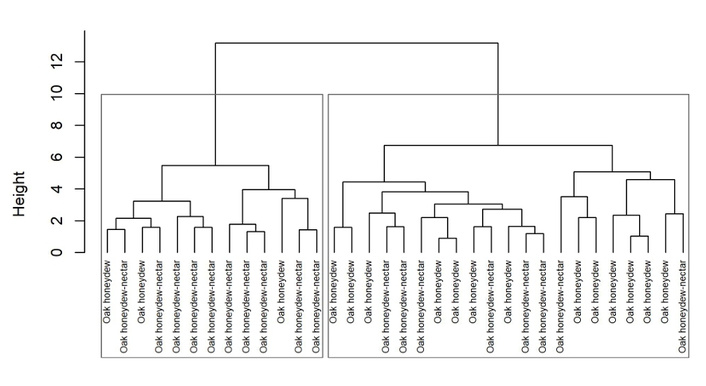
Hierarchical clustering dendrogram (Ward’s method) based on standardized biochemical markers.
This study aimed to compare the compositional and antioxidant characteristics of oak honeydew and oak honeydew-nectar honeys produced in Western Macedonia, Greece. Honey labeling relied entirely on the beekeeper’s declaration, reflecting real-world commercial practices. This approach is consistent with other studies where the floral origin was specified by beekeepers or attributed directly from the declared label [43, 44]. It should be noted, however, that the absence of melissopalynological analysis constitutes a limitation of the present study, as pollen analysis would strengthen the classification of the examined honey samples.
In terms of phenolic content, higher TPC values were reported by Tananaki et al. [48] and Ntakoulas et al. [12] for oak honeydew honeys collected from various regions of Greece, with values of 203.70 and 153.73 mg GAE/100 g honey, respectively. Kolayli et al. [49] found an average TPC of 67.30 mg GAE/100 g honey in Turkish oak honeydew honeys from the Thrace region, while Seijo et al. [50] reported an average of 134.80 mg GAE/100 g honey for samples collected across Spain. Vasić et al. [51] reported a TPC of 160 mg GAE/100 g honey in Hungarian oak honeydew honeys. The TPC values obtained in our study fall within this reported range for both types of examined honey. The difference in TPC between the two types of honey is related to their botanical origin, with honeydew honeys demonstrating higher TPC content in comparison to monofloral or multifloral honeys, while parameters such as pollen pattern, climate, and altitude can affect the TPC within the same botanical origin [20, 52].
When examining TFC, flavonoids represent the largest and most diverse group of phenolic compounds found in honey. These compounds naturally occur in many plants, primarily accumulating in the leaves, flowers, fruits, and seeds [53]. Kolayli et al. [49] reported TFC of 10.3 mg quercetin equivalents (QE) per 100 g of Turkish oak honeydew honey, while Seijo et al. [50] found a slightly lower average of 9.7 mg QE/100 g in Spanish samples. In a separate study, Jara-Palacios et al. [7] reported a TFC of 11.30 mg catechin equivalents (CE)/100 g in oak honeydew honey collected from various locations in Spain. On average, these values are approximately 4.5 times higher than those observed in the present study. It is important to note that TFC in our study was expressed as RUE, and the use of different reference standards may account for these differences and affect the interpretation of results across studies. In support of this, Can et al. [54] did not quantify quercetin or catechin in their HPLC-UV analysis of individual phenolic compounds but reported a rutin content of 53.86 mg/100 g, which aligns closely with the values obtained in our study. As determined by HPLC analysis, the total content of flavonoids—myricetin, rutin, kaempferol, quercetin, luteolin, apigenin, galangin, and chrysin—in Greek oak honeydew honey was approximately 0.216 mg per 100 g of honey. Specifically, the concentrations of rutin and quercetin were about 0.021 mg and 0.023 mg per 100 g of honey, respectively [12].
However, a direct comparison between spectrophotometric determinations of TFC and HPLC-based quantification of individual flavonoids is not appropriate, as the two methods differ significantly in sensitivity, specificity, and the expression of results. Spectrophotometric methods tend to overestimate flavonoid content due to their non-specificity and the use of various reference standards, whereas HPLC provides more accurate quantification of specific compounds but yields lower total values. This comparison serves only as a general indication of the differences in reported flavonoid levels and should be interpreted with caution, as the results are based on different analytical techniques and reporting standards.
Regarding the relative contribution of flavonoids to phenolics, in the present study, flavonoids represent approximately 37% of the TPC of the samples in both types of examined honeys, exceeding greatly the range of 4–15% reported by Kolayli et al. [49]. In general, oak honeydew honeys have a higher TFC than blossom honeys, while the phenolic composition of honeys is affected by the floral sources [54]. The comparatively elevated percentage of flavonoids observed may also reflect methodological differences, as the use of rutin as a calibration standard can yield higher apparent TFC values than those obtained with catechin or quercetin standards.
With respect to antioxidant capacity, in relation to DPPH radical scavenging activity, a markedly higher free radical scavenging capacity—approximately fourfold (around 73%)—has been reported for Spanish oak honeydew samples [50, 55]. Additionally, an average IC50 value of 14.58 mg/mL was reported by Kolayli et al. [49] for Turkish oak honeydew honey, representing the concentration required to achieve 50% inhibition. Similar mean IC50 values for Turkish oak honeydew honeys, such as 12.56 mg/mL, have also been reported [54]. In another study involving in vitro cell-free assays [56], the DPPH radical scavenging activity of Greek oak honey was measured at 7.14 mg/mL, while forest with oak honeydew honey—a naturally mixed oak honey—showed a lower IC50 value of 4.61 mg/mL, indicating higher antioxidant potential for the mixed-origin honey sample. Both samples were analyzed as single representatives of each honey type.
In the present study, antioxidant activity was assessed based on the percentage of DPPH radical inhibition at a specific concentration, whereas published data often report IC50 values. Despite the methodological difference, a qualitative comparison remains valid, as lower IC50 values generally correspond to higher inhibition percentages, reflecting stronger antioxidant potential.
Similarly, the FRAP assay results further corroborate these findings. Ucurum et al. [52] reported lower mean FRAP values for oak honeydew honey samples (24.11 μM TE/100 g), although with a wide variation across samples. The antioxidant capacity of oak honeydew honey, measured using the FRAP method, has also been assessed by Kolayli et al. [49], who reported 677 μmol FeSO4·7H2O/100 g, and by Can et al. [54], who found 307 μmol FeSO4·7H2O/100 g in samples from Turkey. Tananaki et al. [48] evaluated Greek oak honey and reported a FRAP value of 102.6 mg ascorbic acid equivalents (AAE)/100 g.
However, due to differences in the units used to express FRAP results—such as FeSO4 equivalents, TE, or AAE—direct comparison of antioxidant capacity across studies is not feasible. Still, when different protocols are employed for the assessment of antioxidant activity using the FRAP method, the results remain consistent [57]. Notably, oak honey samples showed the highest or among the highest FRAP values in studies that compared multiple honey types, whether of honeydew or floral origin [48, 52, 54]. In general, high FRAP values are desirable since the FRAP assay measures the ability of antioxidants to reduce ferric (Fe3+) to ferrous (Fe2+) ions, with higher FRAP values reflecting greater antioxidant capacity.
Lachman et al. [58] reported that among various Czech honey types, honeydew honeys exhibited higher DPPH and FRAP values—expressed as mg of AAE—compared to floral and mixture honeys. This was attributed to the presence of phenolic compounds differing in antioxidant activity and oxidation rates. These observations are consistent with our results, which likewise highlight the enhanced antioxidant capacity of honeydew honey.
Evaluation of the antioxidant activity of honey requires multiple analytical methods, as different antioxidants act through various mechanisms such as radical scavenging, hydrogen donation, and metal ion chelation. Phenolic compounds such as caffeic acid, p-coumaric acid, gallic acid, quercetin, kaempferol, pinocembrin, and chrysin [19] are the main contributors, with their activity largely depending on structural features like the number and position of hydroxyl groups. However, other components such as amino acids, organic acids, enzymes, and minerals also contribute, and their presence varies with the botanical and geographical origin of the honey [28, 59].
Considering colour intensity as a complementary indicator of antioxidant activity, there are no published data to the best of our knowledge on the colour intensity of oak honeydew honeys, which limits the ability to directly compare the findings of this study with existing literature. Generally, blossom honeys exhibit lower colour intensity values than honeydew honeys [60], a difference primarily attributed to the presence of pigments such as polyphenols, carotenoids, and Maillard reaction products [24, 61, 62]. In some cases, increased colour intensity may also result from exogenous pigments introduced during handling, processing, or storage, or from biochemical reactions during honey maturation that lead to the formation of compounds lacking antioxidant properties [24]. Moreover, the botanical origin of honey is a well-established factor influencing its colour intensity [60]. The presence of nectar honey in the oak honeydew-nectar samples likely contributed to the reduction in colour intensity, diluting the typical dark hue of pure oak honeydew honey.
Regarding proline and protein levels, no statistically significant differences were observed between the two honey types. The similar levels observed across both honey types suggest that these components are relatively stable and not strongly influenced by the botanical composition resulting from natural foraging.
Proline is the main free amino acid found in honey and serves as an indicator of its total amino acid content. It is widely used as a parameter to assess honey quality. Furthermore, proline levels can aid in the botanical characterization of honey [25]. A minimum proline content of 180 mg/kg has been proposed as a standard threshold to confirm honey ripeness and identify potential sugar adulteration [8, 63]. In the present study, the proline content of both honey types exceeded 600 mg/kg, far above the commonly accepted threshold of 180 mg/kg, confirming the maturity of the honey and indicating the absence of adulteration. Kolayli et al. [49] reported an average proline content of approximately 660 mg/kg in Turkish oak honeydew honey, with individual samples ranging from 434 to 1,242 mg/kg. Similarly, Ucurum et al. [52] found a mean proline content of around 857 mg/kg, with values ranging from 568 to 1,220 mg/kg in the same honey type. In the present study, the average proline content of the oak honeydew samples (965.62 mg/kg) was higher than the values reported in both studies, even exceeding the upper range documented by Ucurum et al. [52]. Furthermore, the oak honeydew-nectar honey samples showed an even higher average proline content (1,095.68 mg/kg). Currently, there is no available data, to our knowledge, on the proline content of Greek oak honeydew honeys. The content of proline is influenced by the type of honey harvest, which in turn depends on the floral species visited by bees and the extent and duration of their flowering period. It is also indirectly influenced by the botanical, floral, and geographical origin of the honey [64, 65]. Iglesias et al. [66] found a significantly higher proline content in honeydew honey as compared to blossom honey due to the fact that it is the major amino acid in honeydew honeys [8]. Additionally, climate change associated with temperature rise and water stress can result in an increase in the total amino acid concentration and the essential amino acid percentage in nectar [67]. The findings of this study indicate that a different botanical origin, as in the case of oak honeydew-nectar honey, did not result in a lower proline content.
The protein content of oak honeydew honey has not been extensively studied, and therefore, there is currently no available data to facilitate a comparison with the findings of this study. However, the protein content of honey is generally low, typically ranging from 0.1 to 0.5% [68]. Honeydew honeys tend to have higher protein levels, with a mean value of 0.6% and a range of 0.4 to 0.7%, compared to blossom honeys, which have an average protein content of 0.3% and range from 0.2 to 0.4% [68, 69]. The protein content of the honey samples analyzed in this study was generally within the range reported in the literature for both blossom and honeydew honeys (typically 0.2–0.7 mg/g). Specifically, oak honeydew honeys showed a mean protein content of 0.24 mg/g, with values ranging from 0.03 to 0.49 mg/g. These values are notably lower than the average levels reported for honeydew honeys and are positioned toward the lower end of the expected range, suggesting moderate protein presence. In the case of the oak honeydew-nectar honey, the mean protein content was 0.27 mg/g, ranging from 0.08 to 0.58 mg/g. While slightly higher than the oak samples, these values also remain close to the lower end of the typical protein content range. Proteins in honey originate from both bee secretions and plant sources. While some protein may derive from nectar or pollen, the primary source is the secretions of the salivary and hypopharyngeal glands of honey bees. These glands contribute various enzymes during nectar processing, leading to the formation of honey proteins. In particular, honeydew honeys tend to have higher protein content due to the greater contribution of bee-derived enzymes and other glandular proteins, rather than plant-origin compounds [8, 68, 70]. The protein content of honey is also influenced by its geographical origin, bee species, and environmental conditions, while processing and storage can further modify it through enzymatic degradation and Maillard reactions [71].
Regarding correlations between biochemical parameters and antioxidant activity, in comparison to the present study, Kolayli et al. [49] reported strong positive correlations of both TPC and TFC with FRAP, and negative correlations with DPPH, in Turkish oak honeydew honeys. In the recent comprehensive review by Becerril-Sánchez et al. [20], strong positive correlations have been reported between TPC, TFC, and the antioxidant capacity of various honey types. Additionally, Beretta et al. [24] reported very strong and statistically significant correlations between TPC and antioxidant activity in commercial honey of different floral and geographical origins when assessed with the DPPH and FRAP methods. The stronger correlation between FRAP and TFC, compared to TPC, indicates that the reducing capacity of honey is more closely linked to flavonoids, which are involved in the reduction of Fe3+ to Fe2+, corroborating the findings of Kędzierska-Matysek et al. [72] and Perna et al. [73].
The negative correlation between proline and both DPPH and FRAP observed in the present study for both honey types, although to varying degrees, aligns more closely with the findings of Kolayli et al. [49], who reported a negative correlation between proline and DPPH but a positive correlation with FRAP in Turkish oak honeydew honeys. In contrast, other studies [26, 27] reported strong positive correlations between proline content and antioxidant activity (DPPH and FRAP) in various honey types, associating proline with free radical scavenging capacity.
The most profound difference in the correlation matrix was observed in the protein-related correlations, which were negative in oak honeydew honey and generally positive in the oak honeydew-nectar honey, indicating differences in the role of protein in relation to antioxidant and colour-associated components between the two types of honey. The antioxidant activity of honey is attributed to the synergistic effects of a diverse range of bioactive compounds, including phenolic acids, flavonoids, peptides, enzymes, organic acids, amino acids, proteins, ascorbic acid, and Maillard reaction products. These constituents, each possessing antioxidant properties, interact in complex ways to enhance the overall antioxidant capacity of honey, suggesting that no single component is solely responsible for its activity, but rather the result of their combined actions [74, 75]. This may, at least in part, explain the differing correlation patterns observed between TPC, TFC, and antioxidant activity (DPPH, FRAP) in the two honeys examined. The higher protein content, although not statistically significant, observed in the oak honeydew-nectar honey may have contributed to its antioxidant potential, thereby reinforcing the positive associations with phenolic and flavonoid compounds. Additionally, the presence of pigments such as polyphenols, carotenoids, and Maillard reaction products is known to influence both the antioxidant properties and the colour intensity of honey [24, 61, 62], further supporting the observed correlations between chemical composition, antioxidant capacity, and colour-related parameters. However, the oak honeydew-nectar honey exhibited stronger and more consistent correlations, probably related to the diverse botanical origin of its honey ingredients.
The PCA score plot demonstrated a clear differentiation trend between the two honey types. Oak honeydew honey samples were mainly located in the positive PC1 region, indicating higher total phenolic and antioxidant potential, whereas oak honeydew-nectar honey samples clustered predominantly in the negative PC1 region, reflecting lower antioxidant values and lower colour intensity. Although some overlap occurred due to natural variability, the overall pattern indicates that the biochemical composition of the two honey types is systematically distinct rather than a random variable. The clustering structure mirrors the PCA distribution, demonstrating that antioxidant capacity, phenolic content, and colour-derived properties function collectively as reliable multivariate markers for differentiating the two honey types. Together, the PCA and clustering results confirm that oak honeydew and oak honeydew-nectar honeys exhibit consistent and statistically supported multivariate separation, driven primarily by phenolic composition, antioxidant activity, and colour intensity.
This study aimed to evaluate and compare the antioxidant activity, phenolic and flavonoid content, proline, and protein levels of oak honeydew honey and oak honeydew-nectar honeys produced in Northwestern Greece. The results confirm that oak honeydew honey exhibits significantly higher antioxidant capacity, TPC, and colour intensity compared to the oak honeydew-nectar honeys, reflecting a richer bioactive composition. While no significant differences were observed in flavonoid content, proline, or protein levels, the high variability within each honey type highlights the influence of botanical origin and environmental factors. Correlation analysis revealed strong associations among antioxidant activity, colour intensity, and flavonoid content, particularly in the oak honeydew-nectar honeys, whereas phenolic content was less strongly correlated in the oak honeydew honey. Both honey types exceeded the established proline threshold, indicating full maturity and authenticity.
Overall, the findings underscore the functional and nutritional potential of oak honeydew honey and provide valuable compositional data that support its quality evaluation and differentiation. The higher antioxidant potential of oak honeydew honeys provides strong justification for their valorization in functional food markets and for promoting their unique quality attributes in consumer marketing and regional branding strategies. Furthermore, these results contribute to honey authentication efforts, offering supportive evidence for the discrimination of oak-derived honeys based on compositional markers and antioxidant properties. Future research should incorporate melissopalynological analysis and advanced profiling techniques to confirm botanical origin and expand the identification of bioactive compounds, thereby strengthening the scientific basis for the quality assessment of Greek oak honey. Finally, given the complex and diverse chemical composition of honey, further studies should be carried out to explore in greater depth the detailed chemical profile of Greek oak honeys.
AAE: ascorbic acid equivalents
EC: electrical conductivity
GAE: gallic acid equivalents
mAU: milli-absorbance units
PCA: Principal Component Analysis
QE: quercetin equivalents
RUE: rutin equivalents
SD: standard deviation
TE: Trolox equivalents
TFC: total flavonoid content
TPC: total phenolic content
The authors would like to thank Mr. Dimitrios Margaritis (deceased), Department of Products & Systems Design Engineering, University of Western Macedonia, for creating the map showing the locations where the bee hives were placed for honey collection.
The authors are grateful to the Beekeeping Association of Kozani for facilitating contact with the beekeepers who provided the honey samples used in the study.
PM: Conceptualization, Methodology, Validation, Formal analysis, Resources, Data curation, Supervision, Project administration, Writing—original draft, Writing—review & editing. NV: Investigation. IS: Investigation. CM: Investigation. GP: Investigation. VP: Investigation. EK: Methodology, Validation, Formal analysis, Data curation, Writing—original draft, Writing—review & editing. All authors read and approved the submitted version.
The authors declare that they have no conflicts of interest.
Not applicable.
Not applicable.
Not applicable.
The datasets that support the findings of this study are available from the corresponding author upon reasonable request.
Not applicable.
© The Author(s) 2026.
Open Exploration maintains a neutral stance on jurisdictional claims in published institutional affiliations and maps. All opinions expressed in this article are the personal views of the author(s) and do not represent the stance of the editorial team or the publisher.
Copyright: © The Author(s) 2026. This is an Open Access article licensed under a Creative Commons Attribution 4.0 International License (https://creativecommons.org/licenses/by/4.0/), which permits unrestricted use, sharing, adaptation, distribution and reproduction in any medium or format, for any purpose, even commercially, as long as you give appropriate credit to the original author(s) and the source, provide a link to the Creative Commons license, and indicate if changes were made.