Original Article

Affiliation:
Department of Food, Nutrition and Packaging Sciences, Clemson University, Clemson, SC 29634, USA
Affiliation:
Department of Food, Nutrition and Packaging Sciences, Clemson University, Clemson, SC 29634, USA
Affiliation:
Department of Food, Nutrition and Packaging Sciences, Clemson University, Clemson, SC 29634, USA
Email: pdawson@clemson.edu
ORCID: https://orcid.org/0000-0002-4110-8144
Explor Foods Foodomics. 2025;3:1010104 DOI: https://doi.org/10.37349/eff.2025.1010104
Received: June 20, 2025 Accepted: November 21, 2025 Published: December 16, 2025
Academic Editor: Xianhua Liu, Tianjin University, China
Aim: This study investigated the impact of storage temperature over a 12-week period on the quality of dairy and non-dairy frozen desserts produced at a university micro-creamery. Standardized production methods were employed to minimize variability. The primary objective was to assess whether increasing frozen storage temperatures—a potential strategy for reducing energy consumption—would adversely affect product quality.
Methods: Changes in ice crystal size were evaluated using scanning electron microscopy (SEM) on freeze-dried samples. A trained sensory panel assessed texture coarseness (grittiness) using a 5-point scale (1 = smoothest, 5 = grittiest). Weight loss was measured by comparing the sample mass before and after storage. Products were stored at four temperatures: –28.9°C (control), –17.8°C, –15.0°C, and –12.2°C, with evaluations conducted at 0, 4, 8, and 12 weeks. Statistical analysis was performed using a significance level of α = 0.05.
Results: Higher storage temperatures resulted in increased ice crystal size and greater perceived grittiness. Non-dairy desserts, which contained slightly more fat, demonstrated greater resistance to ice crystal growth and texture degradation. Desserts stored at –12.2°C and –15.0°C exhibited significantly larger ice crystals and coarser textures after 8 weeks compared to those stored at –17.8°C and –28.9°C.
Conclusions: The results indicate that storage at –15.0°C may be a feasible energy-saving option for commercial frozen dessert storage, provided the product is consumed within four weeks. However, storage at –12.2°C led to significant quality loss, suggesting that product reformulation may be necessary at this temperature. Further research should explore the role of various plant-based fats compared to milkfat in mitigating ice and fat crystal growth and preserving texture in frozen desserts.
The U.S. produces over 1.3 billion gallons of ice cream each year, according to the International Dairy Foods Association. Since the onset of the COVID-19 pandemic, ice cream sales have soared as more people turn to at-home comfort and indulgence. And the momentum isn’t slowing down. By 2029, the global ice cream market is expected to hit a staggering $105 billion, driven by product innovation and the rise of consumer-specific offerings. While non-dairy and plant-based varieties are making headlines, classic dairy ice creams are still the more preferred option, accounting for about 80% of all frozen dessert sales [1].
By federal definition, ice cream must be made from a pasteurized dairy mix, contain at least 10% milkfat and 20% milk solids, and weigh less than 1.6 pounds per gallon. It’s a delicate emulsion of air, ice crystals, and fat suspended in a creamy, unfrozen base. Sweeteners and flavorings are added as long as they are deemed generally recognized as safe (GRAS) and suitable.
Non-dairy alternatives replicate this structure using plant-based fats, stabilizers, and emulsifiers. But since these products don’t meet the US FDA’s standard of identity for ice cream [2], they’re instead labeled as “frozen desserts”. Interestingly, there’s currently no legal definition for non-dairy frozen desserts, which leaves the door wide open for experimentation and innovation in this growing category.
According to the International Dairy Foods Association, ice cream ideally should be stored lower than –18.0°C to maintain a deep-frozen state. Products stored at higher than –12.0°C “become subject to adverse changes in body, texture, and flavor characteristics” [1]. The USDA also recommends setting home freezers to –18.8°C, the coldest setting on most models, to ensure product quality. However, real-world use (like frequent door openings and storing warm items) causes temperature fluctuations. While colder settings help preserve texture and flavor, they also increase energy usage and emissions.
Thus, the consumer products industry is exploring whether raising home and commercial temperatures to –12.2°C can reduce environmental impact without compromising the taste or texture of frozen desserts. With over 3 million freezers in stores worldwide, even a small change could lead to massive energy savings with the determination of an optimal balance between sustainability and quality [3]. Raising the storage temperature of ice cream freezers from ultra-low settings (e.g., –23°C or lower) to higher but still safe levels (e.g., –15°C to –18°C) can significantly reduce energy consumption. This is because the energy required to maintain lower temperatures increases exponentially as the temperature difference between the freezer interior and ambient air grows [4]. For example, storage at –12°C to –15°C may result in energy savings of up to 15–25% compared to storage at –23°C, depending on insulation quality, freezer efficiency, and ambient conditions [5].
Ice cream production requires managing the formation and control of ice crystals. These crystals first appear during the dynamic freezing stage and continue to evolve throughout storage. Along with air cells and fat globules, ice crystals shape the texture and mouthfeel that define high-quality frozen desserts [6]. For a smooth and creamy mouthfeel, ice crystals must remain exceptionally small, ideally under 50 micrometers, which is below the tongue’s threshold for detection. When properly controlled, these microscopic crystals glide effortlessly past one another as the ice cream melts, creating the rich, velvety texture consumers love. However, when crystals grow too large or form unevenly, they lead to gritty or icy textures, one of the most common consumer complaints [7].
To study the internal structure of frozen desserts, researchers must preserve the product’s integrity before imaging. Because of its high water and fat content, ice cream is challenging to analyze without altering its form. Freeze-drying offers a solution by sublimating the ice, leaving a stable structure suitable for observation under scanning electron microscopy (SEM).
SEM allows scientists to visualize the internal architecture of frozen desserts in stunning detail. By directing a focused beam of electrons across the surface of a freeze-dried sample in a precise raster (zig-zag) pattern, the microscope captures emissions from secondary and back-scattered electrons. These emissions are then detected and transformed into detailed images of the sample’s microstructure, including the porous impressions left behind by sublimated ice crystals [8–10]. Once stabilized, SEM can be used to obtain high-resolution images of ice crystal pores using focused electron beams. Electron beams are focused through a series of lenses under a vacuum state to prevent electrical discharges from air particles. The concentrated beam hits the sample and scans across the surface in a raster pattern, or side-to-side from top to bottom [6]. The interaction of the electron beam and sample causes emission of secondary and back-scattered electrons, which are collected by detectors to form a high-resolution image [5].
Ice cream quality is typically assessed by factors such as mix formulation, overrun (air incorporation), viscosity, and melting resistance. These attributes influence what food scientists call “body” and “texture”—the overall mouthfeel and the individual characteristics of the frozen matrix. When ice crystals exceed the optimal size, they cause defects known as grittiness or iciness, characterized by a rough mouthfeel, visible crystal formations, and an unusually cold sensation. The American Dairy Science Association uses a 5-point hedonic scale to evaluate these characteristics, with 5 representing excellent quality and 1 indicating a high degree of defect [11].
The objective of this study was to determine the effect of storing dairy and non-dairy frozen desserts at higher temperatures currently used on the quality of these products.
Dairy samples (DS) were made using unflavored dairy ice cream mix and adhered to regular ice cream overrun requirements for the federal ice cream standard [2]. The unflavored dairy mix recipe included the following: milk, cream, sugar, nonfat dry milk, dry sweet whey, guar gum, mono and diglycerides, cellulose gum, carrageenan, and locust bean gum. Non-dairy samples (NDS) frozen dessert used unflavored Meadowvale dairy-free dessert mix, which contains coconut cream, sugar, water, tapioca syrup solids, and locust bean gum. To standardize dairy and NDS, the samples were both frozen in a 6-quart batch freezer (Model CB-350, Emery Thompson Middleby Inc., USA) for 7 minutes at 165 rpm, so as not to exceed 100% overrun. Samples were then placed in a –28.8°C freezer for 48 hours to allow static freezing to occur.
DS and NDS were separated into 4 different storage temperatures: –28.8°C (control), –17.7°C, –15.0°C, and –12.2°C. These temperatures were selected as treatments to replicate the manufacturer’s freezer temperature (–28.8°C) as well as varying temperatures reaching –12.2°C, which is Unilever’s goal temperature for commercial freezers. One cup from each sample group contained a thermocouple to measure internal temperature during storage.
The proximate composition and nutritional information were taken from the supplier’s label information.
The percent overrun was calculated using the following formula.
While scooping samples into 118.3 mL cups, 6 samples from each set (temperature and sample type) were weighed to 35 g. This standardized weight was used as an initial measurement to determine weight loss over time. Samples were measured again after 12 weeks.
Samples for SEM analysis were first placed in a –28.8°C freezer to ensure products were frozen solid. The freeze dryer (Model HRC 100, Harvest Right Inc., USA) was pre-frozen for 30 minutes to allow the chamber to reach –28.8°C, to prevent any loss of structural integrity during sample transfer. Samples were placed on the same tray in the center of the freeze dryer. At 400 mTorr and –34.4°C, the drying cycle slowly increased the internal chamber temperature. Internal chamber temperature reached –5.7°C to sublimate ice, and then pressure slowly increased during the final drying stage. Samples were fully freeze-dried after 24 hours. Freeze-dried samples were kept in airtight containers until analyzed with Electron Microscopy.
Ice crystal pore size was analyzed using a PC-based variable-pressure SEM (Model S-3400N, Hitachi, Japan). Samples were transported to the Clemson University Microscopy Laboratory and removed from airtight containers one at a time for analysis. A laboratory spatula was used to cut samples in half and remove a small interior piece. The interior piece was mounted on the SEM stage and adjusted for height. Sample heights ranged between 3 mm and 5 mm.
The SEM was placed in variable-pressure vacuum mode (VP-SEM), which operates at greater pressures to allow higher resolution imaging of non-conductive samples, including food products. The samples were tested at 30 Pa with an accelerating voltage level of 20 kV. Images were captured using the Quartz personal computer imaging (PCI) software. Using the Quartz PCI measuring tool, pore size was determined by measuring the diameter of ice crystal pores shown in each micrograph.
A total of twelve individuals with prior experience in dairy product evaluation, either through successful completion of a University Evaluation of Dairy Products course, were initially recruited for the study. Due to scheduling conflicts that prevented full participation, four individuals were excluded, resulting in a final panel of eight participants. These eight panelists underwent a structured training program consisting of three sessions focused on the assessment of “smoothness” as a sensory attribute. During training, panelists were presented with reference samples representing distinct levels of smoothness and grittiness, and were trained to accurately distinguish and rate these textural differences. Participants ranged in age from 19 to 31 years. Prior to beginning the study, all participants provided written informed consent and completed both a standardized sensory panel script and an allergen disclosure form, in accordance with institutional ethical guidelines (IRB2020-285).
Samples were removed from freezers and placed in a refrigerator until the internal temperature reached –12.2°C, defined by the International Dairy Foods Association as the proper temperature for texture and body analysis [12]. (International Dairy Foods Association, Storing and Handling, 2023). Samples stored at –12.2°C were removed from the freezer and immediately placed on the tray. Internal temperature was measured using a thermocouple placed directly in the center of each sample.
Lids from sample cups were removed prior to paneling to prevent participants from knowing which sample was associated with which temperature. For the evaluation form, samples were given a unique code for the participants to use. Two repetitions were completed by participants, and samples were rearranged for each repetition, to ensure panelists would not associate placement with and sample. Participants were given one tray at a time with a spoon, a cup of water, and a sensory evaluation form.
Participants ranked samples on a 5-point hedonic scale (Figure 1), starting at 1, for extremely smooth, to 5, for extremely gritty and rough (1 = extremely smooth, 2 = very smooth, 3 = moderately smooth, 4 = very gritty, 5 = extremely gritty). The term “smoothness” was used to describe creaminess and iciness as an all-encompassing term to describe both DS and NDS, and to ensure panelists were not confusing dairy judging terminology (“icy”) with this descriptive analysis ranking scale. This term was also used to prevent participants from attempting to compare the formulations (dairy vs. non-dairy).
The experiment was replicated 2 times using two different batches of dairy and non-dairy frozen desserts prepared in different time periods. The main effects of desert type (dairy or non-dairy), storage temperature (–12.2°C, –15.0°C, –17.8°C, and –28.9°C), storage time (4, 8, and 12 weeks) as well as the two and three interactions were tested using the analysis of variance for their significant effect on ice crystal pore size, sensory grittiness, and weight loss. When the main effect or interaction had a significant effect (p < 0.05), means were separated using Tukey’s test or the pdiff command in the Statistical Analysis System (SAS).
Nutrition information for each formulation based on the supplier is shown in Table 1, and the overrun for samples ranged between 72.5% and 76.6%, as shown in Table 2.
Nutrition facts for dairy and non-dairy frozen desserts (per 100 g) based on supplier information.
| Sample | Total calories | Total fat (g) | Saturated fat (g) | Trans fat (g) | Cholesterol (mg) | Sodium (mg) | Total carbohydrate (g) | Dietary fiber (g) | Sugars (g) | Protein (g) |
|---|---|---|---|---|---|---|---|---|---|---|
| Dairy | 210 | 13 | 8 | 0 | 35 | 85 | 22 | 0 | 22 | 4 |
| Non-dairy | 230 | 14 | 13 | 0 | 0 | 50 | 25 | 0 | 20 | 2 |
Overrun calculations.
| Sample | Weight of liquid mix1 (g) | Weight of frozen ice cream1 (g) | Overrun (%) |
|---|---|---|---|
| Dairy | 485.0 | 274.6 | 76.6 |
| Non-dairy | 507.3 | 294.1 | 72.5 |
1Weight of sample filling a 300 mL container.
Samples from each storage time and temperature were analyzed using SEM. Two pictures were taken from each sample and then measured using the Quartz PCI measuring tool. We hypothesized that ice cream stored at –15.0°C and –12.2°C would see significant differences in ice crystal size and morphology regardless of sample type due to the temperatures’ proximity to recrystallization temperatures. Dairy frozen dessert showed significant differences in ice crystal pore size based on storage time and temperature (Table 3). Pore sizes for the lower temperatures (–28.9°C and –17.8°C) gradually increased in size between weeks 0 and 4 and then showed a greater increase between weeks 4 and 8. Samples stored at –28.9°C had pore sizes significantly smaller than those at other storage temperatures. As hypothesized, samples at lower temperatures were more resistant to recrystallization since samples were held at temperatures low enough to minimize ice cream thawing. Lower temperatures (–15°C and –12.2°C) had ice crystals grow significantly between weeks 0 and 4. The larger increase in pore size may be due to the drastic temperature change between initial static freezing (–28.9°C) and storage temperatures. On average, DS and NDS did not change significantly after 8 weeks, regardless of storage temperature (Table 3 and Table 4).
Pore size for dairy-based frozen dessert samples stored for 12 weeks at four different temperatures.
| Weeks of storage | Storage temperature (°C) | Average diameter (µm) | % increase from day 0 | Range (µm) |
|---|---|---|---|---|
| 0 | –28.9 | 23.7 ± 12.6e,1 | 2.2–48.8 | |
| 4 | –12.2 | 107.6 ± 30.8a | 354.0 | 49.5–166.5 |
| 4 | –15 | 68.3 ± 39.7bc | 188.2 | 2.2–49.4 |
| 4 | –17.8 | 34.8 ± 15.2de | 46.8 | 9.2–61.1 |
| 4 | –28.9 | 32.0 ± 16.2de | 35.0 | 5.5–59.6 |
| 8 | –12.2 | 105.0 ± 39.8a | 343.0 | 36.3–177.7 |
| 8 | –15 | 74.8 ± 39.4bc | 215.6 | 2.2–150.5 |
| 8 | –17.8 | 56.3 ± 18.9cd | 137.6 | 21.5–90.5 |
| 8 | –28.9 | 56.8 ± 20.9cd | 139.7 | 20.6–93.3 |
| 12 | –12.2 | 84.1 ± 30.5b | 254.9 | 36.6–131.4 |
| 12 | –15 | 74.5 ± 37.9bc | 214.3 | 13.1–137.0 |
| 12 | –17.8 | 58.6 ± 22.6cd | 147.3 | 25.5–92.4 |
| 12 | –28.9 | 47.7 ± 14.4d | 101.3 | 36.6–80.7 |
a–eMeans with different superscripts are significantly different (p < 0.05) (n = 6). 1Based on measurements (µm) from SEM micrographs (n = 6).
Pore size for non-dairy-based frozen dessert samples stored for 12 weeks at four different temperatures.
| Weeks of storage | Storage temperature (°C) | Average diameter (µm) | % increase from day 0 | Range (µm) |
|---|---|---|---|---|
| 0 | –28.9 | 37.8 ± 10.6bc,1 | 19.0–57.1 | |
| 4 | –12.2 | 50.9 ± 17.8ab | 72.0 | 24.5–77.5 |
| 4 | –15 | 40.3 ± 10.7bc | 43.9 | 22.1–58.2 |
| 4 | –17.8 | 46.3 ± 19.7b | 59.8 | 15.5–76.5 |
| 4 | –28.9 | 26.5 ± 11.4c | 7.4 | 10.2–44.3 |
| 8 | –12.2 | 69.2 ± 25.3a | 120.4 | 15.2–98.3 |
| 8 | –15 | 51.1 ± 17.2ab | 72.5 | 25.4–77.4 |
| 8 | –17.8 | 54.4 ± 21.9ab | 81.2 | 19.5–88.5 |
| 8 | –28.9 | 43.8 ± 12.3bc | 53.2 | 32.5–55.5 |
| 12 | –12.2 | 69.7 ± 25.5a | 121.7 | 28.3–112.2 |
| 12 | –15 | 57.6 ± 17.4ab | 89.7 | 29.5–86.5 |
| 12 | –17.8 | 51.6 ± 23.2ab | 73.8 | 14.2–90.2 |
| 12 | –28.9 | 44.2 ± 8.3bc | 54.2 | 32.2–56.5 |
a–cMeans with different superscripts are significantly different (p < 0.05) (n = 6). 1Based on measurements (µm) from SEM micrographs (n = 6).
All samples increased in pore size; however, there was more homogeneity in pore size (smaller range in size) and shape at the lowest temperature (–28.9°C). Lower storage temperatures caused pores to take on sharp, uneven shapes. Over time, NDS did not increase in pore size as much as DS. NDS tended to stay consistent, with the exception being samples in weeks 8 and 12 stored at –12.2°C. These samples contained the highest average pore size for all NDS. Goff et al. (2003) [13] and Donhowe et al. (1991) [14] reported that crystals over 50 μm in diameter are sensed as grainy, whereas finer crystals in the 30–40 μm diameter range create a desired creaminess sensation. Average pore sizes above 50 μm are bolded in Tables 3 and 4, reflecting the effect of higher storage temperature on projected frozen dessert sensory texture.
The most representative micrographs from DS stored at –28.9°C and –12.2°C for 12 weeks are shown in Figures 2A and 2B, and NDS stored at –28.9°C and –12.2°C for 12 weeks are shown in Figures 2C and 2D. These micrographs reflect the difference in pore size in both DS and NDS after 12 weeks of storage at –28.9°C versus –12.2°C.
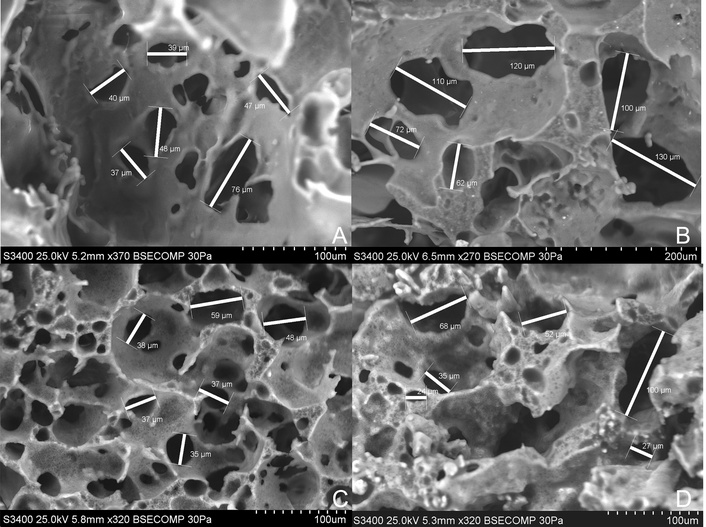
Micrographs of dairy and non-dairy samples stored at –28.9°C or –12.2°C for 12 weeks. (A) Micrograph of dairy sample stored at –28.9°C for 12 weeks; (B) micrograph of dairy sample stored at –12.2°C for 12 weeks; (C) micrograph of non-dairy sample stored at –28.9°C for 12 weeks; (D) micrograph of non-dairy sample stored at –12.2°C for 12 weeks.
It was hypothesized that the NDS would have smaller, more consistent ice crystal size and shape due to the higher fat content. Partially coalesced fat globules obstruct the growth of ice crystals, thus reducing the rate of recrystallization and lowering grittiness. Additionally, fat plays a role in stabilizing small, unstable ice crystals and air cells, which can prevent the formation of unfavorable, large ice crystals [15].
Sensory panelists ranked grittiness on a 5-point hedonic scale, with 1 being least gritty and 5 being most gritty. Increases in pore size and morphology diversity are experienced during the tasting of ice cream. Ice cream with sharper ice crystals and sizes > 50 μm is sensed as “icy” or “gritty” on the palate [10, 11]. On average, DS stored at –12.2°C and –15°C were grittier by week 12 (3.94 and 3.88, respectively) than DS stored at –17.8°C and –28.9°C [2.88 and 2.6, respectively (Figure 3)]. This parallels the pore size results related to the 50 μm threshold reported previously [10, 11]. Both dairy and non-dairy ice creams increased in grittiness over 12 weeks; however, dairy ice cream ranked significantly more gritty than NDS (Figures 3 and 4). With the exception of the highest storage temperature (–12.2°C), NDS’ grittiness did not increase significantly over 12 weeks between –28.9°C, –17.8°C, and –15.0°C. Grittiness for NDS all averaged between 1.63 and 3.13, with no week significantly grittier than the others. The difference in formulation and the presence of higher fat in the non-dairy sample may be responsible for less noticeable signs of recrystallization.
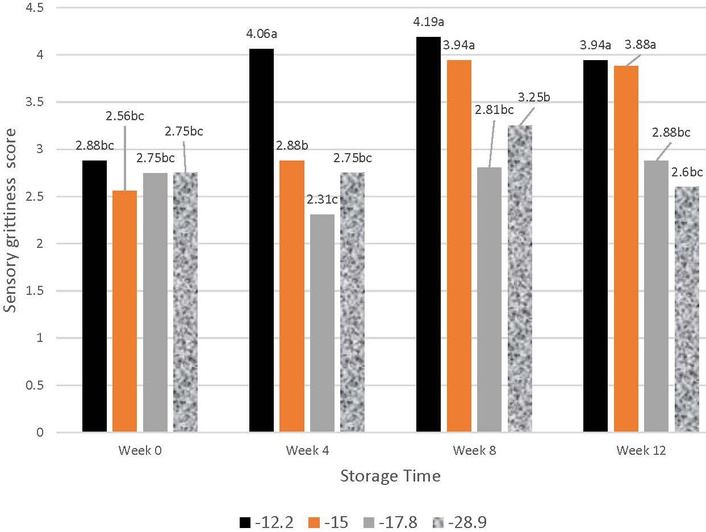
Mean sensory evaluation results for dairy-based frozen dessert samples stored for 12 weeks at four different temperatures (1 = least gritty, 5 = most gritty). a–cMeans with different superscripts across all storage times are significantly different (p < 0.05). n = 16.
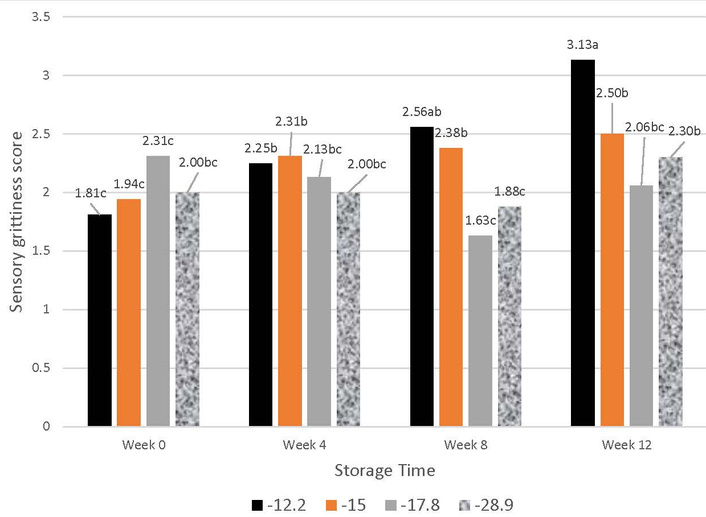
Mean sensory evaluation results for non-dairy-based frozen dessert samples stored for 12 weeks at four different temperatures (1 = least gritty, 5 = most gritty). a–cMeans with different superscripts across all storage times are significantly different (p < 0.05). n = 16.
The relationship between pore size and sensory panel score, shown for DS in Figure 5 and NDS in Figure 6, had a general positive correlation for both dairy and NDS. As storage temperature increased (Figures 3 and 4), average pore size and grittiness also increased. While the trend was observed in both types of samples, the correlation was more prevalent in DS. The NDS had a smaller range of pore sizes and 2 outlier values (52 μm pore size, 3.1 grittiness, and 55 μm pore size, 1.6 grittiness) that reduced the R2 of the relationship between pore size and grittiness score. Also, the pore size of NDS had less of an effect on grittiness than it did for DS.
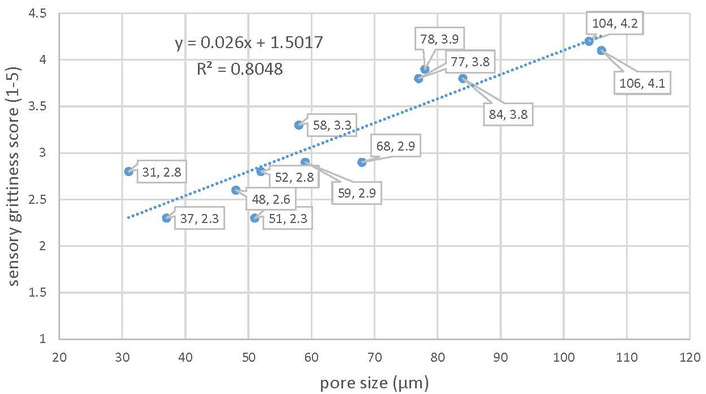
Ice crystal pore size as it relates to the average sensory panel score for dairy frozen dessert samples stored for 12 weeks at four different temperatures (1 = least coarse, 5 = most coarse). Model standard error for pore size = 23.5, based on measurements (µm) from SEM micrographs (n = 6). Model standard error for sensory panel = 0.86 (n = 16). Trendline for sensory score r2 = 0.8048. Correlation coefficient = 0.9.
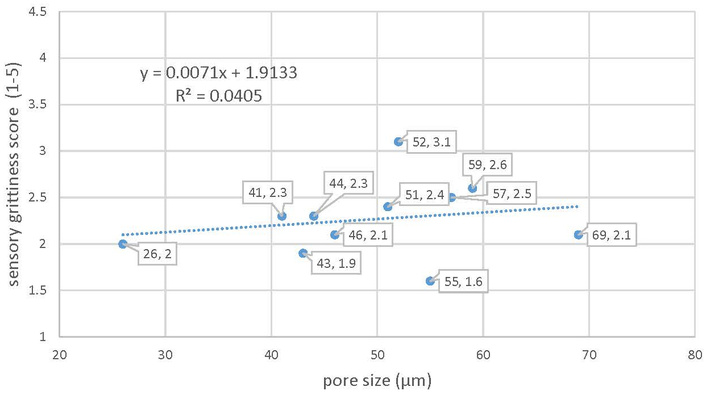
Ice crystal pore size as it relates to average sensory panel score for non-dairy frozen dessert samples stored for 12 weeks at four different temperatures (1 = least coarse, 5 = most coarse). Model standard error for pore size = 23.5, based on measurements (µm) from SEM micrographs (n = 6). Model standard error for sensory panel = 0.86 (n = 16). Trendline for sensory score r2 = 0.0405. Correlation coefficient = 0.2.
Weight loss was calculated over the 12-week storage period, and storage temperature had a significant impact on weight loss, regardless of the type of frozen dessert (Table 5). There was significantly lower weight loss for both dairy and NDS stored at –28.9°C compared to desserts stored at other storage temperatures. Shrinkage and weight loss of frozen desserts during storage are the result of collapsed, discrete air pockets. Recrystallization of partially melted ice crystals and loss of air phase volume were found to be proportional to storage temperature. Higher storage temperatures allow for partial melting and the formation of unfavorably large ice crystals, leading to increased weight loss [16]. The relationship between storage temperature and both weight loss and pore size reflects a similar positive stepwise relationship, with both pore size and weight loss increasing with increased storage temperature.
Weight loss for frozen dessert samples stored for 12 weeks at four different temperatures.
| Frozen dessert | Storage temperature (°C) | Average weight loss from day 0 to week 12 (g) |
|---|---|---|
| Dairy | –28.9 | 0.67 ± 0.43c |
| Dairy | –17.8 | 0.95 ± 0.61ab |
| Dairy | –15.0 | 0.91 ± 0.45ab |
| Dairy | –12.2 | 1.31 ± 0.30a |
| Non-dairy | –28.9 | 0.57 ± 0.26c |
| Non-dairy | –17.8 | 0.99 ± 0.59ab |
| Non-dairy | –15.0 | 0.98 ± 0.11ab |
| Non-dairy | –12.2 | 1.03 ± 0.8ab |
a–hMeans with different superscripts are significantly different (p < 0.05). n = 6.
Both dairy and non-dairy formulations, while compositionally distinct, exhibited similar trends throughout the experiment. Among the three storage temperatures tested, the warmest condition (–12.2°C) produced the most pronounced changes. After just four weeks, DS stored at –12.2°C showed a significant increase in pore size, expanding from an average of 23.7 µm to 107.6 µm. By eight weeks, samples stored at both –12.2°C and –15°C demonstrated exponential pore growth and a broader distribution in pore size, indicating progressive structural destabilization. Notably, –12.2°C—the upper limit of the recommended storage range for scoopable frozen desserts—was associated with the most significant textural degradation. This outcome aligns with the hypothesis that temperatures approaching the partial melting threshold of ice would exacerbate physical changes due to increased ice crystal mobility and recrystallization [17]. This aligns with previous findings indicating that warmer frozen storage promotes ice crystal growth and product shrinkage due to increased mobility of unfrozen water [18, 19].
NDS were less gritty and had smaller pore sizes than DS, particularly at –12.2°C, suggesting milkfat’s role in structural changes under thermal stress. This may be due to a variety of factors, such as greater fat content, which assists in preventing serum melting. In combination with lower overrun, this may explain why NDS did not appear as impacted by warm storage temperatures. These observations complement research by Regand and Goff (2002) [20], which showed that milkfat affects ice crystal morphology and limits coarseness when maintained at consistent low temperatures. Conversely, the lower overrun and unique fat properties of NDS (often stabilized with coconut or palm oils) appear to confer some protection against texture degradation, a finding that is increasingly relevant as the market for plant-based desserts grows [21].
Weight loss gradually increased as temperature increased, for both NDS and DS. DS portrayed a greater weight loss average than NDS at –12.2°C (1.31 and 1.03, respectively). As predicted, lower storage temperatures reduced weight loss and shrinkage by preventing unfavorable recrystallization. Controlling weight loss is crucial in packaged frozen desserts to maintain correct visual appearance upon reaching the consumer, for shrinkage in frozen desserts has been the source of previous consumer complaints.
Based on the results from this study, increasing freezer storage temperature to –17.8°C has little effect on pore size, grittiness, and weight loss. This 11°C increase in storage temperature would decrease energy usage without imparting negative effects. Increasing commercial freezers to –12.2°C is not recommended without product reformulation. The –12.2°C storage temperature had a significant impact on grittiness, weight loss, and unfavorable ice crystal formation. The addition of more stabilizers and overrun may help maintain structural integrity as well as innovation of freezers and packaging to minimize temperature fluctuations.
Frozen desserts may be stored at –15.0°C with minimal loss of eating quality if consumed in the first 4 weeks. Frozen desserts consumed after this point may lead to loss of structural integrity, a more gritty texture, and greater rates of weight loss. Although the difference between the two highest storage temperatures is only 2.8°C, there were significant differences in quality in the first several months. The gradual increase in weight loss with rising storage temperatures found in this study also corroborates past studies. Particularly, Tan et al. (2021) [22] noted that higher temperatures increase sublimation and water migration, leading to shrinkage and surface changes. Although weight loss differences between dairy and NDS were not statistically significant, the trend of reduced loss in non-dairy desserts mirrors known relationships between product composition and moisture retention [23].
Further research looking at the relationship of milkfat and plant-based fat content to ice crystal formation would be useful in determining the role of types of fats in preserving frozen desserts. Milkfat has been studied extensively; however, as more non-dairy frozen desserts enter the market, plant-based fats could be important in determining the best formulations. Additionally, current research looking at the performance of reformulated frozen desserts may provide useful information on how these products may withstand higher storage temperatures. The commercial freezer storage target of –12.2°C would not be practical, given the significant structural changes that occur in the product. However, increasing storage to –17.8°C or –15°C (depending on the length of storage) would reduce energy usage with minimal effect on product quality. The conclusion from this study is that increasing freezer storage temperature from –28.9 to –17.8°C had little effect on pore size, coarseness, and weight loss. It is supported by previous recommendations for deep-freezing to minimize recrystallization [24]. Storage of frozen desserts at –15.0°C is possible with minimal loss in quality if consumed in the first 4 weeks of storage. The study also calls for further investigation into the protective role of plant-based fats for frozen dessert quality. This is a subject underexplored in contrast to milkfat, which is consistent with the direction of current food science research, given the demand for vegan and lactose-free products.
DS: dairy samples
NDS: non-dairy samples
PCI: personal computer imaging
SEM: scanning electron microscopy
Any opinions, findings, conclusions, or recommendations expressed in this publication are those of the author(s) and should not be construed to represent any official USDA or U.S. Government determination or policy.
PD: Conceptualization, Investigation, Writing—original draft, Writing—review & editing, Supervision. JM: Conceptualization, Investigation, Writing—original draft, Writing—review & editing, Supervision. NS: Conceptualization, Investigation, Writing—original draft. All authors have read and approved the submitted manuscript.
The authors declare that they have no conflicts of interest.
Ethical approval of the sensory panel was given by the Clemson University Institutional Review Board (IRB2020-295).
Informed consent to participate in the study was obtained from all participants.
Not applicable.
The datasets for this study can be found in files retained by the corresponding author.
Technical Contribution No. 7440 of the Clemson University Experiment Station. The funders had no role in study design, data collection and analysis, decision to publish, or preparation of the manuscript.
© The Author(s) 2025.
Open Exploration maintains a neutral stance on jurisdictional claims in published institutional affiliations and maps. All opinions expressed in this article are the personal views of the author(s) and do not represent the stance of the editorial team or the publisher.
Copyright: © The Author(s) 2025. This is an Open Access article licensed under a Creative Commons Attribution 4.0 International License (https://creativecommons.org/licenses/by/4.0/), which permits unrestricted use, sharing, adaptation, distribution and reproduction in any medium or format, for any purpose, even commercially, as long as you give appropriate credit to the original author(s) and the source, provide a link to the Creative Commons license, and indicate if changes were made.