 Original Article

Affiliation:
1School of Public Health and Emergency Management, Southern University of Science and Technology, Shenzhen 518055, Guangdong Province, China
†These authors contributed equally to this work.
ORCID: https://orcid.org/0000-0002-2692-9112
Affiliation:
2School of Public Health, Capital Medical University, Beijing 100069, China
†These authors contributed equally to this work.
ORCID: https://orcid.org/0000-0001-5349-8568
Affiliation:
3Beijing Center for Disease Control and Prevention, Beijing 100069, China
ORCID: https://orcid.org/0000-0002-9821-7886
Affiliation:
2School of Public Health, Capital Medical University, Beijing 100069, China
ORCID: https://orcid.org/0000-0001-5737-6779
Affiliation:
2School of Public Health, Capital Medical University, Beijing 100069, China
ORCID: https://orcid.org/0000-0002-3690-0663
Affiliation:
4Beijing Medical Examination Center, Beijing 100069, China
Affiliation:
4Beijing Medical Examination Center, Beijing 100069, China
ORCID: https://orcid.org/0000-0003-0357-4264
Affiliation:
4Beijing Medical Examination Center, Beijing 100069, China
ORCID: https://orcid.org/0009-0000-3535-3381
Affiliation:
2School of Public Health, Capital Medical University, Beijing 100069, China
Email: xinghuayang@ccmu.edu.cn
ORCID: https://orcid.org/0000-0001-5608-0255
Explor Endocr Metab Dis. 2025;2:101448 DOI: https://doi.org/10.37349/eemd.2025.101448
Received: June 26, 2025 Accepted: October 29, 2025 Published: November 13, 2025
Academic Editor: Bernhard O. Boehm, Tan Tock Seng Hospital, Singapore
Aim: To investigate the natural history and progression of non-alcoholic fatty liver disease (NAFLD) in Chinese adults using a community-based longitudinal cohort.
Methods: We analyzed data from 24,893 adults in the Beijing Health Management Cohort (2016–2021) with annual follow-up, including questionnaires, physical examinations, and laboratory tests. Participants were categorized into three states: healthy (S1, n = 17,906), NAFLD with body mass index (BMI) < 24 kg/m2 (S2, n = 1,139), and NAFLD with BMI ≥ 24 kg/m2 (S3, n = 5,848). Transition probabilities, mean sojourn times, and determinants of progression were estimated using a multi-state Markov model, with analyses stratified by sex.
Results: Most individuals remained in their baseline state. Females in S1 were more likely to stay healthy than males (93.76% vs. 83.52%), while males had a higher risk of progression to S3 (12.59% vs. 4.23%). Females in S3 had a greater chance of reverting to S1 (21.33% vs. 18.18%). Mean sojourn time in S1 was longer for females (18.58 vs. 6.97 years), whereas males spent more time in S3 (5.37 vs. 4.18 years). Age, hyperuricemia, abdominal obesity, high triglycerides, and low high-density lipoprotein cholesterol (HDL-C) significantly increased the risk of progression.
Conclusions: Sex differences strongly affect NAFLD progression in Chinese adults. Males are more likely to deteriorate, while females show higher recovery. Metabolic factors and obesity are key targets for early prevention and intervention.
Non-alcoholic fatty liver disease (NAFLD) is a metabolic stress liver injury closely related to insulin resistance and genetic susceptibility. The disease spectrum includes non-alcoholic steatosis, non-alcoholic steatohepatitis, cirrhosis, and hepatocellular carcinoma [1, 2]. In China, NAFLD has surpassed viral hepatitis and become the largest liver disease. Research [3] shows that the prevalence of NAFLD is about 25% worldwide. The prevalence of NAFLD in China is about 20.09% [4]. In the United States, NAFLD and its subtype of non-alcoholic steatohepatitis affect 30% and 5% of the population [3]. With the prevalence of obesity and metabolic syndrome (MetS), NAFLD has become the leading cause of chronic liver disease in China and abnormal liver biochemical indicators in health examinations [5, 6]. Studies [7–9] have found that NAFLD patients have an increased risk of coronary heart disease (CHD) and stroke, also related to the occurrence and severity of coronary artery calcification [10]. NAFLD’s pathogenesis may involve oxidative stress, inflammation, etc. [11]. The prevalence of NAFLD is alarmingly high, and the availability of targeted pharmaceutical treatments remains limited. NAFLD in its early stages is reversible and can be eliminated through exercise and lifestyle modifications. Therefore, it is imperative to promptly identify and address the risk factors associated with NAFLD in high-risk individuals. Exploring the etiology of NAFLD contributes to the prevention and treatment of the disease [11, 12].
Previous studies [12, 13] have established that NAFLD is associated with various factors, including obesity, insulin resistance, MetS, and genetic susceptibility. However, most existing studies on NAFLD have focused on its static state, neglecting its dynamic progression and the transitions between different stages. This gap in research highlights the need for models that can capture the progression of the disease, stage transitions, and their interrelationships. Therefore, this study proposes a method based on a Multistate Markov model to provide a more comprehensive and detailed understanding of the progression of NAFLD. The Multistate Markov model is an important tool for analyzing disease progression and predicting disease outcomes, as it can describe dynamic transitions between healthy and diseased states [14, 15]. Unlike traditional static models, this approach can capture the transition probabilities between different disease states, thereby elucidating the disease’s evolution. Particularly for chronic diseases like NAFLD, which have multiple stages, the multistate model not only helps to understand the relationships between different disease stages but also provides a theoretical foundation for the development of intervention strategies [16].
In this study, body mass index (BMI), a key indicator closely associated with the onset and progression of NAFLD, is used to classify NAFLD patients. BMI is one of the most widely used measures of the relationship between body weight and health status globally and is extensively employed in clinical and public health research [17]. In China, BMI classification standards differ from international guidelines, especially in defining the thresholds for obesity and normal weight. According to Chinese standards, a BMI < 18.5 kg/m2 is classified as underweight, 18.5–23.9 kg/m2 as normal weight, 24–27.9 kg/m2 as overweight, and a BMI ≥ 28 kg/m2 as obese [18]. Based on this, the present study classifies NAFLD patients into three categories: S1 (healthy state), representing individuals without NAFLD and serving as the baseline control group; S2 (NAFLD with BMI < 18.5 kg/m2 or 18.5–23.9 kg/m2), including NAFLD patients with BMI less than 18.5 kg/m2 (underweight) or within the 18.5–23.9 kg/m2 range (normal weight); and S3 (NAFLD with BMI ≥ 24 kg/m2), including NAFLD patients with BMI in the 24–27.9 kg/m2 (overweight) or ≥ 28 kg/m2 (obese) ranges.
Obesity (BMI ≥ 24 kg/m2) is considered a major risk factor for NAFLD [19, 20], while the metabolic mechanisms in underweight and normal weight patients (BMI < 24 kg/m2) differ from those in obese patients. Specifically, for individuals with a BMI below 24, existing research suggests that their NAFLD may be more related to genetic susceptibility and other non-metabolic factors. To avoid potential confounding from this group, this study excludes individuals whose BMI remained below 24 throughout the follow-up period, thereby reducing potential differences in underlying pathological mechanisms and ensuring the accuracy and consistency of the results.
Epidemiological data indicate that the prevalence of NAFLD in China varies significantly across different age groups. For example, the prevalence is approximately 15% among individuals aged 30–39 years, whereas it exceeds 30% in those aged 60 years and older [21]. Lifestyle factors such as high-fat and high-sugar diets, physical inactivity, excessive alcohol consumption, and smoking are all significantly associated with an increased risk of NAFLD [22]. In European countries, the overall prevalence of NAFLD is estimated to be around 23–25%, which is comparable to that in China, although differences exist in age distribution and disease burden [23]. NAFLD not only adversely affects patients’ quality of life but may also reduce healthy life expectancy and overall lifespan [24]. Compared with other Asian countries such as Japan and South Korea, the prevalence of NAFLD in China is increasing more rapidly, a trend associated with rapid urbanization, lifestyle changes, and the rising prevalence of obesity [25]. Currently, there are relatively few longitudinal studies on NAFLD in Asia, resulting in a substantial gap in understanding the mechanisms of disease progression [26]. Therefore, based on China-specific BMI thresholds (normal: 18.5–23.9 kg/m2, overweight: 24–27.9 kg/m2, obese: ≥ 28 kg/m2), this study not only aims to elucidate the progression patterns of NAFLD but also seeks to provide important references for the Chinese population and similar groups elsewhere.
By distinguishing between the three NAFLD states, this model provides a more detailed analysis of NAFLD progression, laying the foundation for the development of more targeted prevention and intervention strategies. This innovative approach not only enhances the predictive accuracy of the model but also provides more precise data to support personalized management of NAFLD.
This study used data from the Beijing Health Management Cohort (BHMC) collected from January 2016 to December 2021, with annual follow-up including questionnaires, physical examinations, and laboratory tests. The study was approved by the Ethics Committee of Capital Medical University (No. 2019SY088), and all participants provided informed consent.
Inclusion criteria: (1) willingness to participate in the project study and sign the informed consent form. Cooperation in completing survey questionnaires, undergoing physical examinations, providing blood samples, and obtaining a unique identification code; (2) age ≥ 18 years; (3) at least two follow-up data points, including comprehensive information on NAFLD-related indicators.
Exclusion criteria: (1) excessive alcohol consumption: ≥ 140 g/week for males and ≥ 70g/week for females; (2) self-reported viral hepatitis, history of cancer, or autoimmune diseases; (3) long-term medication use; (4) lack of important indicators such as BMI, height, and weight data; (5) lack of follow-up; (6) individuals who developed NAFLD during follow-up but whose BMI remained < 24 kg/m2 throughout the study period were excluded, in order to avoid potential bias from lean NAFLD trajectories that may involve distinct etiological mechanisms unrelated to metabolic factors. The study inclusion flow chart is shown in Figure 1 [27].
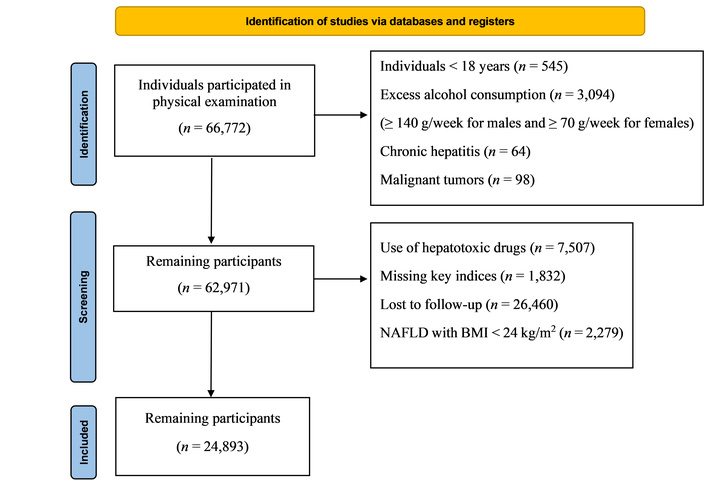
Flow chart of participant selection in this study. NAFLD: non-alcoholic fatty liver disease; BMI: body mass index. Adapted from [27]. © Author(s) 2021. CC BY 4.0.
Participants with severe cognitive impairment, inability to complete the questionnaire independently, or major health conditions affecting liver health (such as advanced malignancy or severe organ failure) were excluded.
Standardized self-report questionnaires collected information on demographics, health behaviors (smoking, alcohol consumption, dietary habits, exercise), medication use, and disease history. Long-term medication was defined as daily use for more than 6 months.
Smoking: never, former, current. Alcohol consumption: none or moderate (≤ 20 g/day for men; ≤ 10 g/day for women). Dietary habits: balanced, vegetable-based, meat-based, vegetarian-based. Exercise: never, occasional, active.
Anthropometric measurements included height, weight, waist circumference (WC), systolic and diastolic blood pressure (SBP, DBP). BMI was calculated as weight (kg)/height2 (m2).
Laboratory tests were performed after a 12 h fast and included total cholesterol, triglycerides (TG), low-density lipoprotein cholesterol (LDL-C), high-density lipoprotein cholesterol (HDL-C), fasting plasma glucose (FPG), aspartate aminotransferase (AST), alanine aminotransferase (ALT), and serum uric acid (SUA), measured using a Beckman LX20 chemistry analyzer. Hepatic ultrasound examinations were performed by experienced radiologists.
Quality control: participants were selected according to predefined eligibility criteria, with ineligible individuals excluded. Baseline and follow-up surveys were conducted by professionals. Double data entry and checking were performed to ensure data accuracy. Ultrasonographic examinations were conducted by experienced physicians following standard procedures to minimize variability. Participants were censored at their last available follow-up if lost to follow-up or at the end of the study period. Since death or severe liver outcomes (cirrhosis/HCC) were not systematically recorded in this routine health check cohort, these potential absorbing states were not included in the model. We acknowledge that the absence of absorbing states may result in potential informative censoring.
NAFLD was diagnosed based on the following criteria: (1) enhanced echogenicity in the near field and attenuated echogenicity in the far field of the liver parenchyma; (2) presence of intra-hepatic ducts that are relatively obscure in structure and rounded liver margins with hepatomegaly; (3) alcohol consumption of 140 g/week for men and 70 g/week for women; and (4) absence of other diseases and conditions that may cause fatty liver disease, such as viral hepatitis, total parenteral nutrition, hepatomegaly, and drug-related liver disease [28].
Diagnosis of hyperuricemia (HUA): refer to the China HUA-related disease diagnosis and treatment of multidisciplinary expert consensus, male fasting SUA > 420 μmol/L, female fasting SUA > 360 μmol/L diagnosed as HUA [29].
According to the Chinese guidelines recommended by the National Health Commission of China, adult BMI categories differ from the WHO classification. For Chinese adults, BMI < 18.5 kg/m2 is classified as underweight, 18.5–23.9 kg/m2 as normal weight, 24–27.9 kg/m2 as overweight, and a BMI ≥ 28 kg/m2 as obese [18]. This classification is based on evidence showing that Asian populations may experience obesity-related health risks at lower BMI levels compared to Western populations.
This study classifies NAFLD patients into three categories based on BMI:
S1 (healthy state): This state represents healthy individuals without NAFLD, serving as the baseline control group.
S2 (NAFLD, BMI < 18.5 kg/m2 or 18.5–23.9 kg/m2): This group includes NAFLD patients with a BMI below 18.5 kg/m2 (underweight) or within the range of 18.5–23.9 kg/m2 (normal weight).
S3 (NAFLD, BMI ≥ 24 kg/m2): This group includes NAFLD patients with a BMI between 24–27.9 kg/m2 (overweight) and BMI ≥ 28 kg/m2 (obesity).
Underweight NAFLD may represent a distinct ‘lean NAFLD’ phenotype with potential genetic or non-metabolic etiologies. However, in our cohort, the proportion of underweight individuals in S2 was extremely low (n = 5 out of 1,139 at baseline, 0.4%). Given this negligible fraction, merging them with normal-weight NAFLD is unlikely to materially affect transition intensity estimates or covariate effects. Therefore, we retained the combined definition of S2.
A multistate Markov model can effectively process longitudinal follow-up data. The disease process is divided into several states. According to the observation interval, the number and frequency of transitions between states are calculated, and the probability transition matrix between states is determined. Based on the probability transition matrix, the state starting from different states after several years is predicted.
The transition intensity is an index describing the instantaneous transition risk between states. The probability of an individual in state “H” before time “t” transferring to state “J” at time “t + 1”. Transition probability is a key indicator of the Multistate Markov model for long-term prediction. The probability of starting from a state and passing through a transition to another state is called the transition probability. Sojourn time refers to the length of time that the research object is in a transient state [30].
The fitted Multistate Markov model in this study contains three states: healthy state (S1), normal weight NAFLD state (S2), and overweight or obesity NAFLD state (S3). According to previous studies, NAFLD is reversible in the early stage. Liver steatosis can be eliminated by lifestyle changes such as exercise or drug regulation, and abdominal ultrasound results can be restored to normal. Therefore, the three states involved in this study are transient; this study does not set an absorption state. The transition between states is shown in Figure 2, which shows the probability of transfer between states in the total population after 1 year.
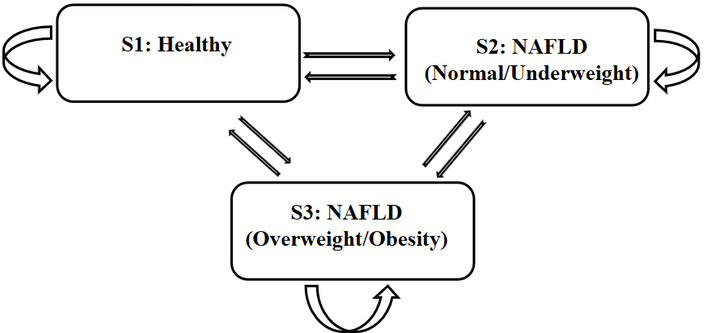
Structure of the multi-state Markov model showing transitions between healthy state (S1), NAFLD with BMI < 24 kg/m2 (S2), and NAFLD with BMI ≥ 24 kg/m2 (S3). NAFLD: non-alcoholic fatty liver disease; BMI: body mass index.
Data management and statistical analyses were performed using R software (version 4.2; R Project for Statistical Computing, Vienna, Austria, http://www.R-project.org/). Continuous variables were expressed as mean ± standard deviation (SD) and compared between groups using ANOVA. Categorical variables were expressed as numbers (percentages) and compared using the chi-square test. A two-sided P < 0.05 was considered statistically significant.
A multi-state Markov model was constructed using the msm package in R. The model included three states: S1 (healthy state, reference group), S2 (NAFLD with BMI < 24 kg/m2), and S3 (NAFLD with BMI ≥ 24 kg/m2). The Q-matrix allowed all possible transitions between the three states (S1↔S2, S1↔S3, and S2↔S3). Transition intensities were modeled as functions of covariates (age, sex, BMI, and metabolic factors). Time was treated as interval censored according to follow-up visits. Model optimization was performed using maximum likelihood estimation with the default convergence settings of the msm package. Given the sex-specific incidence of NAFLD, subgroup analyses were further conducted separately for men and women.
A total of 24,893 participants were included, with 17,906 (71.9%) in the healthy group (S1), 1,139 (4.6%) in the NAFLD group with BMI < 24 kg/m2 (S2), and 5,848 (23.5%) in the NAFLD group with BMI ≥ 24 kg/m2 (S3). Compared with S1, participants in S2 and S3 were generally older, had a higher proportion of males, and showed markedly higher prevalence of metabolic abnormalities, including dyslipidemia, hypertension, hyperglycemia, elevated liver enzymes, HUA, and abdominal obesity (all P < 0.001). Detailed characteristics are presented in Table 1.
Comparison of baseline characteristics among different groups of subjects.
| Variable | Total (n = 24,893) | S1 (reference, n = 17,906) | S2 (n = 1,139) | S3 (n = 5,848) | P-value |
|---|---|---|---|---|---|
| Demographic characteristics | |||||
| Gender | < 0.001a | ||||
| Male (n, %) | 12,497 (50.2) | 7,365 (41.1) | 743 (65.2) | 4,389 (75.1) | |
| Female (n, %) | 12,396 (49.8) | 10,541 (58.9) | 396 (34.8) | 1,459 (24.9) | |
| Age, mean ± SD (years) | 38.16 ± 10.93 | 37.27 ± 10.77 | 42.41 ± 11.56 | 40.05 ± 10.85 | < 0.001b |
| SBP, mean ± SD (mmHg) | 119.75 ± 14.77 | 116.82 ± 13.79 | 123.09 ± 14.04 | 128.10 ± 14.45 | < 0.001b |
| DBP, mean ± SD (mmHg) | 74.18 ± 10.90 | 71.98 ± 10.06 | 76.21 ± 10.34 | 80.50 ± 10.94 | < 0.001b |
| Abdominal obesity | 6,035 (24.2) | 1,776 (9.9) | 159 (14.0) | 4,100 (70.1) | < 0.001a |
| WC, mean ± SD (cm) | 80.22 ± 13.00 | 75.90 ± 9.19 | 83.02 ± 5.45 | 92.88 ± 15.38 | < 0.001b |
| Laboratory biochemical measurements | |||||
| Elevated TG (n, %) | 5,212 (20.9) | 1,793 (10.0) | 479 (42.1) | 2,940 (50.3) | < 0.001a |
| Low HDL-C (n, %) | 6,479 (26.0) | 3,546 (19.8) | 392 (34.4) | 2,541 (43.5) | < 0.001a |
| Elevated BP (n, %) | 7,181 (28.8) | 3,685 (20.6) | 434 (38.1) | 3,062 (52.4) | < 0.001a |
| Elevated FPG (n, %) | 4,071 (16.4) | 2,000 (11.2) | 320 (28.1) | 1,751 (29.9) | < 0.001a |
| HUA (n, %) | 4,996 (20.1) | 2,167 (12.1) | 319 (28.0) | 2,510 (42.9) | < 0.001a |
| ALT, mean ± SD (U/L) | 21.42 ± 19.66 | 16.31 ± 12.40 | 26.48 ± 19.19 | 36.09 ± 28.32 | < 0.001b |
| AST, mean ± SD (U/L) | 19.46 ± 9.86 | 17.84 ± 8.16 | 20.80 ± 10.29 | 24.18 ± 12.58 | < 0.001b |
| LDL-C, mean ± SD (mmol/L) | 2.83 ± 0.77 | 2.73 ± 0.74 | 3.10 ± 0.78 | 3.11 ± 0.78 | < 0.001b |
| TC, mean ± SD (mmol/L) | 4.72 ± 0.89 | 4.60 ± 0.86 | 5.01 ± 0.93 | 5.01 ± 0.90 | < 0.001b |
| TG, mean ± SD (mmol/L) | 1.31 ± 1.06 | 1.03 ± 0.65 | 1.77 ± 1.11 | 2.06 ± 1.56 | < 0.001b |
| HDL-C, mean ± SD (mmol/L) | 1.34 ± 0.33 | 1.42 ± 0.32 | 1.21 ± 0.26 | 1.12 ± 0.23 | < 0.001b |
| UA, mean ± SD (μmol/L) | 330.55 ± 94.57 | 306.50 ± 83.50 | 363.32 ± 86.41 | 397.80 ± 93.62 | < 0.001b |
| Hb, mean ± SD (g/L) | 145.41 ± 16.40 | 142.43 ± 16.17 | 150.49 ± 14.78 | 153.53 ± 14.27 | < 0.001b |
| FPG, mean ± SD (mmol/L) | 5.19 ± 0.81 | 5.07 ± 0.62 | 5.44 ± 1.07 | 5.50 ± 1.13 | < 0.001b |
| PLT, mean ± SD (109/L) | 249.76 ± 56.91 | 247.33 ± 55.85 | 255.02 ± 59.94 | 256.19 ± 58.91 | < 0.001b |
Continuous variables are expressed as mean ± SD; categorical variables as n (%). S1 (healthy state) is the reference group; S2 (NAFLD, BMI < 24 kg/m2); S3 (NAFLD, BMI ≥ 24 kg/m2. a: Chi-square test; b: Mann-Whitney U test. Units: SBP and DBP in mmHg; ALT and AST in U/L; LDL-C, TC, TG, HDL-C, FPG in mmol/L; UA in μmol/L; Hb in g/L; PLT in 109/L; WC in cm. SD: standard deviation; SBP: systolic blood pressure; DBP: diastolic blood pressure; WC: waist circumference; TG: triglycerides; HDL-C: high-density lipoprotein cholesterol; FPG: fasting plasma glucose; HUA: hyperuricemia; ALT: alanine aminotransferase; AST: aspartate aminotransferase; LDL-C: low-density lipoprotein cholesterol; TC: total cholesterol; UA: uric acid; Hb: hemoglobin; PLT: platelets; NAFLD: non-alcoholic fatty liver disease; BMI: body mass index.
In the study population, most individuals remained in their original state during follow-up. The S1 group exhibited the highest stability, with 89.61% remaining in S1, while only 2.77% progressed to S2 and 7.61% to S3. The S2 group showed greater variability, with 48.36% remaining in S2, 28.02% reverting to S1, and 23.61% progressing to S3. The S3 group was relatively stable, with 77.30% staying in S3, 18.98% reverting to S1, and 3.72% transitioning to S2.
There were notable differences in state transitions between genders. A higher proportion of females in the S1 group remained healthy compared to males (93.76% vs. 83.52%), whereas males in S1 were more likely to progress to S3 (12.59% vs. 4.23%). Additionally, females in the S3 group were more likely to revert to S1 compared to males (21.33% vs. 18.18%). As shown in Table 2.
Transition frequencies between different NAFLD states.
| Pre-transfer state | Post-transfer state (times/n %) | |||
|---|---|---|---|---|
| S1 | S2 | S3 | ||
| Total population | S1 | 33,248/37,101 (89.61) | 1,029/37,101 (2.77) | 2,824/37,101 (7.61) |
| S2 | 788/2,812 (28.02) | 1,360/2,812 (48.36) | 664/2,812 (23.61) | |
| S3 | 2,497/13,156 (18.98) | 489/13,156 (3.72) | 10,170/13,156 (77.30) | |
| Male | S1 | 12,534/15,008 (83.52) | 584/15,008 (3.89) | 1,890/15,008 (12.59) |
| S2 | 489/1,779 (27.49) | 842/1,779 (47.33) | 448/1,779 (25.18) | |
| S3 | 1,787/9,828 (18.18) | 297/9,828 (3.02) | 7,744/9,828 (78.80) | |
| Female | S1 | 20,714/22,093 (93.76) | 445/22,093 (2.01) | 934/22,093 (4.23) |
| S2 | 299/1,033 (28.94) | 518/1,033 (50.15) | 216/1,033 (20.91) | |
| S3 | 710/3,328 (21.33) | 192/3,328 (5.77) | 2,426/3,328 (72.90) | |
Transition frequencies between NAFLD states during follow-up. Values are expressed as times/n (%), row-wise. S1 (healthy state); S2 (NAFLD, BMI < 24 kg/m2); S3 (NAFLD, BMI ≥ 24 kg/m2). NAFLD: non-alcoholic fatty liver disease; BMI: body mass index.
The average residence time in S1 for the total population was 11.12 years (95% CI: 10.77–11.47). For males, it was 6.97 years (95% CI: 6.69–7.25), while females had a significantly longer average of 18.58 years (95% CI: 17.61–19.55). In S2, the average residence time for the total population was 2.22 years (95% CI: 2.11–2.34). Males had an average of 2.20 years (95% CI: 2.06–2.35), and females had a slightly longer average of 2.26 years (95% CI: 2.08–2.46). For S3, the average residence time for the total population was 5.01 years (95% CI: 4.83–5.19). Males had an average of 5.37 years (95% CI: 5.14–5.60), while females had a shorter average of 4.18 years (95% CI: 3.91–4.46). As shown in Table 3.
Mean residence time in different NAFLD states (years) with 95% CIs.
| State | Total population | Male | Female |
|---|---|---|---|
| S1 | 11.12 (10.77–11.47) | 6.97 (6.69–7.25) | 18.58 (17.61–19.55) |
| S2 | 2.22 (2.11–2.34) | 2.20 (2.06–2.35) | 2.26 (2.08–2.46) |
| S3 | 5.01 (4.83–5.19) | 5.37 (5.14–5.60) | 4.18 (3.91–4.46) |
S1 (healthy state); S2 (NAFLD, BMI < 24 kg/m2); S3 (NAFLD, BMI ≥ 24 kg/m2). Values represent mean residence time (years) with 95% CIs in parentheses. NAFLD: non-alcoholic fatty liver disease; BMI: body mass index.
In males, progression from S1 to S2 was significantly associated with age (HR = 1.277, 95% CI: 1.146–1.422), HUA (HR = 1.411, 95% CI: 1.176–1.693), elevated TG (HR = 1.946, 95% CI: 1.607–2.357), low HDL-C (HR = 1.314, 95% CI: 1.066–1.618), and elevated FPG (HR = 1.331, 95% CI: 1.075–1.648), while abdominal obesity appeared protective (HR = 0.486, 95% CI: 0.380–0.622). For the transition from S1 to S3, multiple factors contributed, notably HUA, abdominal obesity, elevated TG, low HDL-C, elevated BP, and elevated FPG. In progression from S2 to S3, abdominal obesity remained a major contributor.
In females, age (HR = 1.673, 95% CI: 1.483–1.889), elevated TG (HR = 2.013, 95% CI: 1.528–2.651), low HDL-C (HR = 1.878, 95% CI: 1.535–2.297), and elevated FPG (HR = 1.701, 95% CI: 1.289–2.244) were key factors for S1→S2 progression. For the S1→S3 transition, age, HUA, abdominal obesity (HR = 5.741, 95% CI: 4.910–6.712), elevated TG, low HDL-C, and elevated BP were prominent contributors. HUA and low HDL-C were also important for S2→S3 progression. Detailed HRs and CIs are presented in Table 4.
Influence factors affecting the progress of the S1→S2→S3 direction.
| Variables | Male | Female | ||||
|---|---|---|---|---|---|---|
| S1→S2 | S1→S3 | S2→S3 | S1→S2 | S1→S3 | S2→S3 | |
| Age (year) | 1.277 (1.146–1.422) | 0.976 (0.916–1.039) | 0.900 (0.790–1.024) | 1.673 (1.483–1.889) | 1.291 (1.185–1.407) | 1.029 (0.861–1.230) |
| HUA | 1.411 (1.176–1.693) | 1.392 (1.261–1.536) | 1.114 (0.919–1.351) | 1.048 (0.723–1.520) | 1.488 (1.214–1.823) | 1.577 (1.148–2.167) |
| Abdominal obesity | 0.486 (0.380–0.622) | 3.168 (2.878–3.487) | 1.381 (1.105–1.728) | 0.713 (0.459–1.106) | 5.741 (4.910–6.712) | 1.308 (0.878–1.947) |
| Elevated TG | 1.946 (1.607–2.357) | 1.409 (1.266–1.567) | 1.035 (0.848–1.263) | 2.013 (1.528–2.651) | 1.563 (1.296–1.888) | 1.105 (0.824–1.483) |
| Low HDL-C | 1.314 (1.066–1.618) | 1.286 (1.151–1.438) | 0.949 (0.765–1.177) | 1.878 (1.535–2.297) | 1.756 (1.530–2.016) | 1.351 (1.018–1.794) |
| Elevated BP | 0.968 (0.813–1.153) | 1.204 (1.096–1.322) | 0.890 (0.732–1.082) | 1.181 (0.920–1.518) | 1.378 (1.170–1.624) | 0.807 (0.586–1.112) |
| Elevated FPG | 1.331 (1.075–1.648) | 1.161 (1.029–1.309) | 0.867 (0.689–1.095) | 1.701 (1.289–2.244) | 1.219 (0.994–1.496) | 0.758 (0.534–1.075) |
| ALT | 1.013 (1.006–1.019) | 1.013 (1.009–1.017) | 1.003 (0.995–1.010) | 1.012 (1.006–1.017) | 1.015 (1.010–1.019) | 0.997 (0.983–1.011) |
| AST | 0.984 (0.968–0.999) | 0.982 (0.973–0.991) | 0.996 (0.985–1.007) | 0.983 (0.968–0.998) | 0.975 (0.962–0.989) | 1.017 (0.992–1.043) |
| Hb | 0.998 (0.990–1.006) | 1.005 (1.001–1.010) | 1.002 (0.992–1.012) | 1.005 (0.996–1.013) | 1.003 (0.998–1.008) | 1.010 (0.997–1.023) |
| PLT | 1.002 (1.001–1.004) | 1.001 (1.001–1.002) | 1.000 (0.998–1.000) | 1.002 (1.001–1.004) | 1.005 (1.004–1.006) | 1.001 (0.999–1.003) |
S1 (healthy state); S2 (NAFLD, BMI < 24 kg/m2); S3 (NAFLD, BMI ≥ 24 kg/m2). Binary covariates (HUA, abdominal obesity, elevated TG, low HDL-C, elevated BP, elevated FPG) use absence as a reference. Continuous covariates (ALT, AST, Hb, PLT) are treated as continuous. Age was categorized with < 30 years as the reference. Bold values indicate P < 0.05. HUA: hyperuricemia; TG: triglycerides; HDL-C: high-density lipoprotein cholesterol; BP: blood pressure; FPG: fasting plasma glucose; ALT: alanine aminotransferase; AST: aspartate aminotransferase; Hb: hemoglobin; PLT: platelets; NAFLD: non-alcoholic fatty liver disease; BMI: body mass index.
In males, recovery from advanced NAFLD states was influenced by several factors. In the S3→S1 stage, age (HR = 0.935, 95% CI: 0.875–0.999), abdominal obesity (HR = 0.725, 95% CI: 0.656–0.801), elevated TG (HR = 0.782, 95% CI: 0.708–0.864), low HDL-C (HR = 0.901, 95% CI: 0.812–0.999), elevated FPG (HR = 0.874, 95% CI: 0.781–0.979), and ALT (HR = 0.990, 95% CI: 0.986–0.993) were negatively associated with recovery. In the S3→S2 stage, abdominal obesity markedly inhibited recovery (HR = 0.223, 95% CI: 0.176–0.284), while age was positively associated (HR = 1.302, 95% CI: 1.113–1.522). In the S2→S1 stage, ALT was negatively associated, and AST was positively associated with recovery.
In females, age (HR = 0.719, 95% CI: 0.650–0.796), abdominal obesity (HR = 0.732, 95% CI: 0.628–0.852), elevated TG (HR = 0.770, 95% CI: 0.646–0.919), elevated FPG (HR = 0.768, 95% CI: 0.631–0.937), ALT (HR = 0.989, 95% CI: 0.982–0.997), and hemoglobin (Hb) (HR = 0.990, 95% CI: 0.984–0.996) were negatively associated with S3→S1 recovery. In the S3→S2 stage, age positively influenced recovery (HR = 1.435, 95% CI: 1.187–1.734), whereas abdominal obesity was inhibitory. For the S2→S1 transition, age, elevated TG, and low HDL-C were negatively associated with recovery. Detailed results are presented in Table 5.
Influence factors affecting the progress of the S3→S2→S1 direction.
| Variables | Male | Female | ||||
|---|---|---|---|---|---|---|
| S2→S1 | S3→S1 | S3→S2 | S2→S1 | S3→S1 | S3→S2 | |
| Age (year) | 1.032 (0.914–1.165) | 0.935 (0.875–0.999) | 1.302 (1.113–1.522) | 0.771 (0.661–0.900) | 0.719 (0.650–0.796) | 1.435 (1.187–1.734) |
| HUA | 0.933 (0.771–1.129) | 0.926 (0.841–1.021) | 0.890 (0.700–1.131) | 0.796 (0.554–1.145) | 0.940 (0.787–1.122) | 1.294 (0.945–1.770) |
| Abdominal obesity | 0.807 (0.629–1.036) | 0.725 (0.656–0.801) | 0.223 (0.176–0.284) | 1.089 (0.734–1.617) | 0.732 (0.628–0.852) | 0.333 (0.244–0.455) |
| Elevated TG | 0.840 (0.692–1.020) | 0.782 (0.708–0.864) | 1.025 (0.806–1.305) | 0.729 (0.544–0.977) | 0.770 (0.646–0.919) | 1.132 (0.830–1.545) |
| Low HDL-C | 0.988 (0.799–1.222) | 0.901 (0.812–0.999) | 0.889 (0.689–1.148) | 0.785 (0.618–0.997) | 0.902 (0.772–1.054) | 0.965 (0.713–1.308) |
| Elevated BP | 0.854 (0.708–1.031) | 0.958 (0.871–1.053) | 0.941 (0.745–1.187) | 0.999 (0.757–1.321) | 1.158 (0.986–1.360) | 0.817 (0.598–1.116) |
| Elevated FPG | 0.880 (0.705–1.098) | 0.874 (0.781–0.979) | 1.031 (0.792–1.341) | 0.974 (0.722–1.315) | 0.768 (0.631–0.937) | 1.303 (0.951–1.785) |
| ALT | 0.990 (0.980–0.999) | 0.990 (0.986–0.993) | 1.003 (0.995–1.011) | 0.989 (0.973–1.006) | 0.989 (0.982–0.997) | 1.007 (0.993–1.020) |
| AST | 1.013 (1.000–1.026) | 1.002 (0.995–1.009) | 0.997 (0.979–1.015) | 0.999 (0.970–1.029) | 1.008 (0.996–1.020) | 0.991 (0.964–1.018) |
| Hb | 0.992 (0.983–1.002) | 0.997 (0.992–1.002) | 1.005 (0.993–1.018) | 0.993 (0.984–1.002) | 0.990 (0.984–0.996) | 1.011 (0.997–1.025) |
| PLT | 0.999 (0.997–1.001) | 0.999 (0.998–1.000) | 1.001 (0.998–1.003) | 0.998 (0.996–1.000) | 0.999 (0.998–1.000) | 1.000 (0.998–1.003) |
S1 (healthy state); S2 (NAFLD, BMI < 24 kg/m2); S3 (NAFLD, BMI ≥ 24 kg/m2). Binary covariates (HUA, abdominal obesity, elevated TG, low HDL-C, elevated BP, elevated FPG) use absence as a reference. Continuous covariates (ALT, AST, Hb, PLT) are treated as continuous. Age was categorized with < 30 years as the reference. Bold values indicate P < 0.05. HUA: hyperuricemia; TG: triglycerides; HDL-C: high-density lipoprotein cholesterol; BP: blood pressure; FPG: fasting plasma glucose; ALT: alanine aminotransferase; AST: aspartate aminotransferase; Hb: hemoglobin; PLT: platelets; NAFLD: non-alcoholic fatty liver disease; BMI: body mass index.
This study employed a multi-state Markov model to predict the transition probabilities between S1, S2, and S3, focusing on the transition trends over 1, 3, and 5 years. The results showed that in the male population, the probabilities of transitioning from S1 to S2 were 4.1%, 8.1%, and 9.4% at 1, 3, and 5 years, respectively, showing a gradual increase. The probabilities of transitioning from S1 to S3 were 9.4%, 22.5%, and 30.6%, also increasing over time. Similarly, the probabilities of transitioning from S2 to S3 were 12.9%, 27.8%, and 35.0%, showing a consistent upward trend. As shown in Figure 3.
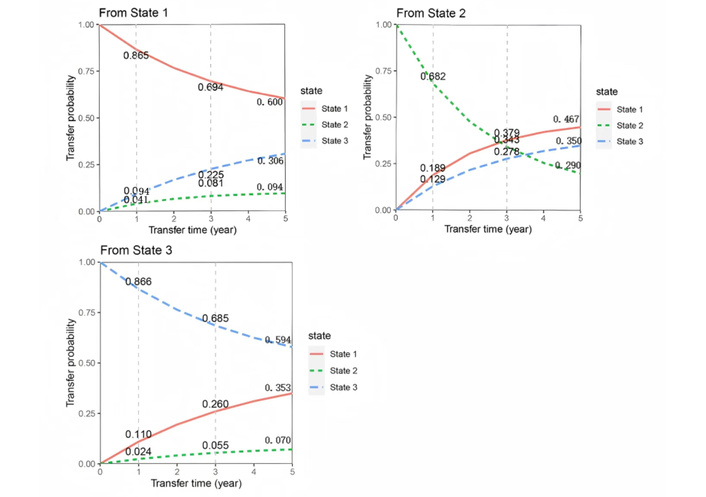
Predicted transition probabilities for different states in the male cohort based on the multi-state Markov model.
In contrast, in the female population, the probabilities of transitioning from S1 to S2 were 2.9%, 5.8%, and 7.4%, showing a steady increase. The probabilities of transitioning from S1 to S3 were 2.7%, 7.4%, and 10.5%, also increasing gradually. The probabilities of transitioning from S2 to S3 in females were 7.6%, 15.1%, and 17.6%, demonstrating a consistent increase as well. As shown in Figure 4.
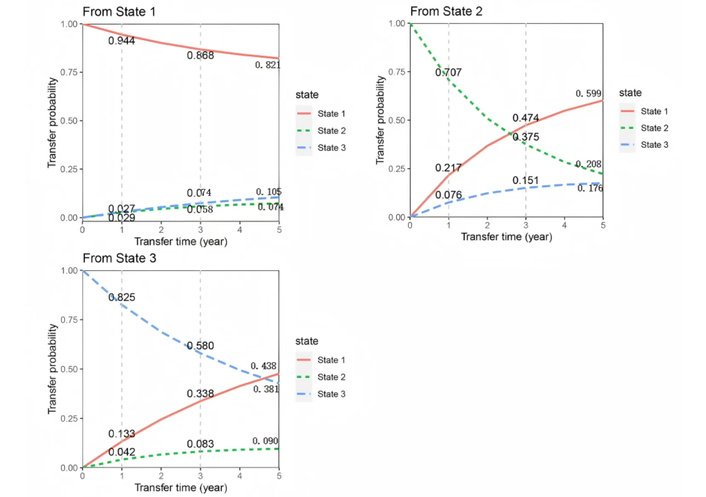
Predicted transition probabilities for different states in the female cohort based on the multi-state Markov model.
Overall, males were more likely to transition from S1 to S3, with a faster transition rate, while females tended to remain in S1. Furthermore, although both males and females showed an increasing probability of transitioning from S2 to S3 over time, females transitioned back to S1 relatively faster.
This study, based on a multi-state Markov model, extensively explored the transition process of NAFLD across three stages according to BMI classification and revealed the significant role of gender differences in NAFLD progression and recovery. Our findings show that gender significantly influences the disease course of NAFLD, with faster progression in males and a higher recovery probability in females. Moreover, factors such as abdominal obesity, metabolic abnormalities (e.g., elevated TG, low HDL-C, elevated FPG), and age play crucial roles in the progression and recovery of NAFLD. Additionally, by predicting the transition probabilities between different NAFLD states, we further explored the disease course changes during follow-up.
Firstly, gender differences are particularly evident in NAFLD progression. It was found that NAFLD progresses faster in males, especially in the transition from S1 to S3, with males showing a much faster progression than females. In males, abdominal obesity, elevated TG, low HDL-C, and elevated FPG are major contributing factors. Abdominal obesity, as an independent risk factor for NAFLD progression, is particularly prominent in males. Visceral fat accumulation not only increases insulin resistance but also exacerbates liver injury through inflammatory responses, thus promoting the worsening of NAFLD [31]. Elevated TG and low HDL-C, representing lipid metabolism abnormalities, are also key drivers of NAFLD progression, leading to fat accumulation in the liver and further exacerbating hepatic metabolic stress [32]. In contrast, NAFLD progresses more slowly in females. Although factors like elevated TG, low HDL-C, and elevated FPG also promote NAFLD progression in females, their impact is weaker compared to males. We further performed an age-stratified analysis in females (< 50 vs. ≥ 50 years, roughly corresponding to pre-menopause and post-menopause), and the results showed that premenopausal females had the longest S1 sojourn time (21.3 years), whereas postmenopausal females had a significantly shorter S1 sojourn time of 10.2 years, with males generally showing shorter S1 durations. These findings suggest that hormonal changes and other physiological alterations after menopause may shorten the S1 duration and accelerate NAFLD progression in females. Furthermore, females exhibit lower transition probabilities from S1 to S3, which may be related to more favorable fat distribution and higher estrogen levels. Studies have shown that fat in females is primarily distributed subcutaneously, whereas males tend to accumulate fat in the visceral region [33]. This difference in fat distribution may influence the progression of NAFLD. Additionally, estrogen is considered to have a protective effect, as it can improve lipid metabolism and reduce inflammatory responses, thereby slowing the progression of NAFLD. Postmenopausal estrogen decline may lead to increased central adiposity and less favorable lipid and glucose profiles, further shortening S1 duration and increasing disease progression risk. Estrogen may inhibit fat accumulation in the liver by improving lipid metabolism and enhancing insulin sensitivity, thus delaying NAFLD progression [34, 35].
Gender differences are also significant in the recovery process of NAFLD. The study suggests that females show a higher recovery probability when transitioning from S3 (advanced stage) to S1 (healthy state). This result may be linked to females’ metabolic characteristics, hormone levels, and fat distribution. Estrogen not only aids in improving lipid metabolism but may also provide protective effects against hepatic fat deposition and inflammatory responses, giving females an advantage over males in NAFLD recovery [36]. However, significant metabolic disturbances remain during recovery. Both males and females are affected by abdominal obesity, a key factor inhibiting NAFLD recovery. Abdominal fat, especially visceral fat, is not only an independent risk factor for NAFLD but also one of the strongest barriers during recovery [37]. The study also found that elevated TG, low HDL-C, and elevated FPG negatively impact NAFLD recovery in both males and females. Elevated TG and low HDL-C, important markers of lipid metabolism disorders, may impede NAFLD reversal by exacerbating hepatic fat deposition and inflammation [38, 39]. As for liver function indicators, ALT and AST play significant roles in NAFLD recovery. For males, ALT is negatively correlated, while AST shows a positive correlation with recovery from S2 to S1. ALT and AST are biomarkers of liver injury, reflecting liver function status and repair processes [40]. High ALT may indicate ongoing liver damage, hindering NAFLD recovery, while elevated AST may be associated with improved liver metabolism and repair capacity.
This study further reveals the dual role of age and metabolic abnormalities (such as elevated FPG, elevated TG, low HDL-C, and abdominal obesity) in both NAFLD progression and recovery. Age, as a significant influencing factor, shows different effects in males and females regarding NAFLD progression. In males, age promotes the transition from S1 to S2; however, in females, age has a more pronounced effect, particularly in the transition from S1 to S3. Increasing age may be accompanied by a decline in metabolic capacity, thus promoting disease progression [41]. Abdominal obesity, a core risk factor for NAFLD, exerts a strong impact on both males and females [42]. In males, abdominal obesity not only accelerates the transition from S1 to S3 but also induces a series of metabolic abnormalities via visceral fat, further worsening NAFLD progression. In females, abdominal obesity is also a negative factor, with its inhibitory effect on NAFLD recovery being most evident during the transition from S3 to S2. This highlights the pivotal role of abdominal obesity in gender differences, influencing both NAFLD progression and recovery.
Recently, glucagon-like peptide-1 receptor agonists (GLP-1 RAs) have shown significant therapeutic potential in the management of type 2 diabetes and obesity. Emerging evidence suggests that GLP-1 RAs may also have beneficial effects in patients with NAFLD. For example, a systematic review and network meta-analysis reported that GLP-1 RAs significantly reduced hepatic fat content, improved liver function parameters, and positively affected body weight and insulin sensitivity in NAFLD patients [43]. Furthermore, GLP-1 RAs may exert beneficial effects through mechanisms such as improving hepatic insulin signaling, reducing oxidative stress, and modulating the gut-liver axis [44]. These findings provide a theoretical basis for exploring GLP-1 RAs in NAFLD treatment. However, the mechanisms and long-term effects of GLP-1 RAs in NAFLD remain incompletely understood, and there is a lack of Markov-state model studies evaluating this therapy in NAFLD patients. Therefore, future studies should investigate the efficacy and safety of GLP-1 RAs in NAFLD, particularly in subgroups defined by age, gender, and obesity status, to provide more robust evidence for clinical application.
This study is primarily based on a population from Beijing, China, which may limit the generalizability of the results to other ethnic or regional populations. There may be differences in NAFLD prevalence, risk factors, and disease progression patterns across various populations and geographical regions. Although the term “NAFLD” is used throughout this study, our cohort largely corresponds to the recently proposed MASLD (Metabolic Dysfunction-Associated Steatotic Liver Disease) and MASH (Metabolic Dysfunction-Associated Steatohepatitis) criteria, which emphasize the role of metabolic dysfunction as the underlying cause. Furthermore, given that our study population is primarily from Beijing, China, caution should be taken when generalizing these findings to other regions or ethnic groups. Comparison with other East Asian cohorts suggests that the prevalence and risk factors of NAFLD/MASLD may differ due to regional lifestyle, dietary habits, and genetic backgrounds. Future studies are warranted to validate these findings in broader populations and to explore potential variations in disease progression and recovery.
Although potential confounding factors were controlled as much as possible, studies based on follow-up data cannot completely eliminate the influence of unmeasured confounders such as diet, physical activity, and genetic factors. Moreover, as the study population included individuals undergoing regular health checks and no liver biopsies were performed, the lack of invasive procedures reduces the ability to fully understand NAFLD progression, particularly in terms of directly assessing hepatic histological changes. Another limitation is that the diagnosis of NAFLD was based on ultrasonography, which is operator-dependent and has limited sensitivity for mild steatosis. Although standardized protocols and strict quality control measures were applied, some degree of non-differential misclassification was unavoidable. This may have resulted in underestimation of NAFLD incidence and attenuation of the observed associations. Finally, although the multi-state Markov model effectively captured the transition processes between NAFLD states, the assumption that transition probabilities depend solely on the current state, without considering early disease history or potential future interventions, may limit the model’s applicability in some cases. In addition, potential absorbing states such as death or severe liver outcomes (cirrhosis/HCC) were not included due to a lack of systematic data in this routine health check cohort. Participants who experienced these events would likely be lost to follow-up. Therefore, potential informative censoring may exist, which could affect the estimated transition probabilities between NAFLD states. Future studies with mortality and liver complication data could implement competing-risk models for a more comprehensive evaluation of NAFLD progression. Additionally, the study population is limited to Beijing, which may restrict external validity. Future studies should include other regions and ethnic groups in East Asia to confirm the generalizability of these findings.
This study reveals significant gender differences in NAFLD progression and recovery, further confirming the crucial role of gender in the disease course through the prediction of transition probabilities between different NAFLD states. Males tend to progress more rapidly from the healthy state (S1) to the severe state (S3) and show poorer recovery potential, whereas females exhibit a higher recovery probability. Abdominal obesity, metabolic abnormalities (such as elevated TG, low HDL-C, and elevated FPG), and age play vital roles in NAFLD progression and recovery. Gender differences not only affect the disease course but also provide a theoretical basis for future gender-specific, personalized treatments. Future research should further explore the interactions between these factors to offer more precise theoretical support for early intervention and personalized treatment of NAFLD.
ALT: alanine aminotransferase
AST: aspartate aminotransferase
BMI: body mass index
BP: blood pressure
FPG: fasting plasma glucose
GLP-1 RAs: glucagon-like peptide-1 receptor agonists
HDL-C: high-density lipoprotein cholesterol
HUA: hyperuricemia
MASLD: Metabolic Dysfunction-Associated Steatotic Liver Disease
MetS: metabolic syndrome
NAFLD: non-alcoholic fatty liver disease
SUA: serum uric acid
TG: triglycerides
The authors thank the data management team of the Beijing Physical Examination Center and the medical staff who collected the data.
JT: Conceptualization, Formal analysis, Validation, Writing—original draft, Writing—review & editing. HA: Conceptualization, Data curation, Formal analysis, Software, Writing—original draft. CT, XN, and TC: Data curation, Project administration. YH, SC, and LK: Data curation, Investigation, Resources. XY: Funding acquisition, Conceptualization, Supervision, Writing—review & editing. All authors have read and approved the submitted version.
The authors declare that they have no known competing financial interests or personal relationships that could have appeared to influence the work reported in this paper.
The study was approved by the Ethics Committee of Capital Medical University (approval number: 2019SY088). All procedures involving human participants were conducted in accordance with the ethical standards of the institutional and/or national research committee and with the Declaration of Helsinki.
Written informed consent was obtained from all participants.
Not applicable.
The datasets used and/or analyzed during the current study are available from the corresponding author on reasonable request.
The project is supported by a grant from the Natural Science Foundation of Beijing Municipality [grant number 7202010]. The funders had no role in study design, data collection and analysis, decision to publish, or preparation of the manuscript.
© The Author(s) 2025.
Open Exploration maintains a neutral stance on jurisdictional claims in published institutional affiliations and maps. All opinions expressed in this article are the personal views of the author(s) and do not represent the stance of the editorial team or the publisher.
Copyright: © The Author(s) 2025. This is an Open Access article licensed under a Creative Commons Attribution 4.0 International License (https://creativecommons.org/licenses/by/4.0/), which permits unrestricted use, sharing, adaptation, distribution and reproduction in any medium or format, for any purpose, even commercially, as long as you give appropriate credit to the original author(s) and the source, provide a link to the Creative Commons license, and indicate if changes were made.

View: 2893
Download: 47
Times Cited: 0
