Original Article

Affiliation:
1Department of Quality Assurance, ISF College of Pharmacy, Moga, Punjab 142001, India
ORCID: https://orcid.org/0000-0002-9044-2886
Affiliation:
2Department of Pharmaceutics, ISF College of Pharmacy, Moga, Punjab 142001, India
ORCID: https://orcid.org/0000-0001-8470-6622
Affiliation:
2Department of Pharmaceutics, ISF College of Pharmacy, Moga, Punjab 142001, India
Email: dilpreet.daman@gmail.com
ORCID: https://orcid.org/0000-0002-7563-6287
Explor Drug Sci. 2023;1:6–17 DOI: https://doi.org/10.37349/eds.2023.00002
Received: September 19, 2022 Accepted: November 08, 2022 Published: February 24, 2023
Academic Editor: Fernando Albericio, University of KwaZulu-Natal, South Africa; University of Barcelona, Spain
Aim: The aim of this research work was to develop a validated reversed-phase (RP)-high-performance liquid chromatography (HPLC) method for simultaneous estimation of oxytetracycline (OXY) and polymixin B (PMB) in fixed-dose combination.
Methods: The HPLC assay method was validated on X-Bridge C18 [250 mm × 4.6 mm intradermal (i.d.), 5 μm], mobile phase consisting of aotearoa co-incidence network (ACN):water containing 0.5% (v/v) orthophosphoric acid (pH 3.5) in the ratio of 80:20 respectively. The flow rate was set at 0.9 mL/min and the column was maintained at room temperature. The RP-HPLC method was validated in terms of the calibration curve (CC), linearity and range, limit of detection (LOD), and limit of quantitation (LOQ), precision, robustness, and accuracy.
Results: The method was found to be linear with a concentration range of 5–25 μg/mL. Precision results showed the developed method was found to be precise with a relative standard deviation [RSD (%)] value < 2. Accuracy showed acceptable recovery of prepared concentrations as per International Conference on Harmonization (ICH) guidelines. Moreover, the developed method was found to be robust and rugged, as per specified ranges. The assay of these two drugs in marketed formulation, i.e., Terramycin® Ointment showed satisfactory recovery, as per ICH guidelines. The results proved that the method can be used for the routine-based estimation of OXY and PMB.
Conclusions: Linear CC were obtained with a correlation coefficient (R2 > 0.99) with acceptable results of accuracy and precision.
The success of a pharmaceutical product relies on its qualitative analysis with a thorough validation process [1]. With the advancements in medicinal chemistry, pharmacology, and thereby the launch of new formulations, the demand for suitable testing methods has increased a lot in recent times. The acceptability of the method of analysis lies in the convenience of application and less costly approach [2]. When no conclusive approaches are available, new methodologies for evaluating novel pharmaceutical combinations are needed. Novel procedures have been developed to analyze pharmaceutical formulations with greater precision and strength. Preliminary runs are employed to optimize and validate these approaches [3]. The analytical method is an important aspect of regulatory filing in Europe and the United States, where enormous technological breakthroughs in analytical instrumentation are achieved with an emphasis on reducing analysis time without sacrificing precision and accuracy [4]. All of the new drug molecules take a too long time to have their inclusion in standard pharmacopeia books. Standards and analytical procedures for these substances and their different combinations may not be available in pharmacopeias under these circumstances [5]. As a result, new analytical procedures for these medications must be developed to assure the identification, purity, potency, and performance of drug items [6].
The validation data to support analytical procedures is collected in a planned and systematic manner by the applicant as part of the method validation process for analytical procedures. Validation is required for all analytical procedures intended for use in the analysis of clinical samples. Analytical methods are validated in accordance with International Conference on Harmonization (ICH) guidelines [7].
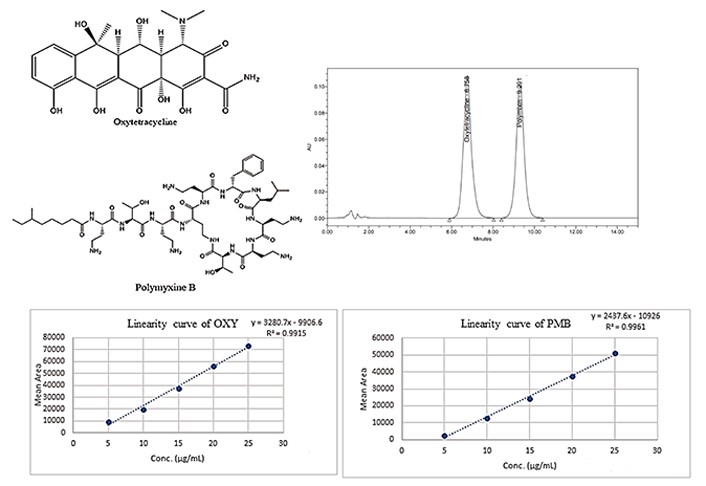
Oxytetracycline (OXY) has been engaged as an antimicrobial agent in the management of mastitis in dairy cows. As a consequence, (1) OXY is found in fairly large amounts in pasteurized milk along with other antibiotic residues. Similarly, honey is observed with considerable contents of OXY. OXY is used in the treatment of European foulbrood disease and American foulbrood disease due to Paenibacilus larvae and Streptococcus pluton bacteria, respectively. (2) The honey containing these antibiotic residues is not meant for sale in advanced countries in particular [8]. (3) Further, OXY has got a wide application in dealing with fish bacterial diseases induced by Aeromonas salmonicida, Aeromonas hydrophila, and Aeromonas sobia. (4) Polymixin B (PMB) is also used in the treatment of various bacterial diseases associated with aquatic life. The use of antibiotics becomes unavoidable in certain circumstances, but the setting up of limits on the food contents may allow these items to be consumed safely by humans. Thus, there is an immense need for accurate and precise estimation of these antibiotics in different food samples. The capacity of an analytical process to produce test results that are directly proportional to the concentration (quantity) of analyte in the sample (within a specific range) is known as linearity. The robustness of an analytical procedure is a measure of its ability to remain unaffected by modest but deliberate changes in method parameters, and it indicates its dependability in everyday use [9]. Combination products, commonly known as fixed-dose drug combinations (FDCs), are single dose pharmaceutical formulations that combine two or more active medications. A new investigational drug in conjunction with an existing drug or two or more novel entities could also be included in the FDC formulation. FDC drugs are frequently utilized to treat single or numerous diseases. Patients are benefited from FDC products because they simplify dosing and lower prescription costs [9].
OXY is a wide-spectrum antibiotic that belongs to the tetracycline family [10, 11]. However, as these medications leave residues in milk or meat that might be directly poisonous or induce allergic reactions in some hypersensitive individuals, their use has become a severe problem in terms of infectious illnesses. Even more importantly, low-dose antibiotics in foods taken over long periods can cause problems with the proliferation of drug-resistant bacteria [12]. Different techniques are commonly used as screening methods to identify tetracycline residues in food [13], but these approaches lack specificity, give only semi-quantitative assessments of residues identified and can produce false positives. High-performance liquid chromatography (HPLC) with diode array detector (DAD) [14] and fluorimetric [15] detection has been employed for quantitative tetracycline determinations, but some chromatographic techniques are suited for multi-residue analysis [16, 17]. OXY and PMB are available as a fixed-dose topical gel formulation (0.5% strength) for cutaneous infections. The simultaneous presence of OXY and PMB in different food items and FDCs comprising these antibiotics insist on the requirement of a novel method of analysis for the efficient detection of these two drugs.
OXY and PMB have not been analyzed simultaneously till date. To reduce the analytical error and offer readers a good approach for determining the two antibiotics in a single injection, it hypothesized that these two drugs were estimated simultaneously. In this work, the authors have developed a simple, rapid, and precise method for the quantitative and qualitative measurement of both OXY and PMB in different samples.
OXY (3288-A) and PMB (2332-B) pure Active Pharmaceutical Ingredients were obtained as gift samples from H.L. Pharma Private Limited (India). Acetonitrile (HPLC grade) was sourced from Loba Chemie, Mumbai, while deionized water was sourced from ISF Analytical Laboratory and also met the requirements for HPLC grade. In addition, 98% (w/v) ortho-phosphoric acid (OPA, 1772-A-212) was acquired from Loba Chemie in Mumbai. Methanol (282883211) was obtained (HPLC grade) was purchased from Rankem Chemicals Private Limited, India.
The OXY and PMB ultraviolet visible (UV) spectrophotometer (UV1900i, Shimadzu, India) were determined in Acetonitrile (ACN) by preparing a standard solution comprising 10 μg/mL of each medication. Before taking the spectrophotometer, the baseline was adjusted using the blank. Spectrophotometer was obtained three times (triplicate), and the maximum wavelength for OXY was observed to be 316 nm, while PMB’s maximum wavelength was observed at 248 nm. In order to determine the isosbestic point, standard solutions of both drugs were made with a concentration of 10 μg/mL and absorbance was noted at cross wavelengths. The isosbestic point was determined by a simultaneous equation method.
A 515 HPLC pump and a 2489 UV/Visible spectrophotometer detector (Waters) constituted the HPLC system was utilized in the present study. C18 analytical column (250 mm × 4.6 mm; particle size 5 μm; Waters) with a temperature of 42°C was used to separate the drugs. Acetonitrile and HPLC grade water in different ratios were filtered and degassed, and the pH was corrected to 3.5 using OPA and sodium hydroxide (A876721). An isocratic gradient was selected for the final analysis. For both drugs, the effluent was measured at an isosbestic point of 303 nm. Several trials were carried out to set the method varying the mobile phase composition, flow rate, and pH during method development. Empower software (Version 2.1221) was used to collect the data. The optimized chromatographic conditions for the development of the OXY and PMB HPLC method has been given in Table 1.
Optimization of chromatographic conditions for reversed-phase (RP)-HPLC method
| Chromatographic parameters | Variations | Peak shape |
|---|---|---|
| Mobile phase composition (v/v) | ||
| ACN:Methanol:Water | 50:30:20 | No ideal peak |
| ACN:Water | 50:50 | Broad peak |
| 60:40 | Not symmetric | |
| 70:30 | Sharp resolved peak, tailing | |
| 80:20 | Well resolved peak | |
| pH variation | ||
| ACN:Orthophosphoric acid (pH 4.0); | 4.0 | Broad peaks |
| optimized ratio (80:20) | 3.0 | Resolved sharp peak, tailing |
| 3.5 | Sharp, well separated peaks |
The calibration curves (CCs) of standard solutions were prepared by diluting a suitable quantity of OXY stock solution with ACN as diluent. The CC standard solutions were prepared in concentrations of 5–25 μg/mL for both PMB and OXY, respectively. Baseline correction with blank was done before taking the spectrophotometer. The absorbance was measured at λmax of OXY in the same solvent mixture against a blank solution using a UV spectrophotometer. The mean absorbance was measured and a graph was plotted between concentration (x-axis) and absorbance (y-axis). The linear equation and correlation coefficient were calculated for the CC.
The system suitability parameter gives assurance that the analytical system is working properly and may give accurate and precise results [16]. Following optimization and development of the chromatographic method was done as per ICH Q2 (R1), validation of the analytical method has been done as per ICH Q2 (B). Different analytical tests like specificity, linearity, limit of detection (LOD), limit of quantitation (LOQ), accuracy, precision, robustness, and ruggedness as per standard guidelines [8].
In order to produce samples for the LOD and LOQ, the OXY and PMB stock solutions were serially diluted (as prepared). The limits of blank, quantification, and detection were determined by ACN utilizing the specified formulas and calculating them based on the standard deviation (SD) and slope of the calibration plot with these formulas 1 and 2:
Where, σ = the SD of the response; S = slope of the CC [8].Results from test samples that are linear within a specified range are directly proportional to the analyte concentration. The CC has been developed utilizing a linear progression of multiple concentrations, ranging from 5–25 μg/mL, for both OXY and PMB, respectively. By automatically zeroing the intercept at the slope’s vertices, linear regression analysis was used to determine the linearity. The least squares technique of analysis’s correlation coefficient (R2) must not be < 0.990 in order to meet the acceptance criteria.
By producing replicates of three distinct test concentrations (5 g/mL, 15 g/mL, and 25 g/mL) at 100% level, precision experiments (intraday and interday) for spectrophotometric investigations were carried out to determine the repeatability of the proposed approach. The drug amount was determined for both intraday and interday accuracy. Results were presented as relative SD [RSD (%)], with an acceptable value of < 2 being regarded as statistically significant and consistent with the suggested method’s capacity to be replicated.
Ruggedness is used to quantify the reproducibility of test results when laboratory test settings are changed, for as by using various analysts, different days, different reagents, etc. Three replicates at various concentrations for two separate analysts were created and analyzed for HPLC investigations. Results were reported as RSD (%) with an acceptable value of < 2, considering the procedure to be robust. The corresponding mean absorbance (UV) and peak area (HPLC) were noted.
Reproducibility of test findings under various temperature settings, etc., is a key component of robustness. Experiments were conducted for HPLC research by altering the flow rate, run time, and detection. The samples were made in triplicate, and the results were given as RSD (%).
Accuracy is the percentage of an analyte that was added by the test from the known amount. The approach used was to prepare concentration ranges at three distinct levels (80%, 100%, and 120%) versus a nominal concentration (25 g/mL) for HPLC analyses. Following injection, each developed concentration was evaluated and percent recovery was calculated. In triplicate, both solutions were made and tested to calculate RSD [10, 15].
The method was validated to determine active content in tablet formulation. Briefly, 0.1 g of Terramycin® Ointment (Zydus Cadila Pvt Ltd, India) was taken and diluted to prepare a linear concentration of 100 μg/mL. The prepared concentration was then analyzed by the developed UV method and simultaneously evaluated for active drug content present in the marketed formulation.
During method development, a diluted concentration of OXY and PMB in ACN (10 μg/mL) was prepared and scanned at the beer lambert range. The isosbestic point of 303 nm was observed for both drugs, respectively, using the simultaneous equation method.
The data of different trial approaches was given in Table S1–5. The optimal chromatographic settings for the present work are depicted in Table 1. Different trials were done to optimize the selection and concentration of mobile phase and optimal flow rate. In the final optimization, acetonitrile and water (pH of 3.5 adjusted with OPA) were chosen, because it was shown to offer excellent peak symmetry for both of the drugs being tested, respectively. The representative chromatograms were shown in Figure 1.
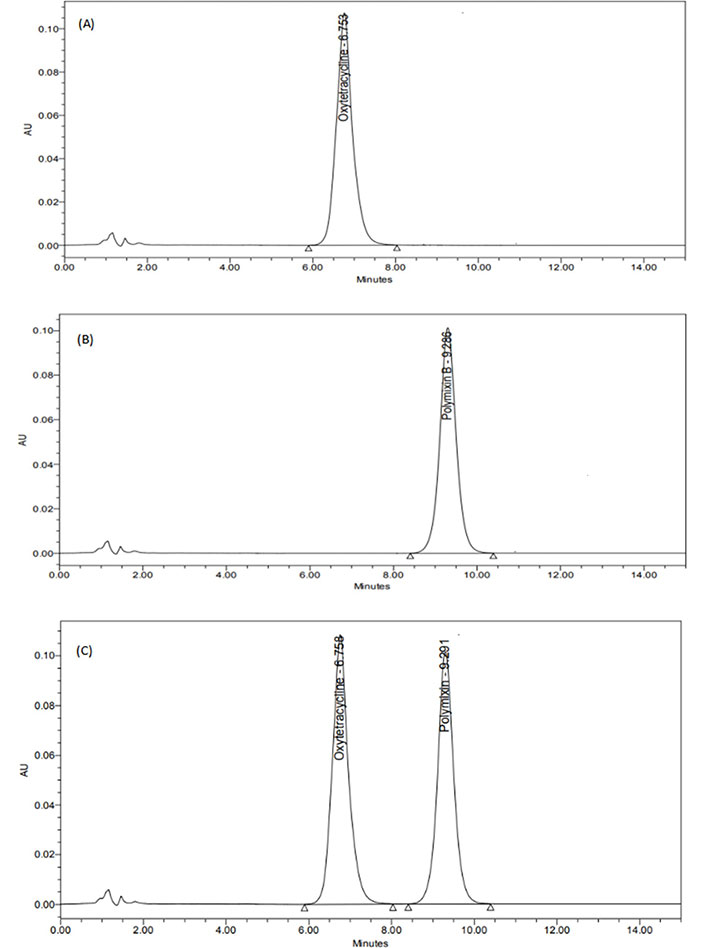
HPLC chromatogram. (A) OXY; (B) PMB; (C) simultaneous estimation of both OXY and PMB
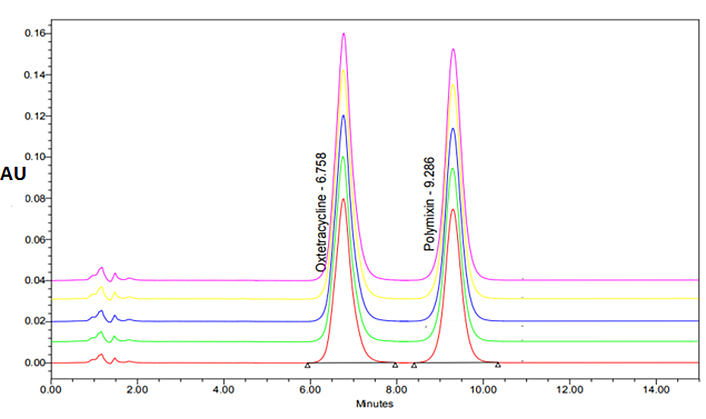
Experimental findings observed that there was a linear association in the concentration range of 5–25 μg/mL for both OXY and PMB (Figure S1). The linear concentrations developed in the investigation were well-fitted to Beer’s law. In linearity curves, the correlation coefficient and equation for OXY and PMB were, R2 = 0.991 and R2 = 0.996 and the corresponding values for the y-axis were, y = 3,280.7x – 9,906.6 and y = 2,437.6x – 10,926. The overlay plots of linear chromatograms of evaluated concentrations are given in Figure 2.
According to the final calculations, the LOD and LOQ of the current method validation process are also reported. It was observed that the LOD for OXY and PMB was 0.599 μg/mL and 0.525 μg/mL, respectively.
For the standard guidelines, the method’s sensitivity towards the analyte was found to be 100% ± 10% within the acceptability criteria, which indicates a good degree of sensitivity. The recovery study’s findings are depicted in Table 2.
Recovery studies of OXY and PMB by HPLC method
| Drugs | Nominal concentration (μg/mL) | Level of addition (%) | Concentration prepared (μg/mL) | Amount recovered (μg/mL) | RSD (%) | Recovery (%) |
|---|---|---|---|---|---|---|
| OXY | 10 | 80 | 8 | 7.55 | 1.63 | 94.41 |
| 10 | 100 | 10 | 9.44 | 1.27 | 95.6 | |
| 10 | 120 | 12 | 11.53 | 1.14 | 97.25 | |
| PMB | 10 | 80 | 8 | 7.44 | 1.67 | 94.62 |
| 10 | 100 | 10 | 9.47 | 1.34 | 96.2 | |
| 10 | 120 | 12 | 11.7 | 1.27 | 99.08 |
Three replicates of 100 percent test concentrations of OXY and PMB, ranging from 5–25 μg/mL were evaluated and results are reported in Tables 3–4 and Tables 5–6. The developed concentration shows precise results as all the evaluated concentration shows < 2 RSD (%) over a recommended validation parameter. Results concluded that the developed method is found to be precise in nature.
Interday precision and method precision studies of OXY
| Drug | Concentration (μg/mL) | Day 1 | Day 2 | Day 3 | |||
|---|---|---|---|---|---|---|---|
| Peak area (n = 3) | RSD (%) | Peak area (n = 3) | RSD (%) | Peak area (n = 3) | RSD (%) | ||
| OXY | 5 | 10,157 | 1.442 | 10,078 | 1.7 | 9,866 | 1.214 |
| 10 | 20,153 | 1.437 | 20,092 | 1.929 | 19,139 | 1.909 | |
| 15 | 40,054 | 1.241 | 39,195 | 1.677 | 39,493 | 1.587 | |
| 20 | 55,194 | 1.577 | 55,360 | 1.509 | 54,994 | 1.507 | |
| 25 | 71,819 | 1.302 | 71,259 | 1.313 | 71,028 | 1.141 | |
| Mean | - | - | 1.399 | - | 1.625 | - | 1.471 |
| Overall RSD (%) | 1.498 | ||||||
-: blank cell
Intraday precision and method precision studies of OXY
| Drug | Concentration (μg/mL) | Morning | Afternoon | Evening | |||
|---|---|---|---|---|---|---|---|
| Peak area (n = 3) | RSD (%) | Peak area (n = 3) | RSD (%) | Peak area (n = 3) | RSD (%) | ||
| OXY | 5 | 10,009 | 1.285 | 9,984 | 1.205 | 9,997 | 1.185 |
| 10 | 19,925 | 1.175 | 19,812 | 0.949 | 20,076 | 0.945 | |
| 15 | 39,080 | 1.321 | 39,135.7 | 1.103 | 39,108 | 1.026 | |
| 20 | 54,887 | 0.511 | 55,263.3 | 0.683 | 54,933 | 0.574 | |
| 25 | 71,062 | 0.597 | 71,192.7 | 0.530 | 71,113 | 0.471 | |
| Mean | - | - | 0.977 | - | 0.894 | - | 0.84 |
| Overall RSD (%) | 0.903 | ||||||
-: blank cell
Interday precision and method precision studies of PMB
| Drug | Concentration (μg/mL) | Day 1 | Day 2 | Day 3 | |||
|---|---|---|---|---|---|---|---|
| Peak area (n = 3) | RSD (%) | Peak area (n = 3) | RSD (%) | Peak area (n = 3) | RSD (%) | ||
| PMB | 5 | 2,892 | 0.856 | 2,921 | 0.977 | 2,864 | 0.918 |
| 10 | 12,027 | 0.838 | 11,850 | 0.843 | 11,800 | 0.856 | |
| 15 | 24,487 | 0.981 | 24,649 | 0.922 | 24,599 | 0.991 | |
| 20 | 39,297 | 0.890 | 39,504 | 0.878 | 39,512 | 0.870 | |
| 25 | 50,486 | 0.711 | 50,507 | 0.863 | 50,328 | 0.970 | |
| Mean | - | - | 0.855 | - | 0.896 | - | 0.921 |
| Overall RSD (%) | 0.890 | ||||||
-: blank cell
Intraday precision and method precision studies of PMB
| Drug | Concentration (μg/mL) | Morning | Afternoon | Evening | |||
|---|---|---|---|---|---|---|---|
| Peak area (n = 3) | RSD (%) | Peak area (n = 3) | RSD (%) | Peak area (n = 3) | RSD (%) | ||
| PMB | 5 | 2,864 | 0.918 | 2,893 | 0.909 | 2,854 | 0.957 |
| 10 | 11,800 | 0.856 | 11,877 | 0.875 | 11,879 | 0.88 | |
| 15 | 24,599 | 0.991 | 24,649 | 0.922 | 24,606 | 0.939 | |
| 20 | 39,512 | 0.87 | 39,504 | 0.878 | 39,567 | 0.997 | |
| 25 | 50,328 | 0.97 | 50,507 | 0.863 | 50,437 | 0.751 | |
| Mean | - | - | 0.921 | - | 0.889 | - | 0.904 |
| Overall RSD (%) | 0.904 | ||||||
-: blank cell
There are a number of ways to determine robustness, including varying flow rate (± 0.2 mL/min) and adjusting pH (3.5–4.0), adjusting wavelength (± 2 nm), and evaluating how this affects method sensitivity and efficacy. The final RSD (%) values of robustness studies after changing the minor proportions in optimized conditions are given in Tables 7–8. Results indicated that the RSD (%) values were in the acceptable ranges, suggesting that the developed method was found to be rugged [18].
Summary of OXY and PMB results by robustness method
| Parameters | Attributes | 301 nm | 303 nm | 305 nm | Mean | ± SD | RSD (%) | |
|---|---|---|---|---|---|---|---|---|
| Variable conditions for OXY | Effect of change in | 5 μg/mL | 10,279 | 9,989 | 9,984 | 10,084 | 168.893 | 1.674 |
| wavelength | 15 μg/mL | 38,674 | 39,998 | 39,554 | 39,408.67 | 673.858 | 1.709 | |
| 25 μg/mL | 70,468 | 71,885 | 71,926 | 71,426.33 | 830.194 | 1.162 | ||
| Mean | 1.515 | |||||||
| Variable conditions for PMB | Effect of change | 5 μg/mL | 2,871 | 2,911 | 2,857 | 2,879.67 | 28.023 | 0.973 |
| inwavelength | 15 μg/mL | 24,313 | 242,83 | 24,656 | 24,417.3 | 207.235 | 0.848 | |
| 25 μg/mL | 50,889 | 50,225 | 50,985 | 50,699.7 | 413.866 | 0.816 | ||
| Mean | 0.879 | |||||||
Summary of OXY and PMB results by ruggedness method
| Parameters | Attributes | 0.7 (mL/min) | 0.9 (mL/min) | 1.1 (mL/min) | Mean | ± SD | RSD (%) | |
|---|---|---|---|---|---|---|---|---|
| Variable conditions for OXY | Effect of change in | 5 μg/mL | 9,969 | 9,899 | 10,224 | 10,030.67 | 171.05 | 1.705 |
| flow rate (mL/min) | 15 μg/mL | 38,504 | 38,610 | 39,754 | 38,956 | 693.117 | 1.779 | |
| 25 μg/mL | 70,268 | 71,991 | 71,984 | 71,414.33 | 992.76 | 1.39 | ||
| Mean | 1.624 | |||||||
| Overall RSD (%) | 1.569 | |||||||
| Variable conditions for PMB | Effect of change in | 5 μg/mL | 2,825 | 2,846 | 28,770 | 2,849.33 | 26.159 | 0.918 |
| flow rate (mL/min) | 15 μg/mL | 24,323 | 24,384 | 24,743 | 24,483.33 | 226.936 | 0.926 | |
| 25 μg/mL | 50,965 | 50,195 | 50,376 | 50,512 | 402.612 | 0.797 | ||
| Mean | 0.880 | |||||||
| Overall RSD (%) | 0.879 |
For the marketed formulation, an assay was performed to check the purity of each drug in the formulation and the percentage purity of the drug was calculated. Percentage purity for OXY and PMB was found to be 99.6% and 89%, respectively. On the consideration of the value of SD, there is no interference of excipients in the assessment of drugs [19]. The summary of validation parameters is given in Table 9. The results of the assay determination are shown in Table 10.
Summary of validation parameters for HPLC method
| Validation parameters | OXY | PMB |
|---|---|---|
| Absorption maxima (λ max; nm) | 303 | |
| Linearity and range (μg/mL) | 5–25 | |
| Coefficient of determination (R2) | 0.9915 | 0.9961 |
| Regression equation (y) | 3,280.7x – 9,906.6 | 2,437.6x – 10,926 |
| Slope (m) | 3,280.7 | 2,437.6 |
| Intercept (c) | 9,906 | 10,926 |
| LOD (μg/mL) | 0.197 | 0.173 |
| LOQ (μg/mL) | 0.599 | 0.525 |
| Precision | 1.21 | 0.89 |
| Robustness | 1.569 | 0.879 |
Assay of OXY and PMB by HPLC method
| Drug name | Drug claim (mg) | Amount found (mg) | Estimation (%) |
|---|---|---|---|
| OXY | 5 | 4.98 | 99.6 |
| PMB | 1 | 0.89 | 89 |
The liquid chromatographic method was designed and fine-tuned to ensure reproducibility and accuracy. Both the hit-and-trial approach and the polarity of the mobile phase were used as selection criteria in the process. In the early stages of the measurement of OXY and PMB, a number of solvents in varying proportions were utilized [17, 20]. Although several mixtures of organic solvents, either used in 100% concentration or in conjunction with water in varying proportions, were tried, however, the separation did not meet the required mark. Following system suitability parameters were considered for mobile phase selection which is written below:
(1) A sharp peak was observed
(2) Tailing and fronting were not observed
(3) Appropriate elution time
(4) Suitable number of theoretical plates and home-exercise therapy program (HETP)
As the longitudinal broadening is inversely proportional to the flow rate of the mobile phase system, maintaining the uniformity of the flow rate is highly important [21]. When the flow rate is too high or too low, it has an effect on the Gaussian peak and can lead to symmetry problems in the overall peak. Hence, a low mobile phase composition is able to reduce peak broadening and tailing and able to improve theoretical plates. During the final analysis, ACN: water (pH 3.5 adjusted with orthophosphoric acid) in the ratio of 80:20 (v/v) was the selected and optimal mobile phase, as it gives excellent separation of molecules and detection [22].
For a particular range of analyte concentration, a procedure’s linearity refers to its capacity to produce test findings that are directly proportional to the sample’s concentration [23]. According to the least squares method of analysis, the developed method was shown to be linear. LOD is the ability of the method to detect the lowest amount of drug and LOQ is the ability of the method to quantify the lowest amount of drug [24]. According to guidelines, LOD and LOQ are observed to be within uniform limits. Recovery experiments were conducted at 80%, 100%, and 120% of the test concentrations of both drugs to verify the method’s accuracy. It was necessary to produce the samples in triplicate and to compute the percent recovery for each sample [25]. Moreover, the robustness and ruggedness define the toughness and high sensitivity of the developed method as it doesn’t show any fluctuations through minuscule fluctuations [25, 26]. Analysis revealed RSD (%) values < 2% for the performed studies which define the corrected validation of the developed method as per ICH guidelines. For the assay determination, the active content of the marketed formulation showed an acceptable range of 90–110% in the ointment which successfully tested the acceptability of the developed method for routine analysis.
In conclusion, the RP-HPLC method has been used for the estimation of OXY and PMB in a bulk material. The method was finally optimized as: mobile Phase; ACN:water (80:20) with pH 3.5 using 0.5% (v/v) orthophosphoric acid, and flow rate: 0.9 mL/min. For both OXY and PMB, validation studies were done and RSD (%) was found to be < 2%. For the marketed product, an assay was performed to check the purity of OXY and PMB in the marketed product and the percentage purity of both drugs was calculated. Percentage estimation for OXY was found to be 98.64%, and for PMB it was found to be 90.84%. The developed HPLC method for determining OXY and PMB was simple, specific, accurate, precise, rapid, and economical, indicating its adequacy for routine pharmaceutical analysis of OXY and PMB.
ACN: aotearoa co-incidence network
CC: calibration curve
FDCs: fixed-dose drug combinations
HPLC: high-performance liquid chromatography
ICH: International Conference on Harmonization
LOD: limit of detection
LOQ: limit of quantitation
OPA: ortho-phosphoric acid
OXY: oxytetracycline
PMB: polymixin B
RP: reversed-phase
RSD: relative standard deviation
SD: standard deviation
UV: ultraviolet visible
The supplementary material for this article is available at: https://www.explorationpub.com/uploads/Article/file/10082_sup_1.pdf.
DS: Conceptualization, Investigation, Writing—original draft. TC: Conceptualization, Investigation, Writing—original draft. BDK: Validation, Writing—review & editing, Supervision.
The authors declared that they have no conflict of interest.
Not applicable.
Not applicable.
Not applicable.
Not applicable.
Not applicable.
© The Author(s) 2023.
Copyright: © The Author(s) 2023. This is an Open Access article licensed under a Creative Commons Attribution 4.0 International License (https://creativecommons.org/licenses/by/4.0/), which permits unrestricted use, sharing, adaptation, distribution and reproduction in any medium or format, for any purpose, even commercially, as long as you give appropriate credit to the original author(s) and the source, provide a link to the Creative Commons license, and indicate if changes were made.