 Original Article

Affiliation:
1Kayyali Chari for Pharmaceutical Industries, Department of Pharmaceutics, College of Pharmacy, King Saud University, Riyadh, Riyadh 12372, Saudi Arabia
ORCID: https://orcid.org/0000-0002-1276-2665
Affiliation:
1Kayyali Chari for Pharmaceutical Industries, Department of Pharmaceutics, College of Pharmacy, King Saud University, Riyadh, Riyadh 12372, Saudi Arabia
Affiliation:
1Kayyali Chari for Pharmaceutical Industries, Department of Pharmaceutics, College of Pharmacy, King Saud University, Riyadh, Riyadh 12372, Saudi Arabia
2Department of Pharmaceutics and Pharmaceutical Technology, Faculty of Pharmacy, Al-Azhar University, Assiut 71524, Egypt
Email: mhamoudah@ksu.edu.sa
ORCID: https://orcid.org/0000-0001-7535-5453
Affiliation:
1Kayyali Chari for Pharmaceutical Industries, Department of Pharmaceutics, College of Pharmacy, King Saud University, Riyadh, Riyadh 12372, Saudi Arabia
Affiliation:
2Department of Pharmaceutics and Pharmaceutical Technology, Faculty of Pharmacy, Al-Azhar University, Assiut 71524, Egypt
Affiliation:
3Department of Pharmaceutics, College of Pharmacy, Qassim University, Buraydah, Buraydah 5224, Saudi Arabia
Affiliation:
3Department of Pharmaceutics, College of Pharmacy, Qassim University, Buraydah, Buraydah 5224, Saudi Arabia
Explor Drug Sci. 2026;4:1008156 DOI: https://doi.org/10.37349/eds.2026.1008156
Received: October 09, 2025 Accepted: March 05, 2026 Published: April 01, 2026
Academic Editor: Fernando Albericio, University of KwaZulu-Natal, South Africa, Universidad de Barcelona, Spain
Aim: Bisoprolol fumarate (BF), commonly prescribed for cardiovascular conditions, is usually split to achieve specific doses. This study evaluated the effects of tablet splitting on the quality parameters of scored BF tablets from three different brands marketed in Saudi Arabia.
Methods: The products were evaluated for weight variation, content uniformity, and dissolution for intact and split tablets. A UPLC-sensitive assay was used for drug quantification.
Results: The results showed that all products lost less than 3% of its weight upon splitting, meeting the USP requirements. Content uniformity was between 85% and 115% for all products, complying with pharmacopoeial standards. Dissolution studies showed some variation between intact and split tablets. The f2 similarity factor was calculated to compare the dissolution profiles of BF from both forms. The f2 values showed a similar dissolution profile for the innovator product (f2 was 62.53), but dissimilar profiles for Generic-1 and -2 (f2 values were 48.90 and 34.43, respectively).
Conclusions: These results should be taken into consideration by healthcare professionals to avoid sub-therapeutic or toxic effects resulting from tablet splitting.
Oral delivery is the most common route of administration for drug products. All oral drug products exert systemic and/or local action in the oral cavity and/or gastrointestinal tract. Oral drug products primarily fall into two categories: solid and liquid dosage forms. Solid dosage forms include, but are not limited to, capsules, tablets, granules, lozenges, and powders. Likewise, liquid oral dosage forms include, but are not limited to, solutions, suspensions, syrups, and emulsions [1]. Tablets are unit dosage forms that offer the greatest capabilities among all oral dosage forms, providing the most precise dose and the least content variability. They are the easiest and cheapest to package in bottles or strips, and are relatively inexpensive. Besides these advantages, tablets have the best chemical and microbial stability compared to other oral dosage forms [2].
Scored tablets are designed with a groove on the tablet surface that facilitates the splitting process into equal portions. Many marketed drugs are available as scored tablets, especially the immediate-release formulations such as analgesics and nasal decongestants [3]. Many factors may affect the accuracy of the splitting, such as the hardness, shape, and size of the tablets, as well as the splitting techniques. There are three common tablet splitting techniques: by hand, with a kitchen knife, and with tablet splitting devices [4–6].
Tablet splitting offers several advantages, including cost savings by allowing patients to purchase higher-dose tablets and split them into smaller doses. It also enables dose flexibility and titration, allowing patients to adjust their dosage according to their individual needs. Additionally, splitting tablets can enhance the ease of swallowing, particularly for individuals who have difficulty swallowing whole tablets [7].
Currently, there are limited and non-harmonized regulatory requirements governing tablet scoring practices. The United States Food and Drug Administration has initiated the development of new guidance for tablet scoring. However, the concept of tablet scoring has not been thoroughly investigated, and the available data are insufficient to draw firm conclusions. There are a few published standard data from drug agencies worldwide that address this practice [5].
Tablet scoring presents both challenges and opportunities in tablet splitting, with the risk of medication errors being a major concern. Addressing these issues requires careful consideration of tablet design, manufacturing processes, and selection of excipients to ensure consistent dosing accuracy and minimize the risk of medication errors during tablet splitting. Further research is needed to better understand the impact of drug content uniformity within split tablets and to develop effective strategies to mitigate these risks [5].
Bisoprolol fumarate (BF) is a synthetic, beta-selective (cardioselective) adrenoceptor blocking agent. It is commonly used to manage cardiovascular conditions such as hypertension and chronic stable angina [8–10]. According to the American College of Cardiology and American Heart Association guidelines, BF is recommended for patients with ischemic heart disease or heart failure with reduced ejection fraction (HFrEF). In HFrEF, it is part of guideline-directed medical therapy to reduce mortality and hospitalizations [11]. BF tablets USP are available as 2.5, 5, and 10 mg scored tablets for oral administration. Physicians regularly prescribe BF as half tablets to achieve doses lower than the smallest available manufactured strength, in addition to the cost-saving potential [12]. Therefore, this issue is particularly important in the case of low-dose medications, such as BF, which are used in low-dose strengths.
The current study aims to investigate dose uniformity among BF scored tablets, ensuring that each split part contains an equal amount of the active pharmaceutical ingredient (API) using the sensitive analytical technique ultra high-performance liquid chromatography (UHPLC). The use of UHPLC provides an efficient analytical approach for assessing dose uniformity and evaluating the quality control of split tablets.
Table 1 shows the tested marketed BF tablet products. Other reagents include HPLC grade acetonitrile (Thermo Fisher Scientific, USA) and HPLC grade methanol (Thermo Fisher Scientific, USA). Distilled water was obtained from a Milli-Q water purification system (Millipore, USA). Potassium dihydrogen phosphate was purchased from BDH Laboratory (England).
Tested marketed BF tablet products.
| Brand name | Strength | Company | Lot number |
|---|---|---|---|
| BF Innovator | 10 mg | Merck (Germany) | E207341 |
| BF Generic-1 | 10 mg | Jamjoom Pharma (Saudi Arabia) | YN0314 |
| BF Generic-2 | 10 mg | Acino (Switzerland) | 2AKX009 |
BF: bisoprolol fumarate.
The analytical procedures for bisoprolol analysis were performed with a very sensitive UPLC system (Thermo Scientific, Bedford, MA, USA) with Ultimate 3000®️ binary solvent manager, using Acquity®️ UHPLC HSS T3 1.8 μm (2.1 mm × 50 mm) column, which was connected with an automated sampler and a Photodiode Array (PDA) detector. The mobile phase is composed of methanol: acetonitrile: water containing potassium dihydrogen phosphate (pH 3) in a ratio of 30:25:45, respectively, and run at a flow rate of 0.3 mL/min [13].
The assay method was validated for linearity, accuracy, and precision. The linearity analysis showed that the assay was linear in the range from 2.23 to 22.3 ppm. The accuracy was determined by calculating the % recovery. Four different drug concentrations (0, 50, 100, 150%) were added to the selected concentration (8.92 ppm), and the % recovery as well as the relative standard deviation (RSD) were calculated. Inter and intra-day precision was calculated by analyzing three different concentrations (8.92, 13.38, and 17.84 ppm). The limit of detection (LOD) and limit of quantification (LOQ) were also calculated based on the standard deviation (σ) and slope (S) as per the following equation.
The weight variation test was initiated by using a sensitive analytical balance (METTLER TOLEDO, New York, United States) to weigh 15 tablets of each brand individually. Subsequently, each tablet was halved using the hand division technique [14]. The resulting halves underwent individual weighing to detect any differences in weight resulting from splitting. This thorough evaluation facilitated the assessment of weight loss incurred during the manual division of tablets, offering valuable insights into the uniformity of scored BF tablets of various brands. Weight loss should be less than 3% according to the USP specification [10].
Tablet samples were dissolved in 30 mL of HPLC-grade methanol to obtain sample solutions. Following a 30-minute sonication period (Elma – Hans Schmidbauer GmbH & Co. KG) to ensure thorough dissolution, the solutions were diluted to a final volume of 100 mL with distilled water. Subsequently, filtration was performed. Following filtration, 0.5 mL of the solution was withdrawn and transferred to a vial, to which 0.5 mL of methanol was added. This procedure was repeated for all 30 tablet samples, consisting of 10 intact tablets and 20 split tablets. The samples underwent analysis using UPLC to accurately determine the BF content, as shown below.
In the disintegration test, six intact tablets of each brand were individually placed in distinct vessels of the dissolution tester. Furthermore, six first halves and six second halves of each tablet were arranged in separate vessels [14]. The time required for each tablet to disintegrate was recorded, and the results were represented as mean ± SD.
During the dissolution test, six intact tablets from each brand were placed in individual vessels of the dissolution apparatus II (USP-II dissolution apparatus, Pharma Test, DT 70, Germany). Each vessel contained 900 mL of water as the dissolution medium, according to the guidelines outlined in the USP [15]. Additionally, six first halves and six second halves of each tablet were placed in separate vessels. At selected time intervals (5, 10, and 20 minutes), an aliquot of 5 mL was collected from each vessel. Before analysis, the collected samples from each vessel underwent filtration using syringe filters to ensure the removal of any particulate matter or impurities. Subsequently, the filtered samples were analyzed using UPLC to determine the percentage of the drug dissolved.
One-way ANOVA and Two-way ANOVA were used to statistically analyze the obtained data. A probability value (p-value) < 0.05 was used to indicate a significant difference.
As per the ICH guidelines, the assay method was validated for linearity, accuracy, and precision.
The linearity analysis showed that the assay was linear in the range from 2.23 to 22.3 ppm. The calibration curve equation was y = 0.5377x + 0.5512. The high correlation coefficient (R2) of 0.996 indicates a good fit. The calculated LOD and LOQ were 0.0122 ppm and 0.037 ppm, respectively.
The accuracy was determined by calculating the % recovery, which ranged from 102.88% to 109.8%, with RSD below 2% (Table 2). The intra- and inter-day precision was performed using three concentrations (8.92, 13.38, and 17.84 ppm), with RSD values below 2%, indicating good repeatability and reproducibility (Table 3).
% Recoveries of BF.
| % of surplus drug added | Theoretical concentration (ppm) | Measured concentration (mean ± SD) (ppm) | % Recovery | RSD (%) |
|---|---|---|---|---|
| 0 | 8.92 | 9.59 ± 0.03 | 107.50% | 0.27 |
| 50 | 13.38 | 14.03 ± 0.01 | 104.90% | 0.08 |
| 100 | 17.84 | 19.59 ± 0.04 | 109.80% | 0.24 |
| 150 | 22.3 | 22.94 ± 0.04 | 102.88% | 0.17 |
BF: bisoprolol fumarate; RSD: relative standard deviation.
Intra-day and inter-day precision.
| BF concentration (ppm) | Intra-day precision | Inter-day precision [measured conc (ppm); RSD (%)] | |||
|---|---|---|---|---|---|
| Measured concentration (ppm) | RSD (%) | Day-1 | Day-2 | Day-3 | |
| 8.92 | 9.59 ± 0.03 | 0.27 | 9.59; 0.03 | 9.6; 0.27 | 9.6; 0.27 |
| 13.38 | 14.03 ± 0.01 | 0.08 | 14.03; 0.08 | 14.38; 0.08 | 14.38; 0.08 |
| 17.84 | 19.59 ± 0.04 | 0.24 | 19.59; 0.24 | 19.87; 0.14 | 19.87; 0.14 |
BF: bisoprolol fumarate; RSD: relative standard deviation.
The weight variation analysis of BF-innovator tablets showed a range from 0.1657 g to 0.1738 g, with an average weight of 0.170 g (Table 4). After splitting, the first halves weighed between 0.0795 g and 0.0877 g, with an average weight of 0.0841 g, while the second halves ranged from 0.0836 g to 0.0893 g, with an average weight of 0.0858 g (Table 4). The difference between the weight before and after splitting was determined by calculating the p-value, which was 0.842, indicating a negligible difference between the intact tablet’s weight and its split weight. Additionally, weight loss percentages varied from 0% to 0.2323%, with an average value of 0.1098 ± 0.0793%, which met the USP requirement stating that the percentage loss should be no more than 3%.
Weight variation of the BF-innovator before and after splitting.
| Sample No | Whole tablet (g) | 1st half (g) | 2nd half (g) | Sum of 2-halves (g) | Weight loss % |
|---|---|---|---|---|---|
| 1 | 0.1664 | 0.0795 | 0.0868 | 0.1663 | 0.0601 |
| 2 | 0.1738 | 0.0875 | 0.0863 | 0.1738 | 0.0000 |
| 3 | 0.1657 | 0.0817 | 0.0838 | 0.1655 | 0.1207 |
| 4 | 0.1705 | 0.0842 | 0.0863 | 0.1705 | 0.0000 |
| 5 | 0.1728 | 0.0862 | 0.0863 | 0.1725 | 0.1736 |
| 6 | 0.1736 | 0.0843 | 0.0893 | 0.1736 | 0.0000 |
| 7 | 0.1695 | 0.0828 | 0.0865 | 0.1693 | 0.1180 |
| 8 | 0.1722 | 0.0838 | 0.0880 | 0.1718 | 0.2323 |
| 9 | 0.1697 | 0.0826 | 0.0868 | 0.1694 | 0.1768 |
| 10 | 0.1692 | 0.0853 | 0.0836 | 0.1689 | 0.1773 |
| 11 | 0.1675 | 0.0835 | 0.0837 | 0.1672 | 0.1791 |
| 12 | 0.1716 | 0.0877 | 0.0836 | 0.1713 | 0.1748 |
| 13 | 0.1676 | 0.0823 | 0.0853 | 0.1676 | 0.0000 |
| 14 | 0.1705 | 0.0855 | 0.0848 | 0.1703 | 0.1173 |
| 15 | 0.1719 | 0.0851 | 0.0866 | 0.1717 | 0.1163 |
| Mean ± SD | 0.170 ± 0.003 | 0.0841 ± 0.002 | 0.0858 ± 0.002 | 0.1700 ± 0.003 | 0.1098 ± 0.0793P-value = 0.842 |
BF: bisoprolol fumarate.
Concerning the BF Generic-1, the whole tablet weights ranged from 0.3240 g to 0.3314 g, with an average weight of 0.3291 g (Table 5). After splitting, the weights of the first halves varied between 0.1379 g and 0.1773 g, with an average weight of 0.1638 g, while the second halves ranged from 0.1525 g to 0.1885 g, with an average weight of 0.1644 g (Table 5). The average percentage weight loss was 0.2496 ± 0.415% (Table 5).
Weight variation of BF Generic-1 before and after splitting.
| Sample No | Whole tablet (g) | 1st half (g) | 2nd half (g) | Sum of 2-halves (g) | Weight loss % |
|---|---|---|---|---|---|
| 1 | 0.3299 | 0.1773 | 0.1525 | 0.3298 | 0.0303 |
| 2 | 0.3288 | 0.1650 | 0.1638 | 0.3288 | 0.0000 |
| 3 | 0.3287 | 0.1602 | 0.1681 | 0.3283 | 0.1216 |
| 4 | 0.3240 | 0.1662 | 0.1574 | 0.3236 | 0.1234 |
| 5 | 0.3299 | 0.1630 | 0.1667 | 0.3297 | 0.0606 |
| 6 | 0.3270 | 0.1666 | 0.1555 | 0.3221 | 1.4984 |
| 7 | 0.3305 | 0.1481 | 0.1820 | 0.3301 | 0.1210 |
| 8 | 0.3296 | 0.1749 | 0.1543 | 0.3292 | 0.1213 |
| 9 | 0.3299 | 0.1649 | 0.1644 | 0.3293 | 0.1818 |
| 10 | 0.3292 | 0.1650 | 0.1640 | 0.3290 | 0.0607 |
| 11 | 0.3314 | 0.1569 | 0.1742 | 0.3311 | 0.0905 |
| 12 | 0.3304 | 0.1760 | 0.1539 | 0.3299 | 0.1513 |
| 13 | 0.3287 | 0.1653 | 0.1632 | 0.3285 | 0.0608 |
| 14 | 0.3296 | 0.1379 | 0.1885 | 0.3264 | 0.9708 |
| 15 | 0.3286 | 0.1700 | 0.1581 | 0.3281 | 0.1521 |
| Mean ± SD | 0.3291 ± 0.002 | 0.1638 ± 0.010 | 0.1644 ± 0.011 | 0.3283 ± 0.003 | 0.2496 ± 0.415P-value = 0.3 |
BF: bisoprolol fumarate.
For the BF Generic-2 product, whole tablet weights ranged from 0.1116 g to 0.1164 g, with an average of 0.1138 g (Table 6). After splitting, the first halves weighed between 0.0545 g and 0.0595 g, with an average of 0.0566 g, while the second halves ranged from 0.0551 g to 0.0596 g, with an average weight of 0.0570 g (Table 6). Statistical analysis revealed no significant difference in tablet weight before and after splitting (p-value = 0.734) (Table 6).
Weight variation of BF Generic-2 before and after splitting.
| Sample No | Whole tablet (g) | 1st half (g) | 2nd half (g) | Sum of 2-halves (g) | Weight loss % |
|---|---|---|---|---|---|
| 1 | 0.1164 | 0.0595 | 0.0569 | 0.1164 | 0 |
| 2 | 0.1145 | 0.0562 | 0.0582 | 0.1144 | 0.0873 |
| 3 | 0.1157 | 0.0560 | 0.0596 | 0.1156 | 0.0864 |
| 4 | 0.1150 | 0.0582 | 0.0567 | 0.1149 | 0.0870 |
| 5 | 0.1125 | 0.0572 | 0.0553 | 0.1125 | 0 |
| 6 | 0.1136 | 0.0558 | 0.0577 | 0.1135 | 0.0880 |
| 7 | 0.1127 | 0.0555 | 0.0571 | 0.1126 | 0.0887 |
| 8 | 0.1116 | 0.0545 | 0.0568 | 0.1113 | 0.2688 |
| 9 | 0.1124 | 0.0572 | 0.0551 | 0.1123 | 0.0890 |
| 10 | 0.1127 | 0.0558 | 0.0565 | 0.1123 | 0.3549 |
| 11 | 0.1118 | 0.0551 | 0.0564 | 0.1115 | 0.2683 |
| 12 | 0.1152 | 0.0578 | 0.0573 | 0.1151 | 0.0868 |
| 13 | 0.1146 | 0.0569 | 0.0568 | 0.1137 | 0.7853 |
| 14 | 0.1141 | 0.0570 | 0.0569 | 0.1139 | 0.1753 |
| 15 | 0.1143 | 0.0566 | 0.0577 | 0.1143 | 0 |
| Mean ± SD | 0.1138 ± 0.001 | 0.0566 ± 0.001 | 0.0570 ± 0.001 | 0.1136 ± 0.001 | 0.1136 ± 0.002P-value = 0.734 |
BF: bisoprolol fumarate.
In the disintegration test conducted at 37°C, BF Innovator tablets exhibited complete disintegration of six whole tablets within 5 minutes. Upon splitting, the first halves showed a disintegration time of 4.12 minutes, while the second halves disintegrated slightly faster, at 3.51 minutes. Similarly, BF Generic-1 tablets disintegrated completely within 6.28 minutes as whole tablets. When split, the first halves demonstrated a disintegration time of 4.12 minutes, with the second halves slightly faster at 4.02 minutes. In contrast, BF Generic-2 tablets displayed rapid disintegration, with six whole tablets disintegrating within 15 seconds. After splitting, the first halves disintegrated in 12 seconds, while the second halves took a slightly longer time of 21 seconds.
In the content uniformity test, the BF innovator product demonstrated a wide range of whole tablet content percentages, from 90.05% to 114.30%, with an average value of approximately 100.81%. Upon splitting, the average content uniformity for the first half was 110.01 ± 7.89%, and for the second half, it was 103.66 ± 11.85% (Table 7).
Content uniformity results for the BF innovator product.
| Sample No | Whole tablet content (%) | 1st half (%) | 2nd half (%) |
|---|---|---|---|
| 1 | 114.30 | 110.28 | 116.03 |
| 2 | 103.06 | 115.48 | 79.69 |
| 3 | 99.30 | 110.28 | 87.29 |
| 4 | 110.06 | 114.18 | 111.38 |
| 5 | 97.33 | 122.67 | 112.30 |
| 6 | 90.05 | 97.13 | 104.99 |
| 7 | 100.87 | 97.01 | 106.67 |
| 8 | 102.02 | 108.23 | 111.47 |
| 9 | 95.09 | 113.61 | 101.61 |
| 10 | 95.99 | 111.21 | 105.21 |
| Mean ± SD | 100.81 ± 7.15 | 110.01 ± 7.89 | 103.66 ± 11.85 |
BF: bisoprolol fumarate.
Concerning the BF Generic-1 product, the average content uniformity for the intact tablets was 90.46 ± 6.61%. After splitting, the average content uniformity was 88.60 ± 10.51% and 101.05 ± 7.94% for the first and the second halves, respectively (Table 8).
Content uniformity results for the BF Generic-1 product.
| Sample No | Whole tablet content (%) | 1st half (%) | 2nd half (%) |
|---|---|---|---|
| 1 | 94.78 | 87.17 | 99.92 |
| 2 | 85.01 | 93.94 | 106.14 |
| 3 | 89.08 | 74.96 | 106.06 |
| 4 | 96.07 | 103.80 | 106.14 |
| 5 | 103.30 | 77.52 | 95.72 |
| 6 | 83.01 | 83.17 | 81.16 |
| 7 | 82.36 | 82.97 | 101.41 |
| 8 | 88.80 | 88.42 | 107.64 |
| 9 | 94.35 | 86.51 | 100.59 |
| 10 | 87.80 | 107.53 | 105.70 |
| Mean ± SD | 90.46 ± 6.61 | 88.60 ± 10.51 | 101.05 ± 7.94 |
BF: bisoprolol fumarate.
Lastly, for the BF Generic-2 product, the average content uniformity for the intact tablets was 103.63 ± 7.04%, while the average content uniformity after splitting was 103.22 ± 4.50% and 89.96 ± 9.76% for the first and the second half, respectively (Table 9).
Content uniformity results for the BF Generic-2 product.
| Sample No | Whole tablet content (%) | 1st half (%) | 2nd half (%) |
|---|---|---|---|
| 1 | 110.39 | 96.96 | 95.96 |
| 2 | 95.10 | 107.68 | 72.41 |
| 3 | 106.62 | 100.64 | 102.38 |
| 4 | 108.15 | 98.47 | 98.68 |
| 5 | 110.30 | 107.52 | 98.39 |
| 6 | 109.65 | 104.05 | 95.63 |
| 7 | 98.91 | 99.01 | 78.91 |
| 8 | 107.80 | 110.06 | 83.95 |
| 9 | 97.65 | 106.09 | 86.69 |
| 10 | 91.73 | 101.70 | 86.60 |
| Mean ± SD | 103.63 ± 7.04 | 103.22 ± 4.50 | 89.96 ± 9.76 |
BF: bisoprolol fumarate.
Dissolution testing was performed according to the USP monograph in 900 mL of water. The monograph states that not less than 80% of the drug should be released within 20 minutes. Although both whole and split tablets dissolved more than the stated amount after 20 minutes, a significant difference was observed after the first 5 minutes. A higher BF dissolved from split tablets than from the whole tablets (85.20% vs. 75.10%), the two-tailed p-value based on the t-test was 0.018. The dissolution data for the BF innovator product, both before and after splitting, are presented in Table 10 and Figure 1. The percentage of the drug dissolved from the intact tablets reached 91.72 ± 3.36%, while the percentage of BF dissolved from the split tablets reached 87.22 ± 3.32%, both meeting the USP requirement. The results show no difference between the split and whole tablets. This can be proved by calculating the similarity dissolution parameter f2. The obtained f2 value was 62.53 (f2 ≥ 50), indicating that the two dissolution profiles are similar according to the guidelines [16].
Dissolution data of the BF innovator product, whole and divided tablets.
| Time (min) | % Dissolved whole tablets | % Dissolved 1st half | % Dissolved 2nd half | % Dissolved split tablets (1st + 2nd half) |
|---|---|---|---|---|
| 0 | 0 | 0 | 0 | 0 |
| 5 | 75.10 ± 4.05 | 97.38 ± 4.15 | 73.01 ± 8.44 | 85.20 ± 6.30 |
| 10 | 80.73 ± 5.31 | 83.78 ± 4.48 | 78.06 ± 6.70 | 80.92 ± 5.57 |
| 20 | 91.72 ± 3.36 | 88.93 ± 4.15 | 85.52 ± 2.49 | 87.22 ± 3.32 |
BF: bisoprolol fumarate.
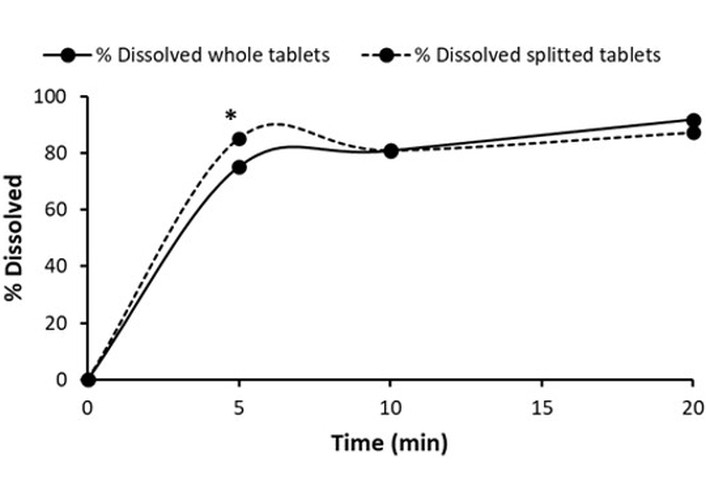
In vitro dissolution profiles of BF from intact and split innovator tablet product. * P < 0.05.
Table 11 shows the dissolution data of BF from Generic-1, before and after tablet splitting. After the first 5 minutes, the results showed a significant difference between the whole and the split tablets (93.07% vs. 75.94%, respectively), the t-test was higher than the critical two-sample paired test (25.29 vs. 2.57, respectively) with a p-value of 0.0000018. At the end of the experiment, the percentage of BF dissolved from the intact tablets was 94.75 ± 3.36%, and almost reached 100% from the split tablets. The amount of the drug dissolved before and after the splitting met the USP requirement (≥ 80% dissolved in 20 minutes). Figure 2 shows the dissolution profile of BF from intact and split tablets. Although both profiles reached similar values at the end of the run, a pronounced variation was observed after 5 minutes. The percentage of the drug dissolved from the split tablet was nearly 20% lower than that from the intact tablets. The f2 similarity factor showed that the dissolution profiles of BF from Generic-1 before and after splitting are dissimilar, with a value of 48.90.
Dissolution data of the BF Generic-1 product for whole and divided tablets.
| Time (min) | % Dissolved whole tablets | % Dissolved 1st half | % Dissolved 2nd half | % Dissolved split Tablets (1st + 2nd half) |
|---|---|---|---|---|
| 0 | 0 | 0 | 0 | 0 |
| 5 | 93.07 ± 4.95 | 74.81 ± 4.15 | 77.07 ± 8.45 | 75.94 ± 6.30 |
| 10 | 92.43 ± 5.31 | 80.95 ± 4.48 | 81.68 ± 6.70 | 81.31 ± 5.59 |
| 20 | 94.75 ± 3.36 | 86.34 ± 4.15 | 112.27 ± 2.49 | 99.31 ± 3.32 |
BF: bisoprolol fumarate.
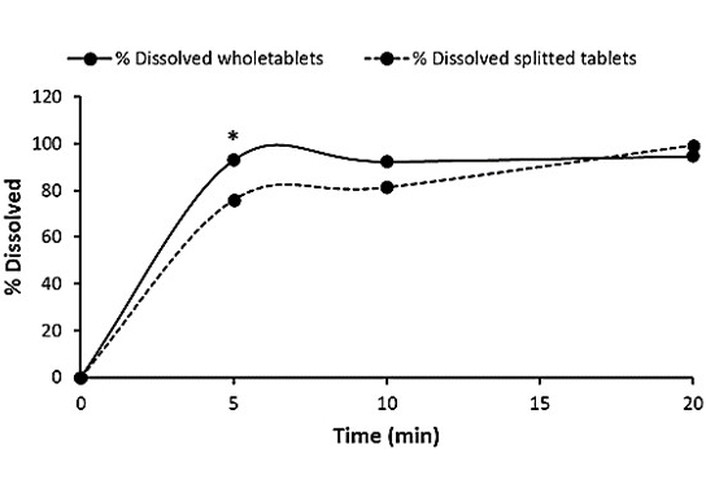
In vitro dissolution profiles of BF from the intact and split Generic-1 tablet product. * P < 0.05.
Regarding the dissolution of BF from Generic-2, Table 12 shows the data on the % dissolved before and after splitting. Although after 20 minutes, the percentage of BF dissolved from the split tablets was similar to that from the whole tablets, a significant difference in the percentage dissolved after 5 minutes [two-tailed p-value = 0.0000326, |t| is far larger than t critical (two-tailed) = 2.57]. The amount of the drug dissolved before and after the splitting met the USP requirement. Figure 3 shows the dissolution profile of BF from intact and split tablets. Although both profiles reached similar values at the end of the run, a significant variation was observed after 5 minutes. The percentage of the drug dissolved from the split tablet was 39.9% higher than that from the intact tablets. The f2 similarity factor showed that the dissolution profiles of BF from Generic-2 before and after splitting are dissimilar, with a value of 34.43.
Dissolution data of the BF Generic-2 product for whole and divided tablets.
| Time (min) | % Dissolved whole tablets | % Dissolved 1st half | % Dissolved 2nd half | % Dissolved split Tablets (1st + 2nd half) |
|---|---|---|---|---|
| 0 | 0 | 0 | 0 | 0 |
| 5 | 39.40 ± 8.45 | 88.23 ± 8.86 | 70.37 ± 12.81 | 79.30 ± 10.84 |
| 10 | 69.58 ± 12.31 | 83.24 ± 5.82 | 72.83 ± 11.65 | 78.04 ± 8.74 |
| 20 | 88.80 ± 2.00 | 90.12 ± 3.05 | 81.04 ± 2.49 | 85.58 ± 3.45 |
BF: bisoprolol fumarate.
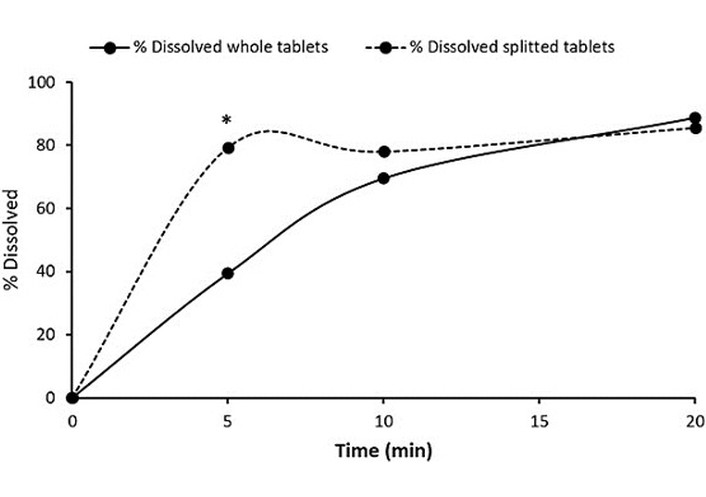
In vitro dissolution profiles of BF from intact and split Generic-2 tablet product. * P < 0.05.
In this study, a published HPLC assay for BF was applied using a sensitive UPLC. The validation analysis showed the linearity of the system used, with a high correlation and lower LOD and LOQ compared with other published assays [13, 17]. Percentage recoveries and precision results showed excellent repeatability, with RSD values below 2%, meeting the required acceptance criteria.
The % loss test measures the fragment lost during the division. From a clinical point of view, this directly impacts the administered dose taken by the patients. The ideal loss should be less than 3%; all examined products showed an ideal % loss.
The difference in the disintegration time between the products could be related to the tablet’s composition. BF Generic-1 contains polyethylene glycol, which may act as a binder, increasing the intermolecular force between the powder mixture and thus prolonging the disintegration time, but still within the acceptable range. On the other hand, BF Generic-2 contains crospovidone, which acts as a superdisintegrant, which may account for the shortest disintegration time. Moreover, the method of preparation, direct compression or wet granulation, and the uniformity of the tablet mixture blending could explain the difference between the two halves.
For content uniformity, the average values for BF innovator products and both generic products, before and after splitting, were all within the USP specified range of 85–115%. Some variation between the two halves of Generic-1 and Generic-2 tablets was observed, which could be related to the splitting process, leading to differences in individual halves [18, 19]. This is in agreement with Hill et al. [19], who found that the variation of the drug content for warfarin sodium, metoprolol succinate, and lisinopril could be due to weight variation and fragmentation that occurs during splitting.
Generally, the percentage of BF dissolved within 20 minutes is higher than the stated amount in the monograph (80%).
For more details, a statistical difference was observed in the first 5 minutes in all products. The in vitro dissolution study for Generic-1 showed a lowered dissolution rate for split halves compared to the intact one.
In contrast, a higher dissolution rate from split halves was observed compared to the intact tablets for brand and Generic-2.
This could be explained by the fact that the part of the tablet is uncoated, which facilitates the action of superdisintegrants upon contact with the surrounding media and thus enhances the disintegration and the dissolution of the drug. The calculated f2 similarity factors indicated that the dissolution profiles of the BF Innovator tablets before and after splitting were similar, but those of both generic products were dissimilar.
The quality control assessment of the BF split tablet is crucial to ensure that drug dosing and tablet properties remain unchanged, which might affect therapeutic efficacy [20]. Tablet splitting might result in unequal portions or loss of tablet mass, which might lead to dose inaccuracies [21]. This issue is particularly critical for drugs whose therapeutic effects are highly dose-dependent, including low-content APIs, such as BF.
Helmy [22] investigated the effect of tablet splitting on tablet weight and drug content uniformity for 16 cardiovascular medications (including BF) in the outpatient setting and provided recommendations for safe tablet-splitting prescribing practices. The study revealed that tablet splitting could be safer and easier when drug- and patient-specific criteria are met. In addition, it was concluded that a drug with a wide therapeutic index and long half-life may be a more appropriate candidate for tablet division.
Finally, the findings emphasize the importance of carefully evaluating the quality of scored tablets following splitting, as variations in parameters such as drug content and dissolution rate can affect therapeutic efficacy and patient safety. Healthcare professionals should be aware of these differences and consider them when prescribing or recommending split tablets to patients.
Further research into the effects of tablet splitting on other medication formulations is warranted to establish guidelines and best practices for this common practice in clinical settings. Additionally, manufacturers should strive to improve the uniformity and consistency of scored tablets to ensure reliable dosing and patient outcomes.
API: active pharmaceutical ingredient
BF: bisoprolol fumarate
HFrEF: heart failure with reduced ejection fraction
LOD: limit of detection
LOQ: limit of quantification
PDA: Photodiode Array
RSD: relative standard deviation
S: slope
UHPLC: ultra high-performance liquid chromatography
σ: standard deviation
The authors would like to express their thanks and appreciation to the Kayyali Chari of Pharmaceutical Industries, Department of Pharmaceutics, College of Pharmacy, King Saud University, Riyadh, for providing the chemicals and instruments for the study.
DHA: Conceptualization, Supervision, Validation, Writing—original draft, Writing—review & editing, Formal analysis, Visualization. NMA: Investigation, Data curation. MAI: Conceptualization, Supervision, Writing—original draft, Writing—review & editing. FKA, WAA, MAA, and HMM: Writing—original draft, Writing—review & editing. All authors read and approved the submitted version.
The authors declare that they have no conflicts of interest.
Not applicable.
Not applicable.
Not applicable.
The data that support the findings of this study are available from the corresponding author upon reasonable request.
This work is not supported by any funds.
© The Author(s) 2026.
Open Exploration maintains a neutral stance on jurisdictional claims in published institutional affiliations and maps. All opinions expressed in this article are the personal views of the author(s) and do not represent the stance of the editorial team or the publisher.
Copyright: © The Author(s) 2026. This is an Open Access article licensed under a Creative Commons Attribution 4.0 International License (https://creativecommons.org/licenses/by/4.0/), which permits unrestricted use, sharing, adaptation, distribution and reproduction in any medium or format, for any purpose, even commercially, as long as you give appropriate credit to the original author(s) and the source, provide a link to the Creative Commons license, and indicate if changes were made.

View: 1580
Download: 29
Times Cited: 0
