 Meta-Analysis

Affiliation:
1Rawalpindi Medical University, Rawalpindi 46000, Pakistan
Email: shehzadhabib923@gmail.com
ORCID: https://orcid.org/0009-0008-6626-6326
Affiliation:
1Rawalpindi Medical University, Rawalpindi 46000, Pakistan
Affiliation:
2Riphah International University, Islamabad 54000, Pakistan
Affiliation:
3Department of Community medicine, College of Medicine, Shaqra University, Dawadami 11961, Saudi Arabia
Affiliation:
4Department of Community Medicine, Jinnah Sindh Medical University, Karachi 75510, Pakistan
Affiliation:
1Rawalpindi Medical University, Rawalpindi 46000, Pakistan
Affiliation:
1Rawalpindi Medical University, Rawalpindi 46000, Pakistan
Explor Cardiol. 2026;4:101293 DOI: https://doi.org/10.37349/ec.2026.101293
Received: December 21, 2025 Accepted: January 26, 2026 Published: February 05, 2026
Academic Editor: Teresa Tsang, University of British Columbia, Canada
Background: Heart failure (HF) remains a growing global health problem, with nearly half of all cases attributed to HF with preserved ejection fraction (HFpEF) and its precursor, left ventricular diastolic dysfunction (LVDD). Although echocardiography is the diagnostic gold standard, its high cost and limited availability restrict its use for large-scale screening. In contrast, the electrocardiogram (ECG) is inexpensive and widely accessible. Recent advances in artificial intelligence (AI) have created opportunities to leverage ECG data for the early detection of cardiac dysfunction. The objective of this study was to systematically review and meta-analyze the diagnostic performance of AI-based ECG models for detecting cardiac dysfunction.
Methods: The QUADAS-2 tool was used to assess the risk of bias. Pooled sensitivity and specificity were estimated using a bivariate random-effects model, with heterogeneity quantified using the I2 statistic. Pre-specified subgroup analyses were conducted according to clinical endpoint and AI model type.
Results: Following Preferred Reporting Items for Systematic Reviews and Meta-Analyses (PRISMA) guidelines, nine eligible studies evaluating AI algorithms applied to ECG data for the detection of HFpEF were identified. Considerable methodological and population heterogeneity was observed across studies. Risk of bias was generally low for reference standards, although concerns were noted in patient selection. The pooled specificity of AI-ECG models was high at 0.83 [95% confidence interval (CI): 0.74–0.89], while pooled sensitivity was 0.82 (95% CI: 0.70–0.90). Both estimates demonstrated extremely high heterogeneity (I2 > 96%). Subgroup analyses by endpoint and model type did not explain this variability.
Discussion: AI-enhanced ECG models show good diagnostic accuracy, specifically in ruling out cardiac dysfunction due to their high specificity. However, the high and unexplained heterogeneity across these studies limits the immediate generalizability of the results. Large, prospective validation studies across diverse populations are essential before these models can be confidently adopted into routine clinical practice.
Heart failure (HF) is a life-threatening syndrome with rising global prevalence and is associated with significant morbidity, mortality, and healthcare expenditure [1–3]. Globally, HF affects an estimated 64 million individuals. Nearly half of all HF cases are now attributed to HF with preserved ejection fraction (HFpEF) [4, 5]. Moreover, with the aging of the population, the prevalence of HFpEF is expected to increase in the coming years, reflecting both increased life expectancy and the expanding proportion of older individuals in the general population [5]. The pathophysiological hallmark of HFpEF is left ventricular diastolic dysfunction (LVDD), which often develops gradually and may remain clinically silent until progression to overt HF [6]. Therefore, early diagnosis of HFpEF can play a key role in facilitating prompt initiation of drugs that reduce the burden of HF in this population [7, 8].
Currently, echocardiography serves as the gold standard for diagnosing LVDD and HFpEF, offering detailed structural and functional insights [9, 10]. However, it relies on costly equipment and specialized expertise, making it unsuitable for large-scale screening. Invasive methods, such as right heart catheterization, provide definitive confirmation of elevated filling pressures but are restricted to selected cases given their risks and costs [11]. These limitations contribute to delays in diagnosis, reducing opportunities for timely intervention.
The electrocardiogram (ECG), in contrast, is inexpensive, widely available, and noninvasive. While subtle electrical changes in HFpEF and LVDD may appear on ECGs, they often go unnoticed by conventional human interpretation. In the recent past, with the development and widespread application of artificial intelligence (AI) in medicine, we have entered a novel era of diagnosis of disease and management. The efficient processing ability of AI achieves specific goals and helps clinicians a lot in clinical decision-making. AI mainly includes machine learning (ML) and deep learning (DL), and DL consists of multiple processing layers and is capable of processing more complex data [12]. The application of AI has contributed to clinical practice in terms of aiding diagnosis [13] and early detection [14].
One area of interest that is relevant to our topic is the combination of AI with ECG for the detection of HF, which may overcome some difficulties in clinical diagnosis [15]. Several studies have specifically investigated their role in detecting HFpEF, LVDD, or raised filling pressures. However, these studies vary a lot in their design, target populations, and diagnostic endpoints. To synthesize this heterogeneous evidence, we performed a systematic review and meta-analysis to estimate the pooled diagnostic performance of AI-based ECG models for the detection of HFpEF, LVDD, and related cardiac dysfunction. HFpEF, LVDD, and elevated left ventricular filling pressures were considered related clinical manifestations along the same disease continuum. HFpEF represents the clinical syndrome, while LVDD and elevated filling pressures reflect earlier or mechanistic stages detectable by imaging or invasive assessment.
This systematic review and meta-analysis followed the Preferred Reporting Items for Systematic Reviews and Meta-Analyses (PRISMA) guidelines [16].
We included studies that (1) applied an AI or ML algorithm; (2) used ECG data (single-lead or 12-lead) as the input; (3) focused on detecting or predicting cardiac dysfunction related to impaired diastolic function, including HFpEF, LVDD, or objectively confirmed elevated filling pressures; and (4) reported sufficient data to construct a 2 × 2 contingency table. We found a total of nine studies that were available for inclusion in this analysis.
PubMed, Cochrane, CTG, and Google Scholar databases were systematically searched to identify original literature that evaluated the diagnostic accuracy of AI algorithms using ECG data for people with HFpEF. The full search strategies for all databases are provided in Supplementary materials.
Two review authors independently performed the literature search and title/abstract screening against predefined criteria, with full texts reviewed for eligibility, and the articles were excluded that were not associated with the research topic. Nine studies met the inclusion criteria and were incorporated into both qualitative and quantitative synthesis. Results of the literature search are shown in Figure 1.
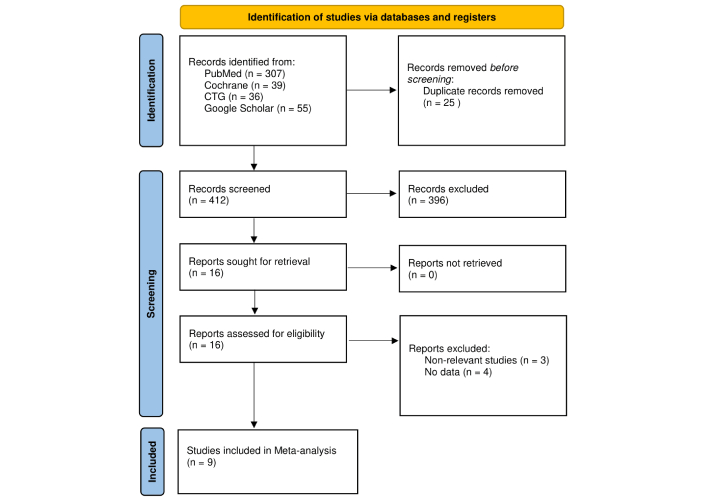
Flow diagram of the study selection process. Adapted from [16]. © Author(s) (or their employer(s)) 2019. CC BY. PRISMA: Preferred Reporting Items for Systematic Reviews and Meta-Analyses.
For each study, we extracted the first author, publication year, study design, population characteristics, AI/ML model type, diagnostic endpoint, and reported performance metrics. For the meta-analysis, we obtained or derived true positives, false positives, true negatives, and false negatives from data reported in the original publications, including confusion matrices, diagnostic accuracy tables, or reported sensitivity, specificity, and sample size. No AI models were trained or revalidated by the authors; all analyses were based exclusively on published study results.
Quality of studies was independently assessed using the QUADAS-2 tool [17], which evaluates four domains: Patient Selection, Index Test, Reference Standard, and Flow/Timing. Each was classified as low, high, or some risk of bias. Two reviewers independently performed the data extraction and quality assessment. Disagreements were resolved through discussion and independent assessment by another researcher to reach a consensus. A total of two disagreements (out of 2 assessments) were identified, all of which were resolved through consensus discussion.
Our primary outcomes were the pooled sensitivity and specificity of AI-ECG models. Sensitivity was calculated as TP/(TP + FN), representing the proportion of true disease cases correctly identified. Specificity was calculated as TN/(TN + FP), representing the proportion of non-diseased cases correctly classified. We used bivariate random-effects for meta-analysis, allowing joint estimation of sensitivity and specificity while accounting for their correlation. This approach produced a summary operating point and a hierarchical summary receiver operating characteristic (SROC) curve with 95% confidence intervals (CIs) and prediction intervals.
Heterogeneity was quantified using the I2 statistic, with values above 75% considered substantial. To explore potential sources of heterogeneity, we conducted subgroup analyses by (1) clinical endpoint (HFpEF, LVDD, or increased filling pressure) and (2) AI model type (DL vs. classical ML). All analyses were performed in R.
HFpEF, LVDD, and elevated filling pressures were analyzed together as diagnostic endpoints reflecting diastolic dysfunction, given their shared pathophysiological basis and overlapping diagnostic criteria.
The study selection process is depicted in the PRISMA flow diagram (Figure 1). Nine studies were ultimately included. They varied a lot in their designs, study populations, and methodological approaches (Table 1). A wide range of AI models were evaluated, including DL architectures such as convolutional neural networks (CNNs) and classical algorithms like Random Forest and XGBoost. ECG inputs ranged from standard 12-lead recordings to new single-lead data from smartphones and wearable patches. Clinical endpoints included the spectrum of cardiac dysfunction, including HFpEF, LVDD, and invasively confirmed elevated filling pressures.
Summary of included studies.
| Author | Year | TP | FN | FP | TN | AI/ML model type | ECG type | Primary endpoint |
|---|---|---|---|---|---|---|---|---|
| Kwon et al. [18] | 2021 | 1,320 | 388 | 1,844 | 8,403 | Deep learning | 12-lead, 6-lead, single-lead | HFpEF |
| Sengupta et al. [19] | 2018 | 107 | 26 | 9 | 46 | Classical ML | 12-lead signal-processed | Abnormal myocardial relaxation |
| Kuznetsova et al. [20] | 2022 | 30 | 1 | 5 | 214 | Classical ML | Single-lead (smartphone) | LVDD |
| Kagiyama et al. [21] | 2020 | 51 | 25 | 62 | 250 | Classical ML | 12-lead signal-processed | LVDD/Abnormal relaxation |
| Lee et al. [22] | 2024 | 18,205 | 3,678 | 13,136 | 63,744 | Deep learning | 12-lead | Increased filling pressure |
| Sabovčik et al. [23] | 2021 | 171 | 81 | 144 | 1,011 | Classical ML | 12-lead | LVDD |
| Unterhuber et al. [24] | 2021 | 93 | 1 | 44 | 65 | Deep learning | 12-lead | HFpEF |
| Schlesinger et al. [25] | 2025 | 836 | 393 | 848 | 2,543 | Deep learning | Single-lead (wearable) | Elevated mPCWP |
| Gao et al. [26] | 2025 | 43 | 17 | 16 | 41 | Deep learning | 12-lead | HFpEF risk (elevated LVEDP) |
ECG: electrocardiogram; HFpEF: heart failure with preserved ejection fraction; LVDD: left ventricular diastolic dysfunction; ML: machine learning; AI: artificial intelligence.
The QUADAS-2 evaluation is summarized in Figure 2. All nine included studies were judged to have a low risk of bias in the reference standard domain, as each employed appropriate diagnostic comparators such as guideline-based echocardiography or invasive hemodynamic assessment. In contrast, patient selection was the most frequent source of concern. Several studies relied on retrospective designs, thus limiting the representativeness of their findings. Additional concerns were noted in the flow and timing domain when subsets of participants were excluded from final analyses, as a result, introducing selection bias.
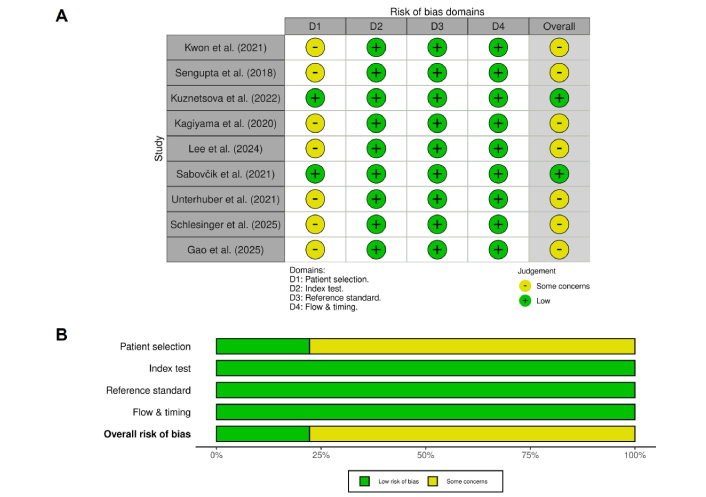
Risk of bias summary based on the QUADAS-2 assessment. Each row represents an included study, and columns represent the four domains of the QUADAS-2 tool (D1: patient selection, D2: index test, D3: reference standard, D4: flow & timing). Green indicates a low risk of bias, while yellow indicates some concerns.
Forest plots of individual study estimates for sensitivity and specificity are shown in Figures 3 and 4. Reported sensitivities varied widely, ranging from 0.67 to 0.99 while specificities ranged from 0.60 to 0.98.
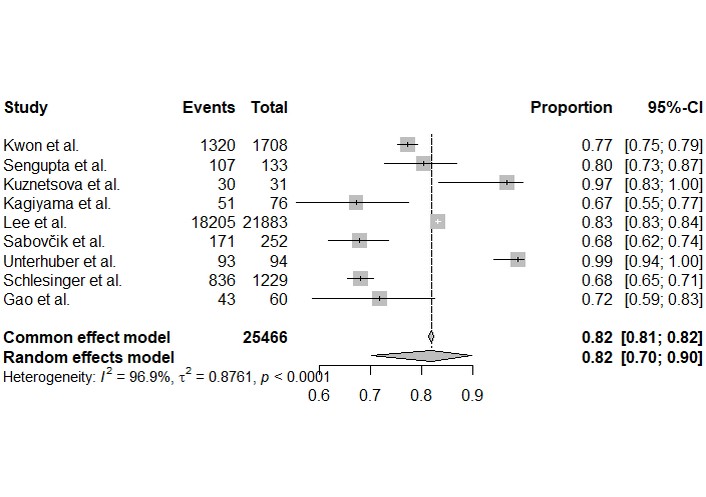
Forest plot of sensitivity for the detection of cardiac dysfunction. Each square represents the point estimate of sensitivity for an individual study, with the horizontal lines indicating the 95% confidence interval. A pooled estimate from the bivariate random-effects model is shown at the bottom.
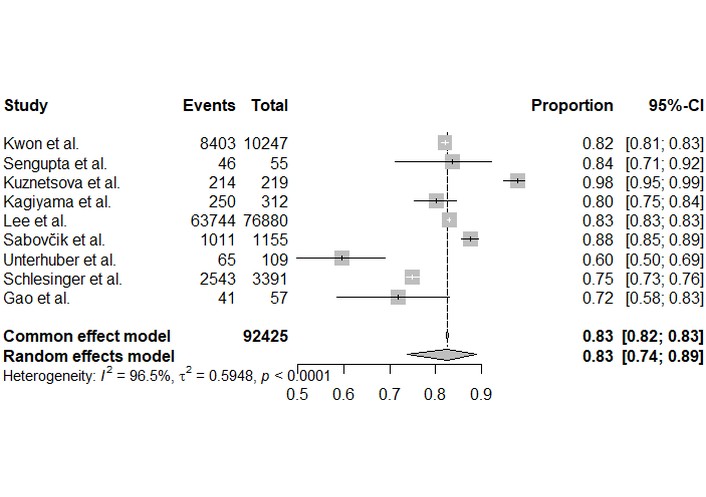
Forest plot of specificity for the detection of cardiac dysfunction. Each square represents the point estimate of specificity, proportional to its weight in the analysis. The horizontal lines indicate the 95% confidence interval. The diamond represents the pooled specificity of 0.83 [0.74, 0.89] from the random-effects model, with significant heterogeneity (I2 = 96.5%).
The bivariate random-effects meta-analysis produced a pooled sensitivity of 0.82 (95% CI: 0.70–0.90) and a pooled specificity of 0.83 (95% CI: 0.74–0.89). Both outcomes demonstrated extremely high and statistically significant heterogeneity (I2 > 96%, p < 0.0001).
To synthesize these findings and account for the correlation between sensitivity and specificity, a bivariate random-effects meta-analysis was performed. The resulting SROC curve is presented in Figure 5. The summary operating point for the AI-ECG models yielded a pooled sensitivity of 0.82 (95% CI: 0.70–0.90) and a pooled specificity of 0.83 (95% CI: 0.74–0.89). The 95% confidence region around this summary point indicates the precision of the mean estimate, while the much wider 95% prediction region illustrates the substantial heterogeneity between studies and the likely range of performance for a future study.
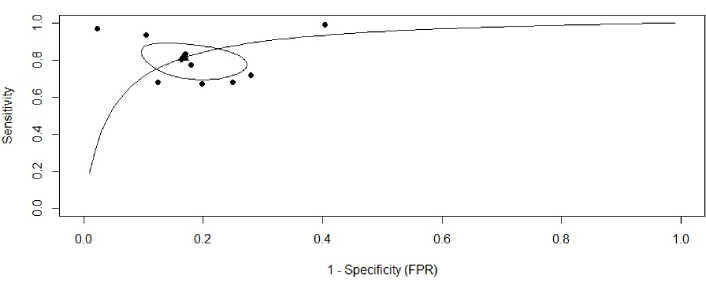
Summary receiver operating characteristic (SROC) curve for AI-ECG diagnostic accuracy. SROC curve illustrating the diagnostic performance of the included studies. Each black dot represents an individual study plotted according to its sensitivity and false positive rate (1−Specificity). The solid curve denotes the fitted SROC curve summarizing overall diagnostic accuracy. The black triangle indicates the pooled summary estimate of sensitivity and specificity, while the surrounding ellipse represents the 95% confidence region around this summary point. ECG: electrocardiogram; AI: artificial intelligence.
To investigate the cause of this heterogeneity, we conducted pre-specified subgroup analyses (Figures 6 and 7). We examined study-level specificity estimates according to AI model type (classical ML vs. DL). While individual studies showed variation in specificity, statistical comparison did not show a significant difference between model types (p = 0.60). High heterogeneity persisted in both groups. Likewise, subgrouping by clinical endpoint—diastolic dysfunction, HFpEF, or increased filling pressure—did not reveal significant between-group differences in specificity (p = 0.52). Importantly, heterogeneity remained very high across all subgroup comparisons (I2 > 77%), indicating that neither model type nor target condition accounted for the variability. Subgroup analyses for sensitivity yielded similar findings.
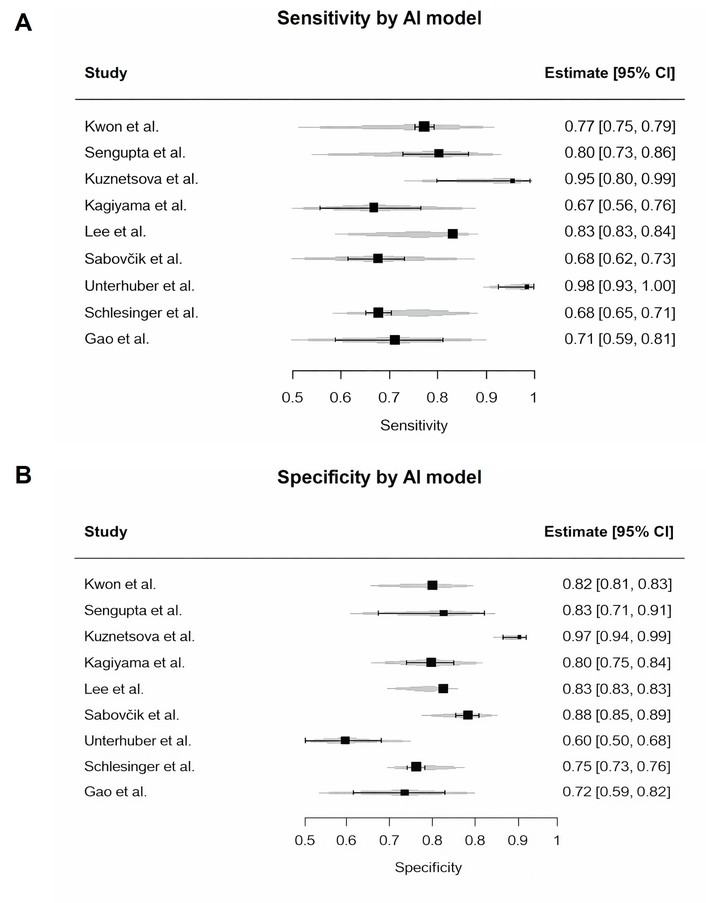
Study-level specificity estimates by AI model type. The figure shows individual study estimates for classical machine learning and deep learning models. Subgroup comparison was performed statistically and did not show a significant difference (p = 0.60). Heterogeneity remains high within both subgroups. AI: artificial intelligence.
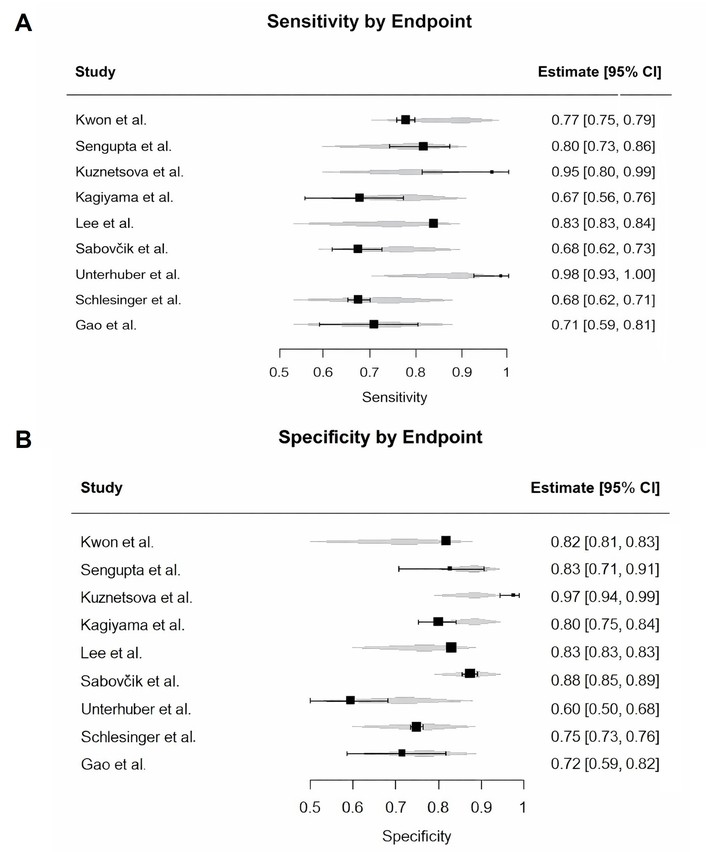
Subgroup analysis of specificity by clinical endpoint. The analysis revealed no statistically significant difference in specificity between studies targeting diastolic dysfunction, HFpEF, or increased filling pressure (p = 0.52). Substantial heterogeneity persists within each clinical category. HFpEF: heart failure with preserved ejection fraction.
In this systematic review and meta-analysis, we evaluated the diagnostic accuracy of nine different AI-ECG approaches for detecting cardiac dysfunction. Overall, the pooled results indicate a strong specificity (0.83) and a moderately high sensitivity (0.82). This pattern suggests that AI-ECG holds a considerable role as a non-invasive tool for ruling out cardiac dysfunction, which could help streamline diagnostic pathways and save echocardiography for patients who are most likely to benefit.
Yet, this encouraging finding is offset by the extremely high degree of heterogeneity we observed across studies. Our subgroup analyses, by model type (DL vs. conventional ML) and by clinical endpoint (HFpEF, LVDD, or raised filling pressures), could not explain this variability. The absence of a clear driver shows that model performance cannot be reduced to architecture or target condition alone; rather, it is shaped by a complex interplay of methodological and clinical factors.
Our assessment using QUADAS-2 sheds some light on some of these influences. The most common source of bias was patient selection. Several studies relied on retrospective or case-control designs, which may artificially inflate diagnostic accuracy due to spectrum bias and limited representation of real-world populations. In such settings, AI models are often trained and tested on highly selected cohorts with clear disease definitions, potentially overestimating performance when applied to broader clinical populations. In addition, trade-offs that are made during model development, such as prioritizing sensitivity over specificity, also contribute to these diverse results. For example, the model by Unterhuber et al. [24] was tuned to maximize sensitivity (0.99), but this came at the expense of specificity (0.60), making it most suitable as a rule-out test. In contrast, the algorithm from Kuznetsova et al. [20] achieved near-perfect specificity (0.98), better suited as a confirmatory tool. The extremely high heterogeneity observed across studies likely reflects multiple interacting factors beyond model architecture or diagnostic endpoint. These include variability in ECG acquisition (single-lead vs. 12-lead), signal preprocessing techniques, AI training strategies, disease prevalence, threshold selection, and reference standard definitions. Additionally, differences in population characteristics such as age distribution, comorbidity burden, and clinical setting may further contribute to variability. Such methodological and clinical diversity limits the interpretability of pooled estimates.
Based on the available evidence, AI-enhanced ECG models appear most suitable as screening or triage tools rather than standalone diagnostic tests. Their high specificity and negative predictive value suggest potential utility in ruling out cardiac dysfunction in low- to intermediate-risk populations, thereby optimizing referral for echocardiography and improving resource allocation within clinical workflows.
This meta-analysis has several strengths: a comprehensive synthesis of an emerging literature, a formal evaluation of study quality using QUADAS-2, and the application of a robust bivariate meta-analytic model. Importantly, our exploration of heterogeneity, though inconclusive, highlights the methodological complexity underpinning this research field.
However, the findings must be interpreted with caution. The unexplained heterogeneity weakens the precision of the pooled estimates, which may represent little more than an average across very different contexts. The limited number of studies also reduced the power of subgroup comparisons. Also, the included studies were largely retrospective, and our dataset was based on a defined pool of studies rather than an exhaustive search, further limiting generalizability.
AI-enhanced ECG systems show high pooled specificity for detecting cardiac dysfunction and thus represent a promising, cost-effective, and accessible screening option. However, the field is marked by profound heterogeneity that cannot be explained by endpoint choice or model type alone, and model performance is clearly context-dependent. Large-scale, prospective studies across diverse populations, along with better methodological standardization, are important for developing robust, generalizable AI-ECG tools that can be confidently integrated into clinical practice.
AI: artificial intelligence
CI: confidence interval
DL: deep learning
ECG: electrocardiogram
HF: heart failure
HFpEF: heart failure with preserved ejection fraction
LVDD: left ventricular diastolic dysfunction
ML: machine learning
PRISMA: Preferred Reporting Items for Systematic Reviews and Meta-Analyses
SROC: summary receiver operating characteristic
The supplementary materials for this article are available at: https://www.explorationpub.com/uploads/Article/file/101293_sup_1.pdf.
Habib S: Conceptualization, Investigation, Formal analysis, Methodology, Validation, Visualization, Writing—original draft, Writing—review & editing. Humna S: Conceptualization, Formal analysis, Writing—original draft, Writing—review & editing. AR: Conceptualization, Supervision, Methodology, Project administration, Writing—review & editing. HNT: Supervision, Project administration. Mursala T: Supervision, Project administration, Writing—review & editing. Mahad T: Conceptualization, Methodology, Writing—review & editing. Hooria S: Conceptualization, Methodology, Writing—review & editing. All authors read and approved the submitted version.
The authors declare that they have no conflicts of interest.
Not applicable.
Not applicable.
Not applicable.
The primary data for this meta-analysis were sourced online from databases listed in the methods. Referenced articles are accessible on PubMed, Cochrane, CTG and Google Scholar.
Not applicable.
© The Author(s) 2026.
Open Exploration maintains a neutral stance on jurisdictional claims in published institutional affiliations and maps. All opinions expressed in this article are the personal views of the author(s) and do not represent the stance of the editorial team or the publisher.
Copyright: © The Author(s) 2026. This is an Open Access article licensed under a Creative Commons Attribution 4.0 International License (https://creativecommons.org/licenses/by/4.0/), which permits unrestricted use, sharing, adaptation, distribution and reproduction in any medium or format, for any purpose, even commercially, as long as you give appropriate credit to the original author(s) and the source, provide a link to the Creative Commons license, and indicate if changes were made.

View: 3146
Download: 106
Times Cited: 0
