 Original Article

Affiliation:
Department of Cardiac Surgery, Harefield Hospital, UB9 6JH London, United Kingdom
ORCID: https://orcid.org/0000-0002-7160-9230
Affiliation:
Department of Cardiac Surgery, Harefield Hospital, UB9 6JH London, United Kingdom
ORCID: https://orcid.org/0000-0002-4085-1294
Affiliation:
Department of Cardiac Surgery, Harefield Hospital, UB9 6JH London, United Kingdom
Affiliation:
Department of Cardiac Surgery, Harefield Hospital, UB9 6JH London, United Kingdom
Affiliation:
Department of Cardiac Surgery, Harefield Hospital, UB9 6JH London, United Kingdom
ORCID: https://orcid.org/0000-0002-6660-3141
Affiliation:
Department of Cardiac Surgery, Harefield Hospital, UB9 6JH London, United Kingdom
ORCID: https://orcid.org/0000-0002-6618-3730
Affiliation:
Department of Cardiac Surgery, Harefield Hospital, UB9 6JH London, United Kingdom
Email: drrajashahzad@hotmail.com
ORCID: https://orcid.org/0000-0003-1325-0490
Explor Cardiol. 2025;3:101259 DOI: https://doi.org/10.37349/ec.2025.101259
Received: March 01, 2025 Accepted: April 27, 2025 Published: May 29, 2025
Academic Editor: Alexandre Abizaid, Institute Dante Pazzanese de Cardiologia, Brazil
Aim: The efficacy of composite valve graft (CVG) versus stentless aortic root replacement (SARR) in patients with aortic valve and root pathologies remains a subject of debate. This study aims to analyze the in-hospital outcomes and long-term survival of these two surgical approaches.
Methods: A retrospective analysis was conducted on 594 patients who underwent ARR between July 2003 and December 2023. Of these, 346 received a stentless aortic root and 248 CVG (100 biological and 148 mechanical). Propensity score matching (PSM) was utilized to create well-balanced cohorts based on preoperative demographics and intraoperative characteristics. Univariable and multivariable regression analyses were performed to evaluate in-hospital mortality and long-term survival rates. Kaplan-Meier curves were constructed to visualize survival outcomes.
Results: After PSM, 212 patients in each group were well-balanced in terms of baseline characteristics. The analysis of in-hospital outcomes revealed no significant differences between the SARR and CVG groups for key outcomes except neurological complications that were consistently higher in the CVG group, with a significant difference observed in both unmatched (8.4% vs. 4.9%, P = 0.014) and matched cohorts (8.5% vs. 4.3%, P = 0.022). Long-term survival analysis in the matched cohorts demonstrated a statistically significant survival advantage for the SARR group, with a 20-year survival rate of 54% compared to 47% for the CVG group (log-rank P value of 0.047). Further analysis by specific graft type within the matched groups suggested that xenografts might offer a significant survival advantage (log-rank P value of 0.009).
Conclusions: While SARR and CVG provided similar in-hospital outcomes, SARR, particularly xenografts, demonstrated a significant long-term survival advantage. Xenografts may be a preferable option for patients, especially those with longer life expectancies, due to their durability and reduced need for anticoagulation.
Aortic root replacement (ARR) is a well-established surgical strategy for managing complex aortic root diseases, such as annulo-aortic ectasia, complicated endocarditis affecting native or prosthetic valves, and aortic dissections [1]. Current practice guidelines suggest different approaches based on patient age, recommending mechanical valves for younger patients and bioprosthetic valves for older individuals [2, 3]. However, these recommendations are primarily derived from studies of isolated aortic valve replacement (AVR) rather than comprehensive ARR.
Given these uncertainties, this study focuses on evaluating the long-term outcomes of two widely used approaches in ARR: stentless ARRs (SARRs) (including homografts and xenografts) and composite valve grafts (CVGs) (incorporating both biological and mechanical valves). By analysing 20 years of data, this study aims to provide clarity on the comparative effectiveness of these approaches by evaluating the impact on in-hospital outcomes and long-term survival thereby offering insights that can guide clinical decision-making in aortic root surgery.
This study involved a retrospective analysis of data from a prospectively collected cardiac surgery database (PATS; Dendrite Clinical Systems, Ltd, Oxford, UK). The PATS database contains comprehensive information on a wide range of variables related to cardiac surgery, including preoperative, intraoperative, and postoperative details, as well as complications and mortality outcomes, for all patients treated at our institution. The data undergo regular validation and are submitted annually to the National Institute for Cardiovascular Outcomes Research (NICOR) as part of the National Adult Cardiac Surgery Audit registry. Information about death was obtained from the institutional database and the NHS Spine for all patients. Data regarding postoperative complications and survival were available for all patients in the study. This study adhered to the ethical standards set forth in the Declaration of Helsinki, and it was approved by the local audit committee. Given the retrospective nature of the study, the requirement for individual patient consent was waived.
We collected data on all ARR procedures performed at our institution between July 2003 and December 2023. All valve-sparing techniques were excluded from this analysis, focusing solely on patients who required complete valve and root replacement. The final sample consisted of 594 patients, of whom 346 received a stentless aortic root (including 97 homografts and 249 xenografts), and 248 received a CVG (comprising 100 biological and 148 mechanical valves).
The choice of surgical strategy was based on the surgeon’s preference as well as dictated by patient characteristics. All interventions were performed under general anaesthesia via a midline sternotomy. We have previously described in detail the techniques of homograft replacement and xenograft root replacement [4]. Briefly, a full ARR with coronary artery reimplantation was performed using the largest implantable prosthesis. There was no subcoronary implantation procedure, and no reinforcement techniques or synthetic material were used to support the surgical anastomoses in homografts. The proximal anastomosis between the stentless (homograft/xenograft) root and the native aortic annulus was performed using multiple interrupted 3/0 or 4/0 braided polyester nonabsorbable sutures. The left and then the right coronary ostia were reimplanted into the respective ostia of the bioprosthesis using a running 5/0 polypropylene suture. In cases where a greater segment of the ascending aorta required resection, a straight polyethylene terephthalate tube (Gelweave Graft, Terumo Aortic, Vascutek, Renfrewshire, UK), chosen intraoperatively on the basis of the outer diameter of the distal end of the stentless root and of the proximal aortic arch, was interposed using a running 4/0 polypropylene suture. Because the height and angle between the native porcine coronary ostia in xenograft prostheses may be different from that in normal human anatomy, new ostia were fashioned to avoid tension, torsion, or kinking of the proximal coronary arteries.
The modified Bentall was performed using CVG. The mechanical composite graft of choice was the CarboSealTM composite conduit (LivaNova, Saluggia, Italy) formed by assembling a standard Carbomedics bileaflet mechanical prosthesis into a 10 cm straight vascular graft. The bio-Bentall was created by incorporating a bioprosthetic valve within a straight Dacron tube. The valve was secured to the conduit with interrupted or running 4/0 non-absorbable, monofilament, synthetic polypropylene suture. The choice of valve model was influenced by surgeon’s preference. The valve size was selected according to the patient’s body surface area, securing adequate effective orifice area. A graft 3–5 mm larger than the valve was used. Interrupted everting pledgeted 2/0 polyester sutures or semi-continuous 3/0 non-absorbable, monofilament, synthetic polypropylene suture were placed on the aortic annulus and passed through the Valsalva graft collar as well as the cuff of the valve prosthesis simultaneously to complete the proximal anastomosis. The coronary ostia were trimmed with a full-thickness 7–8 mm cuff of the aortic wall to create buttons and anastomosed with a 5/0 polypropylene running suture to corresponding holes in the Dacron graft.
Data description and analysis was performed in SPSS (SPSS Statistics 29.0.2.0, IBM Corp, Armonk, NY). Continuous variables are expressed as mean ± standard deviation if normally distributed and as median and interquartile range for the numerical variables not normally distributed. Categorical variables are shown as count and percentages. The Lilliefors (Kolmogorov-Smirnov) test was used for normality assessment. Comparison between continuous variables has been conducted using unpaired Student’s t-test if normally distributed and Mann-Whitney U-test if not normally distributed. Categorical variables have been compared using Pearson Chi-square test or Fisher’s exact test as appropriate.
To control for potential confounders within the dataset, we generated a propensity score for each patient using a multivariable logistic regression model. All 27 preoperative clinical variables listed in Table 1 were included as covariates in the logistic regression model to estimate the propensity score, with treatment type (SARR vs. CVG) as the binary dependent variable. Pairs of patients receiving either SARR or CVG were matched using a greedy 1:1 matching algorithm with a caliper of width equal to 0.2 standard deviations of the logit of the propensity score. The quality of the match was assessed by comparing selected pretreatment variables between the propensity score-matched groups using the standardized mean difference, where an absolute standardized difference of greater than 10% was considered indicative of meaningful covariate imbalance.
Preoperative demographics of patients
| Variable | Unmatched | Matched | ||||||
|---|---|---|---|---|---|---|---|---|
| Composite valve graft(n = 248) | Stentless aortic root(n = 346) | P value | SMD | Composite valve graft(n = 212) | Stentless aortic root(n = 212) | P value | SMD | |
| Age, mean ± SD | 56.5 ± 13.3 | 60.2 ± 14.8 | < 0.001 | 0.263 | 57.5 ± 13.3 | 57.8 ± 14.8 | 0.413 | 0.021 |
| Female, n (%) | 51 (20.6) | 97 (28) | 0.019 | 0.174 | 47 (22.2) | 45 (21.2) | 0.407 | 0.023 |
| BMI, mean ± SD | 28.2 ± 6.3 | 27.4 ± 5.0 | 0.037 | 0.216 | 27.6 ± 5.4 | 27.7 ± 4.9 | 0.407 | 0.021 |
| NYHA class, n (%) | < 0.001 | 0.268 | 0.459 | 0.01 | ||||
| I II III IV | 62 (25)66 (26.6)89 (35.9)31 (12.5) | 54 (15.6)89 (25.7)137 (39.6)66 (19.1) | 43 (20.3)59 (27.8)83 (39.2)27 (12.7) | 39 (18.4)65 (30.7)81 (38.2)27 (12.7) | ||||
| Heart failure, n (%) | 0.027 | 0.162 | 0.315 | 0.047 | ||||
| Never Past Now | 199 (80.2)12 (4.8)37 (14.9) | 252 (72.8)25 (7.2)69 (19.9) | 170 (80.2)11 (5.2)31 (14.6) | 173 (81.6)12 (5.7)27 (12.7) | ||||
| Previous cardiac surgery, n (%) | 34 (13.7) | 107 (30.9) | < 0.001 | 0.202 | 33 (15.6) | 40 (18.9) | 0.185 | 0.038 |
| Hypertension, n (%) | 170 (68.5) | 228 (65.9) | 0.249 | 0.057 | 144 (67.9) | 143 (67.5) | 0.459 | 0.010 |
| Tobacco use, n (%) | 0.163 | 0.057 | 0.092 | 0.010 | ||||
| Never Past Current | 133 (53.6)90 (36.3)25 (10.1) | 165 (47.7)148 (42.8)33 (9.5) | 116 (54.7)73 (34.4)23 (10.8) | 102 (48.1)82 (38.7)28 (13.2) | ||||
| Diabetes, n (%) | 14 (5.6) | 27 (7.8) | 0.153 | 0.086 | 12 (5.7) | 16 (7.5) | 0.218 | 0.076 |
| Hypercholesterolaemia, n (%) | 94 (37.9) | 144 (41.6) | 0.182 | 0.076 | 82 (38.7) | 85 (40.1) | 0.383 | 0.029 |
| COPD, n (%) | 21 (8.5) | 35 (10.1) | 0.249 | 0.057 | 20 (9.4) | 15 (7.1) | 0.189 | 0.086 |
| PAD, n (%) | 30 (12.1) | 35 (10.1) | 0.223 | 0.078 | 22 (10.4) | 21 (9.9) | 0.436 | 0.087 |
| Previous TIA/CVA, n (%) | 0.010 | 0.198 | 0.145 | 0.088 | ||||
| TIA CVA | 9 (3.6)12 (4.8) | 19 (5.5)32 (9.2) | 9 (4.2)12 (5.7) | 7 (3.3)8 (3.8) | ||||
| Preoperative AF, n (%) | 24 (9.7) | 29 (8.4) | 0.293 | 0.045 | 20 (9.4) | 16 (7.5) | 0.244 | 0.068 |
| Renal impairment, n (%) | < 0.001 | 0.353 | 0.219 | 0.075 | ||||
| Moderate Severe Dialysis | 59 (23.8)11 (4.4)0 (0) | 105 (30.3)39 (11.3)3 (0.9) | 54 (25.5)11 (5.2)0 (0) | 48 (22.6)16 (7.5)2 (0.9) | ||||
| LVEF, n (%) | 0.013 | 0.185 | 0.118 | 0.078 | ||||
| Good Moderate Poor | 165 (66.5)70 (28.2)13 (5.2) | 262 (75.7)70 (20.2)14 (4) | 148 (69.8)57 (26.9)7 (3.3) | 162 (76.4)42 (19.8)8 (3.8) | ||||
| Left main stem involvement, n (%) | 3 (1.2) | 5 (1.4) | 0.403 | 0.021 | 3 (1.4) | 3 (1.4) | 0.500 | 0.001 |
| Severity of CAD, n (%) | 0.008 | 0.207 | 0.288 | 0.054 | ||||
| Single Double Triple | 14 (5.6)11 (4.4)3 (1.2) | 39 (11.3)17 (4.9)12 (3.5) | 13 (6.1) 11 (5.2)3 (1.4) | 21 (9.9)9 (4.2)4 (1.9) | ||||
| Aortic valve disease, n (%) | 0.057 | 0.132 | 0.382 | 0.029 | ||||
| AS AR Mixed | 60 (24.2)27 (10.9)2 (0.8) | 110 (31.8)38 (11.0)2 (0.6) | 55 (25.9)24 (11.3)2 (0.9) | 59 (27.8)22 (10.4)0 (0) | ||||
| Existing pacemaker, n (%) | 0 (0) | 3 (0.9) | 0.071 | 0.132 | 0 (0) | 0 (0) | 0.999 | 0.001 |
| Cardiogenic shock, n (%) | 16 (6.5) | 16 (4.6) | 0.166 | 0.080 | 12 (5.7) | 7 (3.3) | 0.121 | 0.096 |
| Preoperative inotropes, n (%) | 16 (6.5) | 18 (5.2) | 0.259 | 0.053 | 7 (3.3) | 11 (5.2) | 0.168 | 0.094 |
| Preoperative IABP, n (%) | 0 (0) | 3 (0.9) | 0.071 | 0.132 | 0 (0) | 0 (0) | 0.999 | 0.001 |
| Preoperative intubation, n (%) | 11 (4.4) | 11 (3.2) | 0.212 | 0.066 | 6 (2.8) | 4 (1.9) | 0.262 | 0.062 |
| Operative urgency, n (%) | 0.241 | 0.058 | 0.300 | 0.051 | ||||
| Elective Urgent Emergency Salvage | 129 (56)44 (17.7)57 (23)8 (3.2) | 166 (48)130 (37.6)43 (12.4)7 (2) | 126 (59.4)38 (17.9)43 (20.3)5 (2.4) | 116 (54.7)67 (31.6)24 (11.3)5 (2.4) | ||||
| Aortic pathology, n (%) | 0.268 | 0.061 | 0.289 | 0.059 | ||||
| Dissection Aneurysm Marfan Native valve IE Prosthetic valve IE Other | 65 (26.2)155 (62.5)2 (0.8)2 (0.8)1 (0.4)23 (9.3) | 17 (4.9)134 (38.7)2 (0.6)38 (11)26 (7.5)129 (37.3) | 48 (22.6)141 (66.5)1 (0.5)2 (0.9)1 (0.5)20 (9.4) | 12 (5.7)101 (47.6)2 (0.9)25 (11.8)8 (3.8)66 (31.1) | ||||
| Logistic EuroSCORE, mean ± SD | 17.9 ± 17.7 | 25.8 ± 22 | < 0.001 | 0.355 | 17.8 ± 17.8 | 18.1 ± 17.8 | 0.425 | 0.086 |
| Follow-up (years), mean ± SD | 4.7 ± 4.6 | 6.6 ± 4.6 | 0.486 | 0.028 | 4.6 ± 4.5 | 7.4 ± 4.7 | 0.511 | 0.031 |
AF: atrial fibrillation; AR: aortic regurgitation; AS: aortic stenosis; BMI: body mass index; CAD: coronary artery disease; COPD: chronic obstructive pulmonary disease; CVA: cerebrovascular accident; IABP: intra-aortic balloon pump; IE: infective endocarditis; LVEF: left ventricular ejection fraction; NYHA: New York Heart Association; PAD: peripheral arterial disease; SMD: standardized mean difference; TIA: transient ischaemic attack
A multiple logistic regression model was employed to identify predictors of in-hospital mortality and long-term survival rates. After performing univariable analysis, the final multivariable models were constructed using a stepwise approach, with P values guiding the selection of variables. The variables with a P value < 0.05 were included in the multivariable logistic regression model. Kaplan-Meier curves were generated to visualize survival outcomes across the study groups. The survival functions of the groups were compared using the log-rank test, with survival probabilities and 95% confidence intervals (CIs) reported at 5, 10, 15, and 20 years. Additionally, a Cox proportional hazards model was utilized to identify factors influencing long-term survival with all tests set to a significance level of 0.05.
The preoperative demographics of the study population revealed some significant differences between patients who underwent SARR and those who received a CVG before matching. Patients in the stentless aortic root group were generally older, with an average age of 60.2 years compared to 56.5 years in the CVG group (P < 0.001). The stentless group also had a higher proportion of females (28% vs. 20.6%, P = 0.019) and a slightly lower mean body mass index (BMI) (27.4 vs. 28.2, P = 0.037). Additionally, there were more patients with past or current heart failure and previous cardiac surgeries in the stentless group. After propensity score matching (PSM), these demographic differences were effectively balanced between the two groups, resulting in well-matched cohorts with no significant differences in key variables such as age, sex, BMI, New York Heart Association (NYHA) class, or previous cardiac history. The preoperative clinical characteristics for the patients are presented in Table 1.
The intraoperative characteristics of the study population revealed several key differences between the patients who underwent SARR and those who received a CVG. Before matching, the mean cross-clamp time was significantly longer in the SARR group compared to the CVG group (159.6 ± 113.3 minutes vs. 134.1 ± 44.1 minutes, P < 0.001). Additionally, the stentless group had a shorter mean circulatory arrest time (2.1 ± 12 minutes vs. 6.6 ± 15.7 minutes, P < 0.001) and a higher lowest temperature during surgery (31.1° ± 4.2°C vs. 29.5° ± 6.0°C, P < 0.001). The use of coronary artery bypass grafting (CABG) also showed some variation between the groups.
After PSM, most of these differences were minimized, with the two groups becoming more comparable. The total duration of operation, cardiopulmonary bypass (CPB) time, and cross-clamp time were similar between the matched groups. However, the stentless aortic root group continued to have a slightly shorter mean circulatory arrest time (2.37 ± 14.1 minutes vs. 6.46 ± 15.7 minutes, P = 0.003) and a higher lowest temperature during surgery (31.4° ± 4.3°C vs. 29.7° ± 5.8°C, P < 0.001). The distribution of cardioplegia types and infusion modes, as well as the number of valves replaced and use of CABG, were well balanced between the groups post-matching. The intraoperative characteristics for the patients are presented in Table 2.
Intraoperative characteristics
| Variable | Unmatched | Matched | ||||
|---|---|---|---|---|---|---|
| Composite valve graft(n = 248) | Stentless aortic root(n = 346) | P value | Composite valve graft(n = 212) | Stentless aortic root(n = 212) | P value | |
| Total duration of operation, mean ± SD | 388.5 ± 132.5 | 398.5 ± 137.1 | 0.189 | 386.1 ± 132.0 | 369.1 ± 122.0 | 0.084 |
| Mean CPB time, mean ± SD | 195.1 ± 88.7 | 203.2 ± 82 | 0.126 | 195.4 ± 89.4 | 183.1 ± 65.1 | 0.052 |
| Mean cross clamp time, mean ± SD | 134.1 ± 44.1 | 159.6 ± 113.3 | < 0.001 | 135.3 ± 43.8 | 150.8 ± 136.3 | 0.058 |
| Mean circulatory arrest time (min), mean ± SD | 6.6 ± 15.7 | 2.1 ± 12 | < 0.001 | 6.46 ± 15.7 | 2.37 ± 14.1 | 0.003 |
| Lowest temperature, mean ± SD | 29.5 ± 6 | 31.1 ± 4.2 | < 0.001 | 29.7 ± 5.8 | 31.4 ± 4.3 | < 0.001 |
| Cardioplegia temperature, n (%) | 0.20 | 0.071 | ||||
| Cold Warm Cold & warm | 238 (96)3 (1.2)7 (2.8) | 318 (91.9)6 (1.7)22 (6.4) | 203 (95.8)2 (0.9)7 (3.3) | 195 (92.0)5 (2.4)12 (5.7) | ||
| Cardioplegia infusion mode, n (%) | 0.067 | 0.366 | ||||
| Antegrade Retrograde Mixed | 144 (58.1)0 (0)104 (41.9) | 178 (51.4)3 (0.9)165 (47.7) | 118 (55.7)0 (0)94 (44.3) | 120 (56.6)3 (1.4)89 (42.0) | ||
| Number of valves replaced, n (%) | 0.203 | 0.108 | ||||
| 1 2 3 | 230 (92.7)16 (6.5)2 (0.8) | 305 (88.2)36 (10.4)5 (1.4) | 157 (74.1)15 (7.1)2 (0.9) | 142 (67.0)17 (8.0)1 (0.5) | ||
| CABG, n (%) | 0.035 | 0.222 | ||||
| Yes No | 39 (15.7)209 (84.3) | 74 (21.6)271 (78.3) | 34 (16.0)178 (84.0) | 40 (18.9)172 (81.1) | ||
| Number of distal coronary anastomoses, n (%) | 0.016 | 0.256 | ||||
| 0 1 2 3 | 209 (84.3)29 (11.7)7 (2.8)3 (1.2) | 272 (78.6)44 (12.7)22 (6.4)8 (2.3) | 178 (84.0)24 (11.3)7 (3.3)3 (1.4) | 173 (81.6)26 (12.3)10 (4.7)3 (1.4) | ||
CABG: coronary artery bypass grafting; CPB: cardiopulmonary bypass
The analysis of in-hospital outcomes revealed no significant differences between the SARR group and the CVG group, both in the unmatched and matched cohorts, in terms of key outcomes such as low cardiac output syndrome, reoperation rates, and postoperative renal replacement therapy. Additionally, both groups had similar lengths of postoperative hospital stay and in-hospital mortality rates. However, neurological complications were consistently higher in the CVG group, with the unmatched analysis showing 8.4% of patients in the CVG group experiencing neurological events compared to 4.9% in the SARR group (P = 0.014). This trend persisted in the matched analysis, where neurological complications occurred in 8.5% of the CVG group compared to 4.3% in the SARR group (P = 0.022). These detailed in-hospital outcomes are presented in Table 3.
In-hospital outcomes
| Variable | Unmatched | Matched | ||||
|---|---|---|---|---|---|---|
| Composite valve graft(n = 248) | Stentless aortic root(n = 346) | P value | Composite valve graft(n = 212) | Stentless aortic root(n = 212) | P value | |
| Low cardiac output, n (%) | 113 (45.6) | 170 (49.1) | 0.196 | 96 (45.3) | 94 (44.3) | 0.423 |
| Arrhythmias, n (%) | 0.081 | 0.381 | ||||
| AF VF CHB | 73 (29.4)10 (4)7 (2.8) | 77 (22.3)10 (2.9)32 (9.2) | 59 (27.8)9 (4.2)7 (3.3) | 44 (20.8)7 (3.3)15 (7.1) | ||
| Reoperation, n (%) | 0.495 | 0.111 | ||||
| Bleeding Other | 20 (8.1)5 (2) | 32 (9.2)5 (1.4) | 17 (8.0)3 (1.4) | 13 (6.1)1 (0.5) | ||
| Pulmonary complications, n (%) | 0.443 | 0.140 | ||||
| Re-intubation Tracheostomy | 9 (3.6)12 (4.8) | 10 (2.9)19 (5.5) | 7 (3.3)12 (5.7) | 5 (2.4)8 (3.8) | ||
| New neurological complications, n (%) | 0.014 | 0.022 | ||||
| TIA CVA | 8 (3.2)13 (5.2) | 11 (3.2)6 (1.7) | 6 (2.8)12 (5.7) | 5 (2.4)4 (1.9) | ||
| Sepsis, n (%) | 10 (4) | 10 (2.9) | 0.250 | 6 (2.8) | 3 (1.4) | 0.299 |
| Wound infection, n (%) | 0.404 | 0.413 | ||||
| Superficial Deep | 3 (1.2)3 (1.2) | 7 (2.0)2 (0.6) | 3 (1.4)2 (0.9) | 6 (2.8)1 (0.5) | ||
| Postoperative RRT, n (%) | 31 (12.5) | 47 (13.6) | 0.350 | 28 (13.2) | 22 (10.4) | 0.184 |
| Permanent RRT, n (%) | 11 (4.4) | 13 (3.8) | 0.340 | 8 (3.8) | 7 (3.3) | 0.397 |
| GI complications, n (%) | 7 (2.8) | 19 (5.4) | 0.122 | 5 (2.4) | 8 (3.8) | 0.229 |
| Pleural effusions requiring drainage, n (%) | 13 (5.2) | 33 (9.5) | 0.491 | 13 (6.1) | 15 (7.1) | 0.302 |
| Pericardial effusions requiring drainage, n (%) | 9 (3.6) | 5 (1.4) | 0.491 | 6 (2.8) | 3 (1.4) | 0.302 |
| MOF, n (%) | 15 (6.0) | 24 (6.9) | 0.334 | 12 (5.7) | 10 (4.7) | 0.331 |
| Postoperative hospital stay (days), n (%) | 19.4 ± 38.2 | 21.7 ± 38.5 | 0.311 | 19.9 ± 40.7 | 15.1 ± 13.2 | 0.052 |
| In-hospital mortality, n (%) | 24 (9.7) | 39 (11.3) | 0.267 | 20 (9.4) | 13 (6.1) | 0.103 |
AF: atrial fibrillation; CHB: complete heart block; CVA: cerebrovascular accident; MOF: multi organ failure; RRT: renal replacement therapy; TIA: transient ischaemic attack; VF: ventricular fibrillation
The univariable analysis (Table 4) identified several predictors of in-hospital mortality. Key factors that were significantly associated with higher in-hospital mortality in both the unmatched and matched cohorts included older age, higher NYHA classification, previous cardiac surgery, diabetes, hypertension, renal disease, extensive coronary artery disease (CAD), aortic regurgitation (AR), preoperative cardiogenic shock, the need for preoperative inotropes or intubation, and aortic dissection as the underlying pathology. Notably, the incidence of cardiogenic shock and AR demonstrated a particularly strong association with in-hospital mortality, as evidenced by high odds ratios (ORs) in both analyses.
Univariable regression analysis for in-hospital mortality
| Variable | Unmatched | Matched | ||||
|---|---|---|---|---|---|---|
| OR | 95% CI | P value | OR | 95% CI | P value | |
| Age | 1.040 | 1.018–1.062 | < 0.001 | 1.053 | 1.020–1.086 | < 0.001 |
| Female gender | 1.725 | 0.990–3.005 | 0.054 | 2.221 | 1.049–4.706 | 0.037 |
| BMI | 0.974 | 0.926–1.025 | 0.314 | 0.982 | 0.915–1.055 | 0.629 |
| NYHA classification | 1.989 | 1.466–2.698 | < 0.001 | 1.826 | 1.208–2.759 | 0.004 |
| HF | 1.523 | 1.134–2.045 | 0.005 | 1.627 | 1.075–2.462 | 0.021 |
| Previous cardiac surgery | 2.959 | 1.727–5.071 | < 0.001 | 3.586 | 1.693–7.595 | < 0.001 |
| Diabetes | 3.043 | 1.413–6.553 | 0.004 | 3.727 | 1.394–9.967 | 0.009 |
| Hypertension | 2.528 | 1.288–4.962 | 0.007 | 3.737 | 1.287–10.854 | 0.015 |
| Smoking | 0.721 | 0.472–1.101 | 0.130 | 0.868 | 0.511–1.474 | 0.600 |
| Renal disease | 1.785 | 1.267–2.514 | < 0.001 | 1.881 | 1.176–3.009 | 0.008 |
| COPD | 1.464 | 0.658–3.253 | 0.350 | 1.122 | 0.324–3.879 | 0.856 |
| Neurological disease | 1.155 | 0.747–1.787 | 0.516 | 0.943 | 0.420–2.117 | 0.887 |
| PAD | 2.395 | 1.221–4.699 | 0.011 | 2.126 | 0.825–5.482 | 0.119 |
| Preoperative AF | 0.867 | 0.332–2.267 | 0.772 | 1.547 | 0.512–4.677 | 0.439 |
| Extent of CAD | 1.487 | 1.087–2.034 | 0.013 | 1.625 | 1.052–2.512 | 0.029 |
| LMS involvement | 5.260 | 1.226–22.560 | 0.025 | 2.412 | 0.274–21.280 | 0.428 |
| LVEF | 1.598 | 1.057–2.415 | 0.026 | 1.638 | 0.918–2.924 | 0.095 |
| AS | 0.555 | 0.288–1.070 | 0.079 | 0.582 | 0.234–1.449 | 0.245 |
| AR | 4.119 | 2.209–7.682 | < 0.001 | 5.086 | 2.279–11.349 | < 0.001 |
| Cardiogenic shock | 6.012 | 2.780–13.002 | < 0.001 | 6.462 | 2.277–18.339 | < 0.001 |
| Preoperative inotropes | 9.702 | 4.644–20.268 | < 0.001 | 5.192 | 1.727–15.607 | 0.003 |
| Preoperative intubation | 5.371 | 2.158–13.372 | < 0.001 | 5.486 | 1.349–22.304 | 0.017 |
| Operative urgency | 2.038 | 1.526–2.722 | < 0.001 | 2.140 | 1.465–3.126 | < 0.001 |
| CPB time | 1.011 | 1.008–1.1014 | < 0.001 | 1.014 | 1.009–1.018 | < 0.001 |
| ACX time | 1.002 | 1.000–1.005 | 0.057 | 1.001 | 0.999–1.003 | 0.217 |
| Circulatory arrest time | 1.022 | 1.007–1.037 | 0.003 | 1.023 | 1.006–1.040 | 0.006 |
| Etiology-dissection | 2.242 | 1.205–4.170 | 0.011 | 2.965 | 1.333–6.596 | 0.008 |
| Etiology-aneurysm | 0.491 | 0.283–0.851 | 0.011 | 0.400 | 0.191–0.836 | 0.015 |
| Etiology-native valve IE | 1.539 | 0.619–3.823 | 0.353 | 2.207 | 0.715–6.812 | 0.169 |
| Etiology-prosthetic valve IE | 1.497 | 0.501–4.478 | 0.470 | 1.496 | 0.181–12.339 | 0.708 |
| Postoperative RRT | 4.551 | 2.530–8.189 | < 0.001 | 3.201 | 1.394–7.353 | 0.006 |
| Type of procedure | 0.843 | 0.493–1.443 | 0.534 | 1.595 | 0.772–3.295 | 0.208 |
ACX: aortic cross clamp; AF: atrial fibrillation; AR: aortic regurgitation; AS: aortic stenosis; BMI: body mass index; CAD: coronary artery disease; CI: confidence interval; COPD: chronic obstructive pulmonary disease; CPB: cardiopulmonary bypass; HF: heart failure; IE: infective endocarditis; LMS: left main stem; LVEF: left ventricular ejection fraction; NYHA: New York Heart Association; OR: odds ratio; PAD: peripheral arterial disease; RRT: renal replacement therapy
In the multivariable analysis (Table 5), several of these factors remained significant independent predictors of in-hospital mortality. In the matched cohort, advanced age (OR 1.085, 95% CI 1.030–1.142, P = 0.002), AR (OR 7.963, 95% CI 2.448–25.902, P < 0.001), operative urgency (OR 2.425, 95% CI 1.090–5.395, P = 0.030), and longer CPB time (OR 1.015, 95% CI 1.009–1.022, P < 0.001) were all significant predictors of mortality.
Multivariable regression analysis for in-hospital mortality
| Variable | Unmatched | Matched | ||||||
|---|---|---|---|---|---|---|---|---|
| OR | 95% CI lower | 95% CI upper | P value | OR | 95% CI lower | 95% CI upper | P value | |
| Age | 1.049 | 1.016 | 1.083 | 0.004 | 1.085 | 1.030 | 1.142 | 0.002 |
| Female gender | - | - | - | - | 2.872 | 0.964 | 8.557 | 0.058 |
| NYHA classification | 1.355 | 0.912 | 2.013 | 0.133 | 1.068 | 0.626 | 1.822 | 0.809 |
| HF | 0.859 | 0.552 | 1.339 | 0.503 | 1.130 | 0.603 | 2.117 | 0.703 |
| Previous cardiac surgery | 2.193 | 0.889 | 5.411 | 0.088 | 2.604 | 0.700 | 9.689 | 0.154 |
| Diabetes | 1.283 | 0.426 | 3.864 | 0.658 | 1.214 | 0.272 | 5.406 | 0.800 |
| Hypertension | 2.373 | 0.974 | 5.778 | 0.057 | 3.281 | 0.743 | 14.481 | 0.117 |
| Renal disease | 0.815 | 0.484 | 1.372 | 0.441 | 0.840 | 0.409 | 1.724 | 0.634 |
| PAD | 0.691 | 0.266 | 1.798 | 0.449 | 0.282 | 0.065 | 1.233 | 0.093 |
| Extent of CAD | 1.072 | 0.674 | 1.706 | 0.768 | - | - | - | - |
| LMS involvement | 2.056 | 0.225 | 18.796 | 0.523 | - | - | - | - |
| LVEF | 1.236 | 0.683 | 2.237 | 0.483 | - | - | - | - |
| AR | 4.403 | 1.785 | 10.861 | 0.001 | 7.963 | 2.448 | 25.902 | < 0.001 |
| Cardiogenic shock | 1.077 | 0.224 | 5.169 | 0.926 | 5.346 | 0.438 | 65.271 | 0.189 |
| Preoperative inotropes | 9.051 | 2.425 | 33.782 | 0.001 | 0.761 | 0.079 | 7.296 | 0.813 |
| Preoperative intubation | 0.558 | 0.091 | 3.429 | 0.529 | 0.437 | 0.027 | 7.064 | 0.560 |
| Operative urgency | 1.311 | 0.743 | 2.313 | 0.351 | 2.425 | 1.090 | 5.395 | 0.030 |
| CPB time | 1.011 | 1.007 | 1.015 | < 0.001 | 1.015 | 1.009 | 1.022 | < 0.001 |
| Circulatory arrest time | 0.994 | 0.967 | 1.021 | 0.659 | 0.997 | 0.990 | 1.005 | 0.471 |
| Etiology-dissection | 1.690 | 0.397 | 7.199 | 0.478 | 0.492 | 0.091 | 2.652 | 0.409 |
| Etiology-aneurysm | 1.231 | 0.454 | 3.338 | 0.684 | 0.896 | 0.251 | 3.197 | 0.866 |
| Etiology-native valve IE | 1.379 | 0.347 | 5.478 | 0.648 | - | - | - | - |
| Etiology-prosthetic valve IE | 0.514 | 0.112 | 2.348 | 0.390 | - | - | - | - |
| Postoperative RRT | 2.988 | 1.354 | 6.591 | 0.007 | 0.953 | 0.290 | 3.137 | 0.937 |
AR: aortic regurgitation; BMI: body mass index; CAD: coronary artery disease; CI: confidence interval; CPB: cardiopulmonary bypass; CVA: cerebrovascular accident; CVG: composite valve graft; HF: heart failure; IE: infective endocarditis; LMS: left main stem; LVEF: left ventricular ejection fraction; NYHA: New York Heart Association; OR: odds ratio; PAD: peripheral arterial disease; RRT: renal replacement therapy
The Kaplan-Meier survival analysis for the unmatched groups (Figure 1, Table 6) revealed no significant difference in long-term survival between the CVG and SAAR groups. Although the SARR group showed a slight trend toward better survival, these differences were not statistically significant.
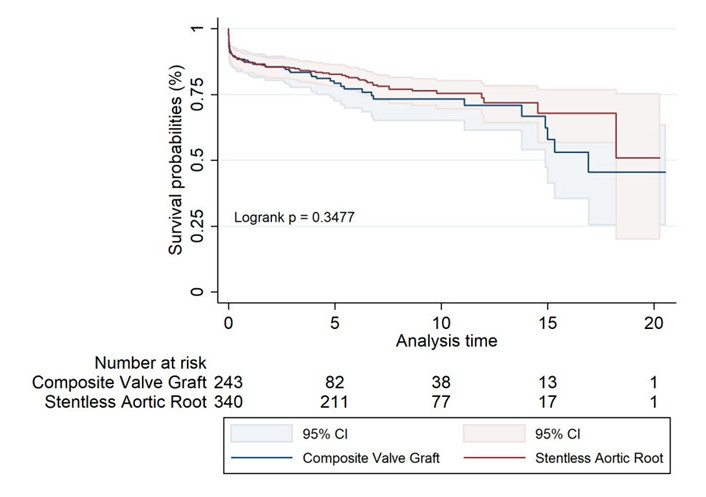
Unmatched Kaplan-Meier survival estimates for composite valve graft and stentless aortic root replacement
Long-term survival rates for unmatched groups of composite valve graft and stentless aortic root replacement
| Survival rates | 1 year | 5 years | 10 years | 15 years | 17 years | 20 years |
|---|---|---|---|---|---|---|
| Composite valve graft | 87% (82.1–90.7) | 79% (72.6–84.4) | 73% (65.1–79.9) | 58% (41.4–71.1) | 45% (25.5–63.4) | 45% (25.5–63.4) |
| Stentless aortic root | 87% (83.3–90.4) | 83% (78.1–86.4) | 75% (69.6–80.3) | 68% (56.7–76.8) | 68% (56.7–76.8) | 51% (20.1–75.3) |
In the propensity score-matched cohorts (Figure 2, Table 7), the SARR group demonstrated a statistically significant survival advantage, with a 20-year survival rate of 54% compared to 47% for the CVG group (log-rank P value of 0.047), suggesting a potential benefit for SARR in long-term outcomes when patient characteristics are well-matched.
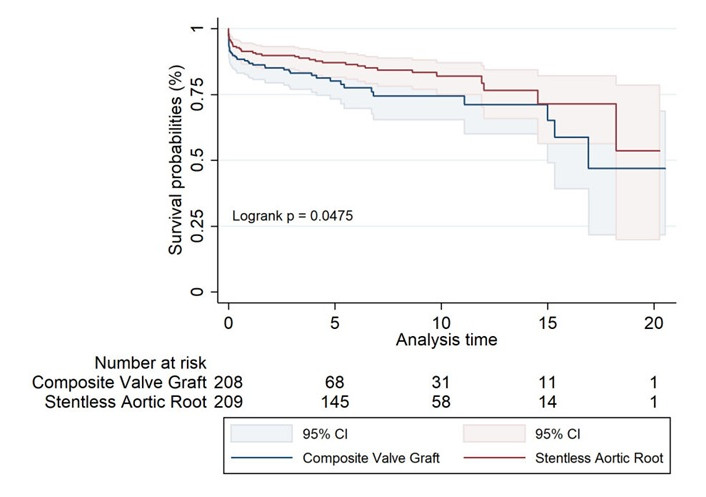
Propensity score matched Kaplan-Meier survival estimates for composite valve graft and stentless aortic root replacement
Long-term survival rates for matched groups of composite valve graft and stentless aortic root replacement over time
| Survival rates | 1 year | 5 years | 10 years | 15 years | 17 years | 20 years |
|---|---|---|---|---|---|---|
| Composite valve graft | 87% (81.3–90.8) | 80% (73.2–85.5) | 74% (65.4–81.3) | 65% (48.9–77.4) | 47% (21.7–68.8) | 47% (21.7–68.8) |
| Stentless aortic root | 91% (86.6–94.4) | 87% (81.6–91.0) | 82% (74.9–87.2) | 71% (56.3–82.2) | 71% (56.3–82.2) | 54% (19.9–78.6) |
Further analysis by specific graft type within the unmatched groups (Figure 3, Table 8) showed no significant differences in long-term survival across the different graft types, with the log-rank test yielding a P value of 0.069. While xenografts exhibited the highest survival rates, and biological CVGs the lowest, these trends did not reach statistical significance.
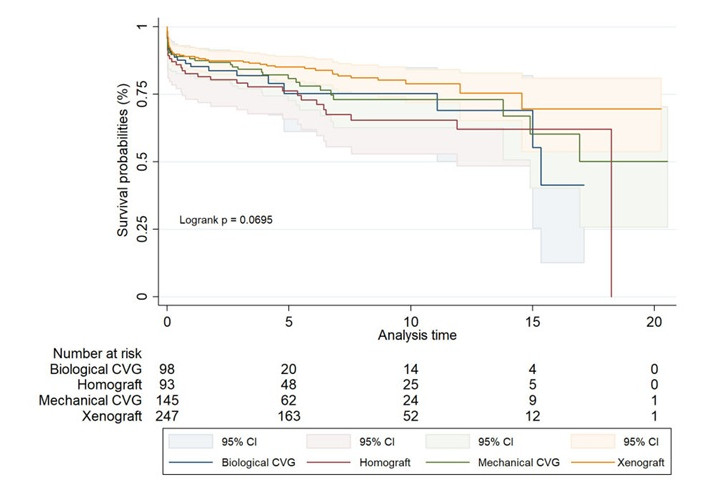
Unmatched Kaplan-Meier survival estimates for biological CVG, homograft, mechanical CVG, and xenograft
Long-term survival rates for different graft types over time in unmatched groups
| Survival rates | 1 year | 5 years | 10 years | 15 years | 17 years | 20 years |
|---|---|---|---|---|---|---|
| Biological CVG | 85% (76.2–90.9) | 75% (61.2–84.9) | 75% (61.2–84.9) | 55% (25.5–77.3) | 41% (12.6–68.7) | - |
| Homograft | 83% (73.2–88.9) | 76% (65.8–83.9) | 65% (52.9–75.3) | 62% (48.5–73.0) | 62% (48.5–73.0) | - |
| Mechanical CVG | 88% (81.7–92.5) | 81% (72.7–86.8) | 73% (62.7–80.9) | 60% (40.3–75.4) | 50% (25.9–70.4) | 50% (25.9–70.4) |
| Xenograft | 89% (84.4–92.4) | 85% (79.9–88.9) | 79% (71.9–84.2) | 70% (53.7–80.9) | 70% (53.7–80.9) | 70% (53.7–80.9) |
CVG: composite valve graft
In the propensity score-matched analysis by graft type (Figure 4, Table 9), xenografts continued to show superior outcomes, with a statistically significant survival advantage (log-rank P value of 0.009). Mechanical CVGs also performed well, although long-term data beyond 10 years were limited.
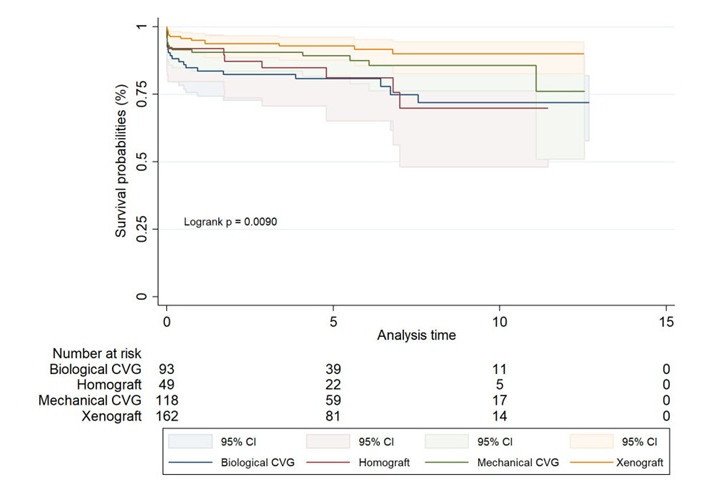
Matched Kaplan-Meier survival estimates for biological CVG, homograft, mechanical CVG, and xenograft
Long-term survival rates for different graft types over time in matched groups
| Survival rates | 1 year | 5 years | 10 years | 15 years | 17 years | 20 years |
|---|---|---|---|---|---|---|
| Biological CVG | 84% (74.3–89.8) | 81% (70.8–87.6) | 72% (57.8–81.9) | - | - | - |
| Homograft | 92% (79.7–96.9) | 81% (65.1–90.3) | 70% (48.1–83.9) | - | - | - |
| Mechanical CVG | 91% (83.6–94.7) | 89% (81.7–93.8) | 86% (76.2–91.5) | - | - | - |
| Xenograft | 95% (90.3–97.5) | 93% (87.5–96.0) | 90% (82.6–94.3) | - | - | - |
CVG: composite valve graft
The Cox regression analysis identified several key variables associated with long-term mortality (Table 10). In the unmatched analysis, older age, female gender, AR, longer CPB time, and postoperative complications such as deep sternal wound infection (DSWI) and postoperative ischemic bowel disease were significant predictors of increased long-term mortality.
Cox regression for long-term mortality
| Variable | Unmatched | Matched | ||||||
|---|---|---|---|---|---|---|---|---|
| HR | 95% CI lower | 95% CI upper | P value | HR | 95% CI lower | 95% CI upper | P value | |
| Age | 1.036 | 1.017 | 1.056 | < 0.001 | 1.052 | 1.025 | 1.079 | < 0.001 |
| Female gender | 1.904 | 1.221 | 2.970 | 0.005 | 1.601 | 0.875 | 2.929 | 0.127 |
| BMI | 0.982 | 0.944 | 1.022 | 0.375 | 0.951 | 0.898 | 1.007 | 0.082 |
| NYHA classification | 0.824 | 0.657 | 1.033 | 0.094 | 0.848 | 0.627 | 1.145 | 0.281 |
| HF | 1.148 | 0.901 | 1.462 | 0.264 | 1.233 | 0.841 | 1.809 | 0.283 |
| Previous cardiac surgery | 1.607 | 0.954 | 2.705 | 0.074 | 2.095 | 1.029 | 4.266 | 0.042 |
| Diabetes | 0.929 | 0.437 | 1.973 | 0.847 | 1.498 | 0.602 | 3.725 | 0.385 |
| Hypertension | 1.009 | 0.619 | 1.644 | 0.972 | 0.966 | 0.469 | 1.992 | 0.926 |
| Smoking | 1.074 | 0.788 | 1.462 | 0.652 | 1.319 | 0.887 | 1.961 | 0.172 |
| Renal disease | 0.835 | 0.604 | 1.155 | 0.276 | 0.880 | 0.569 | 1.359 | 0.564 |
| COPD | 1.183 | 0.632 | 2.214 | 0.600 | 1.380 | 0.588 | 3.236 | 0.459 |
| History of TIA/CVA | 0.751 | 0.528 | 1.069 | 0.112 | 0.662 | 0.207 | 2.112 | 0.486 |
| PAD | 1.437 | 0.845 | 2.442 | 0.181 | 1.145 | 0.514 | 2.549 | 0.741 |
| Preoperative AF | 1.525 | 0.817 | 2.847 | 0.185 | 1.807 | 0.774 | 4.221 | 0.171 |
| Extent of CAD | 1.275 | 0.961 | 1.691 | 0.093 | 1.198 | 0.770 | 1.862 | 0.423 |
| LMS involvement | 0.348 | 0.093 | 1.297 | 0.116 | 0.191 | 0.023 | 1.581 | 0.125 |
| LVEF | 1.065 | 0.751 | 1.509 | 0.725 | 0.814 | 0.464 | 1.427 | 0.473 |
| AS | 0.553 | 0.330 | 0.927 | 0.024 | 0.444 | 0.207 | 0.952 | 0.037 |
| AR | 3.666 | 2.297 | 5.851 | < 0.001 | 3.961 | 2.189 | 7.166 | < 0.001 |
| Cardiogenic shock | 2.150 | 0.874 | 5.290 | 0.096 | 0.859 | 0.209 | 3.526 | 0.833 |
| Preoperative inotropes | 3.523 | 1.441 | 8.610 | 0.006 | 2.002 | 0.380 | 10.561 | 0.413 |
| Preoperative intubation | 0.419 | 0.147 | 1.193 | 0.103 | 1.052 | 0.187 | 5.928 | 0.954 |
| Operative urgency | 1.298 | 0.951 | 1.772 | 0.101 | 1.325 | 0.865 | 2.028 | 0.196 |
| CPB time | 1.008 | 1.005 | 1.011 | < 0.001 | 1.009 | 1.005 | 1.013 | < 0.001 |
| ACX time | 0.998 | 0.996 | 0.999 | 0.013 | 0.999 | 0.997 | 1.001 | 0.173 |
| Circulatory arrest time | 0.999 | 0.985 | 1.013 | 0.904 | 0.998 | 0.979 | 1.017 | 0.805 |
| Homograft | 0.230 | 0.032 | 1.653 | 0.144 | 0.488 | 0.234 | 1.015 | 0.055 |
| Biological CVG | 0.293 | 0.039 | 2.176 | 0.230 | 0.939 | 0.437 | 2.015 | 0.871 |
| Mechanical CVG | 0.263 | 0.036 | 1.922 | 0.188 | - | - | - | - |
| Etiology-dissection | 0.841 | 0.376 | 1.881 | 0.673 | 1.057 | 0.357 | 3.134 | 0.920 |
| Etiology-aneurysm | 0.804 | 0.464 | 1.396 | 0.439 | 0.851 | 0.367 | 1.971 | 0.706 |
| Etiology-native valve IE | 1.330 | 0.581 | 3.046 | 0.500 | 1.685 | 0.503 | 5.644 | 0.398 |
| Etiology-prosthetic valve IE | 0.746 | 0.266 | 2.089 | 0.577 | 0.727 | 0.132 | 4.019 | 0.715 |
| Postoperative low CO | 0.681 | 0.442 | 1.051 | 0.083 | 0.825 | 0.460 | 1.478 | 0.517 |
| Re-intubation | 2.538 | 1.068 | 6.029 | 0.035 | 3.173 | 1.033 | 9.746 | 0.044 |
| Tracheostomy | 0.614 | 0.221 | 1.702 | 0.348 | 0.623 | 0.159 | 2.434 | 0.496 |
| Postoperative CVA | 2.104 | 0.632 | 7.002 | 0.225 | 1.608 | 0.600 | 4.315 | 0.345 |
| Post-op AF | 0.777 | 0.474 | 1.275 | 0.319 | 0.835 | 0.431 | 1.619 | 0.594 |
| Post-op CHB | 0.780 | 0.295 | 2.061 | 0.616 | 0.691 | 0.104 | 4.570 | 0.701 |
| Postoperative sepsis | 0.986 | 0.708 | 1.375 | 0.935 | 0.427 | 0.088 | 2.084 | 0.293 |
| DSWI | 3.687 | 1.605 | 8.471 | 0.002 | 21.131 | 1.091 | 409.111 | 0.044 |
| Postoperative RRT | 0.637 | 0.303 | 1.337 | 0.233 | 0.513 | 0.188 | 1.397 | 0.191 |
| Permanent dialysis | 1.246 | 0.513 | 3.025 | 0.627 | 0.769 | 0.212 | 2.792 | 0.690 |
| Postoperative ischaemic bowel disease | 7.184 | 1.892 | 27.269 | 0.004 | 36.975 | 4.654 | 293.770 | < 0.001 |
| Postoperative MOF | 8.279 | 3.619 | 18.939 | < 0.001 | 11.772 | 3.268 | 42.403 | < 0.001 |
| Postoperative hospital stay | 0.966 | 0.950 | 0.984 | < 0.001 | 0.963 | 0.935 | 0.992 | 0.013 |
ACX: aortic ceoss clamp; AF: atrial fibrillation; AR: aortic regurgitation; AS: aortic stenosis; BMI: body mass index; CAD: coronary artery disease; CHB: complete heart block; CI: confidence interval; CO: cardiac output; COPD: chronic obstructive pulmonary disease; CPB: cardiopulmonary bypass; CVA: cerebrovascular accident; CVG: composite valve graft; DSWI: deep sternal wound infection; HF: heart failure; HR: hazard ratio; IE: infective endocarditis; LMS: left main stem; LVEF: left ventricular ejection fraction; MOF: multi otgan failure; NYHA: New York Heart Association; PAD: peripheral arterial disease; RRT: renal replacement therapy; TIA: transient ischaemic attack
In the propensity score-matched cohort, age [hazard ratio (HR) 1.052, 95% CI 1.025–1.079, P < 0.001], AR (HR 3.961, 95% CI 2.189–7.166, P < 0.001), longer CPB time (HR 1.009, 95% CI 1.005–1.013, P < 0.001), and postoperative complications such as DSWI (HR 21.131, 95% CI 1.091–409.111, P = 0.044), postoperative ischemic bowel disease (HR 36.975, 95% CI 4.654–293.770, P < 0.001), and postoperative multi-organ failure (HR 11.772, 95% CI 3.268–42.403, P < 0.001) were significant predictors of mortality. Additionally, previous cardiac surgery (HR 2.095, 95% CI 1.029–4.266, P = 0.042) emerged as a significant factor in the matched cohort.
This study provides a comprehensive comparison of long-term outcomes between SARR and CVG in patients undergoing ARR. Through the use of PSM, we sought to minimize selection bias and create comparable groups to better understand the implications of each surgical approach.
Our analysis revealed that in-hospital outcomes, including low cardiac output syndrome, reoperation rates, and the need for postoperative renal replacement therapy, were not significantly different between the SARR and CVG groups, both before and after matching. This finding suggests that, in terms of immediate postoperative outcomes, both techniques are equally effective and safe for patients undergoing ARR. However, a notable and consistent finding was the higher incidence of neurological complications in the CVG group compared to the SARR group, a difference that remained significant even after matching. Neurological events are a serious concern in cardiac surgery, often leading to prolonged hospital stays, increased morbidity, and a higher likelihood of long-term disability. Several plausible explanations can be offered for the increased neurological events observed in CVG patients. One potential factor is the higher likelihood of microembolization associated with composite graft materials, which may contribute to cerebral ischemia and postoperative stroke risk [5]. Additionally, the longer circulatory arrest times in CVG procedures could lead to extended periods of cerebral hypoperfusion, increasing vulnerability to ischemic injury [6]. Another consideration is the heightened inflammatory response triggered by synthetic graft components [7], which may exacerbate endothelial dysfunction and impair cerebrovascular integrity. Further studies are needed to validate these hypotheses and explore potential mitigation strategies to reduce neurological complications in CVG patients.
When examining long-term survival, our study found no significant differences in the unmatched cohort; however, the propensity score-matched analysis indicated a statistically significant survival advantage for the SARR group at 20 years. The matched analysis also highlighted that xenografts might offer a long-term survival advantage over mechanical and biological composite grafts. This result is particularly relevant in the context of current debates about the optimal type of prosthesis for patients undergoing ARR. While mechanical valves are often preferred for their durability, they require lifelong anticoagulation, which carries risks of hemorrhage and thromboembolism. Conversely, bioprosthetic valves avoid the need for anticoagulation but are more prone to structural deterioration over time, potentially leading to reoperation. The superior performance of xenografts observed in our study suggests that they may offer a favourable balance between durability and the avoidance of anticoagulation-related complications, making them an attractive option for younger patients or those with a longer life expectancy.
A diverse range of mechanical, bioprosthetic, and human tissue valves is available for clinical use. With the aging population, the number of elderly patients needing AVR has surged in the past decade [8]. The choice of valve type for ARR remains particularly challenging in patients aged between 50 and 70 years. In younger patients, mechanical CVGs are often preferred due to their durability, which contributes to improved long-term survival [9]. A meta-analysis of reconstructed time-to-event data published in 2023 showed that composite aortic valve graft replacement with mechanical prosthesis is associated with better long-term outcomes in comparison with bioprosthetic valves [1]. While this meta-analysis provides broad comparative insights into mechanical versus bioprosthetic CVG, our study expands the scope by incorporating stentless alternatives, granular institutional data, and in-hospital outcomes, offering valuable new perspectives in surgical decision-making for ARR. Of course, the use of mechanical CVG is not without risks, as the potential for thromboembolic events necessitates careful consideration in patient selection and postoperative management [10].
Despite the evidence supporting mechanical valves, there has been an evident trend toward a preference for biological AVRs [11]. A 2024 study published in the Journal of the American Heart Association challenged the historical perception, demonstrating no significant differences in long-term survival between bioprosthetic and mechanical valves in patients undergoing the Bentall procedure, thereby contributing to the ongoing controversy regarding the optimal valve choice [12].
At the other end of the spectrum are stentless aortic grafts, which have been widely researched and utilized across numerous centers, consistently demonstrating excellent clinical outcomes due to their superior hemodynamics [13]. Previous studies have suggested that the use of stentless valves can lead to improved valve durability and function due to their more physiological design, which closely mimics the natural aortic root structure and reduces stress on the valve leaflets [14].
Aortic homografts, although less freely available, were once considered the “gold standard” for AVR during the 1980s and 1990s due to their excellent long-term outcomes [15]. These homografts offered superior hemodynamics and reduced valve-related complications compared to other prostheses [16]. Their flexible tissue properties made them ideal for reconstructing complex aortic root pathologies involving annular destruction [17]. However, homografts became less favoured after a large prospective study, initiated in 1987, highlighted their progressive structural deterioration over time, which led to their more selective use [18]. Additionally, redo procedures for degenerated aortic homografts can prove challenging due to heavy wall calcification [19]. Current guidelines now reserve allografts primarily for cases of active endocarditis with perivalvular lesions [20].
The limited availability of homografts has driven the search for other substitutes with comparable hemodynamic performance and durability. Xenografts demonstrated excellent haemodynamics in multiple studies [21–23], and have also exhibited good long-term durability [24–27]. In 2021, Melina et al. [13] published a study on late survival and its determinants for patients randomly assigned to receive one of two stentless aortic roots—homografts or xenografts—showing similar survival rates between the two techniques at twenty years, further cementing the argument for the use of xenografts.
As the body of evidence continues to expand, our study suggests that xenografts might have the potential to outperform mechanical CVGs in certain patient populations, particularly when considering long-term survival. Conversely, while existing literature indicates that early clinical outcomes, such as mortality and morbidity rates, are comparable between xenografts and stented aortic bioprostheses similar to this study, xenografts demonstrate distinct advantages in key functional parameters [28]. Notably, they exhibit superior transvalvular gradients, larger effective orifice areas, and greater regression of left ventricular hypertrophy, particularly when employed in a full-root configuration [28]. This coupled with significant survival advantage in the full-root variant positions xenografts as a strong contender in the ongoing debate regarding the optimal valve choice for ARR. These findings support the broader use of xenografts in ARR, especially for patients who may benefit from their physiological design and lower risk of thromboembolic events.
This study has several limitations that need to be acknowledged. Firstly, as a retrospective analysis, it is subject to inherent biases and limitations associated with retrospective data collection, such as selection bias, recall bias, and the inability to control for all potential confounders. Although PSM was used to minimize these biases, unmeasured variables may still have influenced the results. Secondly, a criticism of the study is that it has varied aortic pathology and that focus should be on the dominant pathology with exclusion of less common disorders to minimize bias. On the contrary, we strongly believe that exclusion of cases does not provide a true reflection of real-world experience and acknowledge this aspect as a limitation of the study. Thirdly, the study was conducted at a single institution, which may limit the generalizability of the findings. Different institutions may have variations in surgical techniques, patient selection criteria, and postoperative care, which could affect outcomes. Additionally, the exclusion of valve-sparing techniques from this analysis, despite their known benefits in selected populations, may limit the applicability of the results to broader clinical practice. Fourthly, the study’s follow-up period beyond 20 years was limited, particularly for certain graft types, affecting the robustness of long-term survival estimates. While we observed a survival advantage for xenografts in the matched analysis, longer follow-up and larger sample sizes are needed to confirm these findings and determine whether this advantage persists over an even longer time horizon. Although Kaplan-Meier curves were presented up to 20 years, the number of patients at risk significantly declined after 10 years, particularly within the homograft subgroup. This limitation is evident in Tables 6–9 and must be taken into account when interpreting long-term survival trends, as late survival differences beyond this point are based on sparse data. Finally, the higher incidence of neurological complications in the CVG group raises important questions that were not fully explored in this study. Future research should focus on identifying the underlying causes of these events and determining whether modifications in surgical technique or patient management can reduce their occurrence.
While our PSM was based on logistic regression for treatment allocation (SARR vs. CVG), this approach does not account for time-to-event bias directly. As a result, potential imbalance in survival-related covariates may persist even after matching. Alternative methods such as PSM based on Cox regression or the use of inverse probability of treatment weighting could potentially provide improved adjustment for survival analyses. However, these approaches may introduce additional complexity, especially in retrospective datasets with heterogeneity in follow-up duration. We recognize this as a methodological limitation and an important consideration for future research.
This study offers valuable insights into the long-term outcomes of SARR and CVG in ARR. Our findings indicate that, while both techniques provide comparable in-hospital outcomes, SARR, particularly xenografts, may offer a significant long-term survival advantage. The superior hemodynamics and durability of xenografts position them as a viable alternative to mechanical CVGs, particularly in patients who may benefit from avoiding anticoagulation-related complications. As the evidence continues to evolve, xenografts could play an increasingly prominent role in ARR, especially for younger patients or those with longer life expectancies. However, further studies are needed to confirm these advantages and refine the decision-making process in ARR to optimize patient outcomes across diverse populations.
AR: aortic regurgitation
ARR: aortic root replacement
AVR: aortic valve replacement
BMI: body mass index
CABG: coronary artery bypass grafting
CAD: coronary artery disease
CIs: confidence intervals
CPB: cardiopulmonary bypass
CVG: composite valve graft
DSWI: deep sternal wound infection
NYHA: New York Heart Association
ORs: odds ratios
PSM: propensity score matching
SARR: stentless aortic root replacement
The authors acknowledge the support of Siobhan Daley and Andy Ryan from Department of Quality & Safety, Harefield Hospital. Abstract presented at the EACTS 38th Annual Meeting, Lisbon, Portugal, 9–12 October 2024.
MC: Conceptualization, Formal analysis, Writing—original draft. MYS: Investigation. FDR, TB, SKB, and JAG: Writing—review & editing. SGR: Conceptualization, Data curation, Writing—original draft, Writing—review & editing. All authors read and approved the submitted version.
The authors declare that there are no conflicts of interest.
The study was approved by the Harefield Hospital ethics committee (Q&S 15/02/2024) and complies with the Declaration of Helsinki.
Informed consent to participate in the study was waived by the Harefield Hospital ethics committee due to the retrospective nature of the study.
Not applicable.
The datasets generated and/or analyzed during the current study are not publicly available due to General Data Protection Regulation (GDPR) but are available from the senior author on reasonable request (SGR, Email: drrajashahzad@hotmail.com).
Not applicable.
© The Author(s) 2025.
Open Exploration maintains a neutral stance on jurisdictional claims in published institutional affiliations and maps. All opinions expressed in this article are the personal views of the author(s) and do not represent the stance of the editorial team or the publisher.
Copyright: © The Author(s) 2025. This is an Open Access article licensed under a Creative Commons Attribution 4.0 International License (https://creativecommons.org/licenses/by/4.0/), which permits unrestricted use, sharing, adaptation, distribution and reproduction in any medium or format, for any purpose, even commercially, as long as you give appropriate credit to the original author(s) and the source, provide a link to the Creative Commons license, and indicate if changes were made.

View: 2636
Download: 213
Times Cited: 0
