 Original Article

Affiliation:
1Department of Neurological Surgery, Graduate School of Medicine, Chiba University, Chiba 260-8670, Japan
2Department of Biochemistry and Genetics, Graduate School of Medicine, Chiba University, Chiba 260-8670, Japan
3Department of Clinical Oncology, Toho University Graduate School of Medicine, Tokyo 143-8541, Japan
Email: hiwasa_takaki@faculty.chiba-u.jp
ORCID: https://orcid.org/0000-0002-0475-3881
Affiliation:
1Department of Neurological Surgery, Graduate School of Medicine, Chiba University, Chiba 260-8670, Japan
2Department of Biochemistry and Genetics, Graduate School of Medicine, Chiba University, Chiba 260-8670, Japan
ORCID: https://orcid.org/0000-0002-6403-2429
Affiliation:
1Department of Neurological Surgery, Graduate School of Medicine, Chiba University, Chiba 260-8670, Japan
2Department of Biochemistry and Genetics, Graduate School of Medicine, Chiba University, Chiba 260-8670, Japan
ORCID: https://orcid.org/0000-0001-9160-945X
Affiliation:
1Department of Neurological Surgery, Graduate School of Medicine, Chiba University, Chiba 260-8670, Japan
2Department of Biochemistry and Genetics, Graduate School of Medicine, Chiba University, Chiba 260-8670, Japan
ORCID: https://orcid.org/0009-0006-5817-9586
Affiliation:
1Department of Neurological Surgery, Graduate School of Medicine, Chiba University, Chiba 260-8670, Japan
2Department of Biochemistry and Genetics, Graduate School of Medicine, Chiba University, Chiba 260-8670, Japan
4Department of Rehabilitation in Traditional Chinese Medicine, The Second Affiliated Hospital of Zhejiang University School of Medicine, Hangzhou 310003, Zhejiang, P. R. China
ORCID: https://orcid.org/0000-0001-9014-1146
Affiliation:
1Department of Neurological Surgery, Graduate School of Medicine, Chiba University, Chiba 260-8670, Japan
ORCID: https://orcid.org/0009-0003-2962-4765
Affiliation:
1Department of Neurological Surgery, Graduate School of Medicine, Chiba University, Chiba 260-8670, Japan
ORCID: https://orcid.org/0000-0001-8344-8940
Affiliation:
5Department of Endocrinology, Hematology and Gerontology, Graduate School of Medicine, Chiba University, Chiba 260-8670, Japan
6Department of Diabetes, Metabolism and Endocrinology, School of Medicine, International University of Health and Welfare, Chiba 286-8686, Japan
ORCID: https://orcid.org/0000-0002-9599-2465
Affiliation:
2Department of Biochemistry and Genetics, Graduate School of Medicine, Chiba University, Chiba 260-8670, Japan
Affiliation:
1Department of Neurological Surgery, Graduate School of Medicine, Chiba University, Chiba 260-8670, Japan
7Department of Neurological Surgery, Chiba Prefectural Sawara Hospital, Chiba 287-0003, Japan
8Department of Neurological Surgery, Chiba Cerebral and Cardiovascular Center, Chiba 290-0512, Japan
Affiliation:
1Department of Neurological Surgery, Graduate School of Medicine, Chiba University, Chiba 260-8670, Japan
8Department of Neurological Surgery, Chiba Cerebral and Cardiovascular Center, Chiba 290-0512, Japan
9Department of Neurosurgery, Eastern Chiba Medical Center, Chiba 283-8686, Japan
ORCID: https://orcid.org/0000-0002-7393-5347
Affiliation:
10Department of Cardiovascular Medicine, Graduate School of Medicine, Chiba University, Chiba 260-8670, Japan
Affiliation:
11Port Square Kashiwado Clinic, Kashiwado Memorial Foundation, Chiba 260-0025, Japan
Affiliation:
3Department of Clinical Oncology, Toho University Graduate School of Medicine, Tokyo 143-8541, Japan
Affiliation:
12Department of Gastroenterological Surgery and Clinical Oncology, Toho University Graduate School of Medicine, Tokyo 143-8541, Japan
ORCID: https://orcid.org/0000-0002-5529-9690
Affiliation:
3Department of Clinical Oncology, Toho University Graduate School of Medicine, Tokyo 143-8541, Japan
12Department of Gastroenterological Surgery and Clinical Oncology, Toho University Graduate School of Medicine, Tokyo 143-8541, Japan
Affiliation:
5Department of Endocrinology, Hematology and Gerontology, Graduate School of Medicine, Chiba University, Chiba 260-8670, Japan
Affiliation:
1Department of Neurological Surgery, Graduate School of Medicine, Chiba University, Chiba 260-8670, Japan
ORCID: https://orcid.org/0000-0001-5689-3416
Explor Cardiol. 2025;3:101258 DOI: https://doi.org/10.37349/ec.2025.101258
Received: February 14, 2025 Accepted: April 25, 2025 Published: May 29, 2025
Academic Editor: Jean-Jacques Schott, Nantes University, France
Aim: Atherosclerosis and diabetes mellitus (DM) often lead to severe conditions, such as acute ischemic stroke (AIS), cardiovascular disease (CVD), and chronic kidney disease (CKD). Some cancers are also associated with atherosclerosis. Therefore, identifying novel autoantibody biomarkers associated with atherosclerosis-related conditions is crucial for improving early diagnosis and risk assessment.
Methods: We used an array of 9,480 proteins to detect IgG antibodies in the serum of patients with atherosclerosis. Following this screening, we quantified the antibody levels using an amplified luminescent proximity homogeneous assay-linked immunosorbent assay (AlphaLISA) with recombinant antigen proteins.
Results: Ubiquitin conjugating enzyme E2 E3 (UBE2E3) was identified as a candidate antigen recognized by IgG antibodies in the sera of individuals diagnosed with atherosclerosis. Compared with healthy donors, significantly higher serum antibody levels against UBE2E3 were found in patients with AIS, DM, CVD, CKD, esophageal cancer (EC), and gastric cancer (GC), but not in those with colorectal cancer (CRC). Receiver operating characteristic (ROC) analysis revealed that the higher areas under the ROC curves for anti-UBE2E3 antibodies were observed in DM- or nephrosclerosis-associated CKD than in the others. Spearman’s correlation analysis revealed that serum anti-UBE2E3 antibody (s-UBE2E3-Ab) levels were associated with the plaque score, maximum intima-media thickness, and cardio-ankle vascular index, which are typical indices of atherosclerosis and stenosis. In the survival analysis of GC and CRC, patients who were s-UBE2E3-Ab-positive had significantly poorer prognoses than patients who were s-UBE2E3-Ab-negative. The difference became more prominent when s-UBE2E3-Abs were combined with anti-differential screening-selected gene aberrant in neuroblastoma antibody (DAN-Ab) or sclerostin domain-containing protein 1 (SOSTDC1), which are bone morphogenetic protein (BMP) antagonists.
Conclusions: The s-UBE2E3-Ab marker is highly associated with atherosclerosis-related diseases, such as AIS, CVD, DM, CKD, and digestive tract cancers, suggesting the involvement of BMP signals.
In contrast to enzymes, antigens, and nucleic acid biomarkers, few antibody biomarkers have been used clinically [1]. The presence of autoantibodies has been noted in individuals with autoimmune diseases and cancer; however, little is known about autoantibodies in other diseases. We have performed a large-scale screening using serological identification of antigens by cDNA expression cloning (SEREX) to select antigenic proteins recognized by serum IgG antibodies in patients with esophageal cancer (EC) from a cDNA library [2, 3]. Some antibodies against the selected antigens showed significantly higher levels in patients than in healthy donors (HDs), suggesting that these antibodies could be tumor markers.
The development of autoantibodies is attributable to the overexpression of antigenic proteins in tumor tissues, followed by tissue damage and leakage of intracellular proteins outside the cells [2–5]. If atherosclerosis is similar and is accompanied by damage to arterial blood vessels, specific antibody markers can be identified. Therefore, we began searching for autoantibody markers of atherosclerosis and related diseases using SEREX and a newly developed protein array method.
Atherosclerosis is caused by various risk factors, such as diabetes mellitus (DM), chronic kidney disease (CKD), hypertension, and dyslipidemia, and is complicated by the onset of acute ischemic stroke (AIS) and cardiovascular disease (CVD) [6]. Autoantibody markers of atherosclerosis, such as anti-ATP2B4 [7], anti-SH3BP5 [8], anti-AP3D1 [9], and anti-KIAA0513 antibodies [10], are commonly associated with AIS, CVD, DM, and CKD. Some of these markers have elevated levels in patients with gastrointestinal cancer. Furthermore, angiogenesis is essential for the development of solid tumors [11], and both DM and atherosclerosis are risk factors for EC and colorectal cancer (CRC) [12].
Autoantibody markers have also been associated with AIS and acute myocardial infarction (AMI). Elevated autoantibodies detected within two weeks of disease onset are thought to have been present before onset, because increases in new antibody levels are not detectable within two weeks. We identified anti-DIDO1, anti-FOXJ2, anti-CPSF2 [13], and anti-AP3D1 [9] antibodies in patients with AIS within two weeks, and a case-control study nested within the JPHC-based prospective study revealed that patients who were antibody-positive had significantly greater AIS onset frequencies than patients who were antibody-negative [9, 13]. This suggests that autoantibodies may be useful markers for predicting AIS onset.
Each antibody biomarker exhibits different properties. For example, anti-DIDO1-antibodies are closely associated with CKD, whereas anti-FOXJ2 and anti-AP3D1 antibodies reflect arterial stenosis [9, 13]. Anti-CPSF2 antibodies are associated with DM and hypertension [13]. Thus, identifying as many markers as possible allows for a more precise diagnosis.
This study investigates serum antibodies against ubiquitin conjugating enzyme E2 E3 (UBE2E3) in patients with atherosclerosis-related diseases, including AIS, DM, CVD, CKD, and digestive tract cancers.
The local ethical review boards of Chiba University, Graduate School of Medicine, Toho University, Faculty of Medicine, Toho University Omori Medical Center, and Port Square Kashiwado Clinic, and the review boards of the participating hospitals approved this study. All experimental procedures adhered to the guidelines of the Declaration of Helsinki (2013). Serum samples were collected from the donors after obtaining written informed consent.
All serum samples were centrifuged at 3,000 g for 10 min. The supernatants were stored at –80°C to avoid repeated freezing/thawing.
Serum samples from 127 patients with AIS were obtained from Chiba Prefectural Sawara Hospital within two weeks of disease onset (AIS cohort). The Sawara cohort comprised 665 specimens obtained from Chiba Prefectural Sawara Hospital, including 139 from HDs, 228 from patients with AIS, 44 with transient ischemic attack, 122 with deep and subcortical white matter hyperintensity, 17 with asymptomatic cerebral infarction, 59 with chronic-phase cerebral infarction, and 56 disease controls. Sera of 275 and 100 patients with DM and CVD, respectively, were obtained from Chiba University Hospital (DM and CVD cohorts, respectively); the CVD cases included those with AMI and unstable angina pectoris. Serum samples from 300 patients with CKD were obtained from Kumamoto University (CKD cohort) [14, 15]. Serum samples from 285 patients with EC, gastric cancer (GC), or CRC were collected immediately before surgery, radiotherapy, or chemotherapy at the Department of Surgery, Toho University Hospital (cancer cohort). Serum samples from HDs (HD cohort) were collected from three institutions: Chiba University Hospital, Port Square Kashiwado Clinic, and Chiba Prefectural Sawara Hospital. All HD serum samples were obtained from individuals without any abnormalities on cranial magnetic resonance imaging.
The first screening was performed using the ProtoArray Human Protein Microarrays (version 4.0; Thermo Fisher Scientific, Waltham, MA, USA), which contained 9,480 proteins, as described previously [16–18]. Thirty serum samples (10 from HDs and 10 from patients with atherosclerosis) were analyzed to identify antigens specifically recognized by serum IgG antibodies. The data were processed using Prospector software, which employs M-statistics (Thermo Fisher Scientific). To compare the two groups, a positivity threshold for each protein was determined using M-statistics (Supplementary material), which included background subtraction, normalization of signals, and analysis of differences between patients and HDs. The proportion of subjects in each group showing an immune response above this threshold was scored, and the significance of the difference between the two groups was assessed by calculating the P-value, as described previously [19].
Full-length cDNA of human UBE2E3 (accession number: NM_006357) was purchased from Open Biosystems (Huntsville, AL, USA) and recombined into pGEX-6P (Cytiva, Pittsburgh, PA, USA). The cDNA product was expressed by treating Escherichia coli (E. coli) KRX (Promega, Madison, WI, USA) cells containing the pGEX-6P-UBE2E3 and pMINOR with 0.5 mM isopropyl-β-D-thiogalactoside at 37°C for 3 h [20]. The cells were lysed by sonication in phosphate-buffered saline containing 2 mM dithiothreitol. The proteins were purified using Glutathione-Sepharose 4 Fast Flow medium (Cytiva) and a HiPrep 26/10 desalting column (Cytiva) and concentrated to 1.3 g/mL in phosphate-buffered saline containing 2 mM dithiothreitol. For comparison, antigenic differential screening-selected gene aberrant in neuroblastoma (DAN) protein and sclerostin domain-containing protein 1 (SOSTDC1) peptide were prepared. The region between positions 267 and 731 of the DAN cDNA (accession number: X66872.1) was inserted into the EcoRI/XhoI site of pGEX-2T (GE Healthcare Life Sciences, Pittsburgh, PA, USA), which produced a truncated DAN protein (amino acid residues 25–178) lacking its potential signal peptide sequence. The glutathione S-transferase (GST)-fused DAN protein was purified, as described previously [21]. The biotinylated peptide between amino acid residues 156 and 170 of SOSTDC1 (accession number: NM_015464) was synthesized and purified using high-performance liquid chromatography (HPLC), as described previously [16]. The SOSTDC1 peptide structure was biotin-KITVVTACKCKRYTR-COOH, with a purity of > 90%.
Serum antibody levels were examined using amplified luminescence proximity homogeneous assay-linked immunosorbent assay (AlphaLISA) in 384-well microtiter plates (white opaque OptiPlate™, Perkin Elmer, Waltham, MA, USA). AlphaLISA required two types of beads: a donor bead that binds to the antigen via a tag and an acceptor bead that binds the IgG antibody via a secondary antibody. IgG antibody binding to the antigen in solution brings the two beads close together, and excitation at 680 nm results in emission at 618 nm. No plate washing was required. Each well contained 2.5 µL of 1:100-diluted serum with 2.5 µL of GST, GST-UBE2E3, or GST-DAN proteins (10 µg/mL) or biotinylated SOSTDC1 peptide (400 ng/mL) in AlphaLISA buffer. The buffer was composed of 25 mM N-2-hydroxyethylpiperazine-N-2-ethane sulfonic acid (pH 7.4), 0.1% casein, 0.5% Triton X-100, 1 mg/mL dextran-500, and 0.05% ProClin-300, following the manufacturer’s instructions (https://www.revvity.co.jp/content/elisa-alphalisa-immunoassay-conversion-made-easy). The reaction mixture was incubated at room temperature for 6–8 h. Anti-human IgG-conjugated acceptor beads (2.5 µL at 40 µg/mL) and either glutathione- or streptavidin-conjugated donor beads (2.5 µL at 40 µg/mL) were added, and the mixture was incubated at room temperature in the dark for 7–14 days. Chemical emissions at 607–623 nm (alpha photon counts), which indicated the antigen-antibody binding level, were measured using an EnSpire Alpha microplate reader (PerkinElmer), as described previously [7–9, 13, 16–18]. Specific reactions were determined by subtracting the alpha emission counts of the GST and buffer control from those of the GST-fused proteins and biotinylated peptides, respectively.
We employed the Mann–Whitney U test to examine differences between two groups and the Kruskal–Wallis test (Mann–Whitney U test with the Bonferroni correction) to evaluate differences among three or more groups. Spearman’s correlation analysis, logistic regression analysis, the chi-square test, and univariate and multivariate analyses were used to calculate the correlations. We assessed the predictive values of the putative disease markers using receiver operating characteristic (ROC) curve analysis. The sensitivity and specificity were calculated using the cutoff values of the Youden Index. All statistical analyses were performed using GraphPad Prism (version 5; GraphPad Software, Inc.). Patient survival was evaluated using the Kaplan–Meier method, and the results were compared using the log-rank test. The cutoff values were determined using X-tile software (version 3.6.1; Yale University, New Haven, CT) [22]. All tests were two-tailed, and P-values < 0.05 indicated statistically significant differences.
We used ProtoArray to identify antigens using IgG antibodies from the sera of patients with atherosclerosis. UBE2E3 (accession number: NM_006357) was a candidate antigen because of its high positive reactivity rate (6 of 10 serum samples) in patients with atherosclerosis and low positive reactivity rate (2 of 10 samples) in HDs. All ProtoArray results are available in the public Figshare database (https://figshare.com/articles/dataset/Results_of_protein_array_for_atherosclerosis/25906330).
We examined serum antibody levels in patients with AIS using recombinant UBE2E3 protein. Sera from HDs and patients with AIS (AIS cohort) were obtained from the Chiba Prefectural Sawara Hospital. The sample numbers (total, male, female) and the average age ± standard deviation (SD) are shown in Table 1. The AlphaLISA results revealed that anti-UBE1E3 antibody (UBE2E3-Ab) levels were significantly higher in patients with AIS than in HDs (Figure 1A). Cutoff values were determined using the average plus two SDs of the HD values. The positivity rates of UBE2E3-Abs for the HDs and patients with AIS were 3.9% and 12.6%, respectively (Table 1). ROC analysis revealed that the area under the ROC curve (AUC) for UBE2E3-Abs was 0.6806 [95% confidence interval (CI): 0.6156–0.7456] (Figure 2A). Using the cutoff value based on the Youden index, the sensitivity and specificity for UBE2E3-Abs were 64.6% and 64.8%, respectively.
Serum UBE2E3-Ab levels in healthy donors (HDs) and patients with acute ischemic stroke (AIS)
| Sample information and alpha analysis | |||
|---|---|---|---|
| (A) Sample information | HD | AIS | |
| Total sample number | 128 | 127 | |
| Male/Female | 57/71 | 71/56 | |
| Age (average ± SD) | 47.0 ± 14.5 | 76.8 ± 11.0 | |
| (B) Alpha analysis (antibody level) | UBE2E3-Ab | ||
| HD | Average | 8,025 | |
| SD | 5,811 | ||
| Cutoff value | 19,647 | ||
| Positive No. | 5 | ||
| Positive rate (%) | 3.9% | ||
| AIS | Average | 11,960 | |
| SD | 10,035 | ||
| Positive No. | 16 | ||
| Positive rate (%) | 12.6% | ||
| P (vs. HD) | 1.7E-04 | ||
The upper panel (A) indicates the information of serum samples, including the number of total samples, male or female, as well as ages [average ± standard deviation (SD)]. The lower panel (B) summarizes the serum antibody levels against the UBE2E3-GST protein examined by the amplified luminescence proximity homogeneous assay-linked immunosorbent assay (AlphaLISA) method. Cutoff values were set at the average HD values plus two SD, and positive samples higher than the cutoff value were scored. P values were calculated using the Mann–Whitney U test. P value < 0.05 and positive rate > 10% are marked in bold text. A scatter dot plot of the same results is shown in Figure 1A
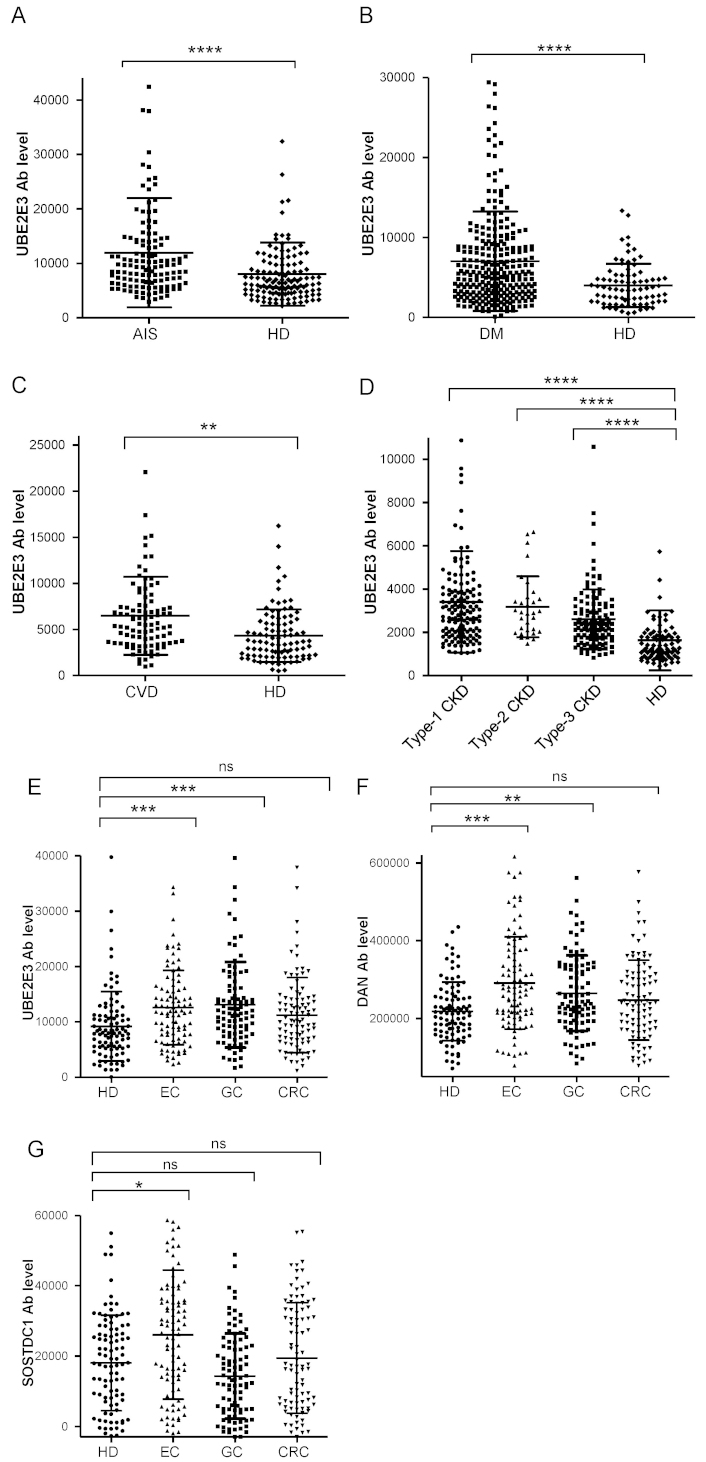
Comparison of serum anti-UBE2E3 antibody (UBE2E3-Ab) levels between HDs and patients. The UBE2E3-Ab levels of healthy donors (HDs) and patients with acute ischemic stroke (AIS) (A), diabetes mellitus (DM) (B), cardiovascular disease (CVD) (C), chronic kidney disease (CKD) (D), and esophageal cancer (EC), gastric cancer (GC), and colorectal cancer (CRC) (E) were examined by amplified luminescence proximity homogeneous assay-linked immunosorbent assay (AlphaLISA) using GST-UBE2E3 protein as the antigen, and shown in scatter dot plots. The ordinate represents Alpha emission photon counts, which correspond to the antibody levels. Serum anti-differential screening-selected gene aberrant in neuroblastoma antibody (DAN-Ab) (F) and anti-SOSTDC1 antibodies (SOSTDC1-Ab) levels (G) between HDs and patients with cancer were also examined. Type-1, type-2, and type-3 CKDs represent diabetic kidney disease, nephrosclerosis, and glomerulonephritis, respectively. The bars represent the average and average ± SD. P values were calculated using the Kruskal–Wallis test. ** P < 0.01; *** P < 0.001; **** P < 0.0001 vs. HD specimens. ns: not significant. The total (male/female) numbers, average ages ± standard deviations (SDs), average antibody levels ± SDs, cutoff values, positive numbers, positive rates (%), and P values versus HDs are summarized in Tables 1–5
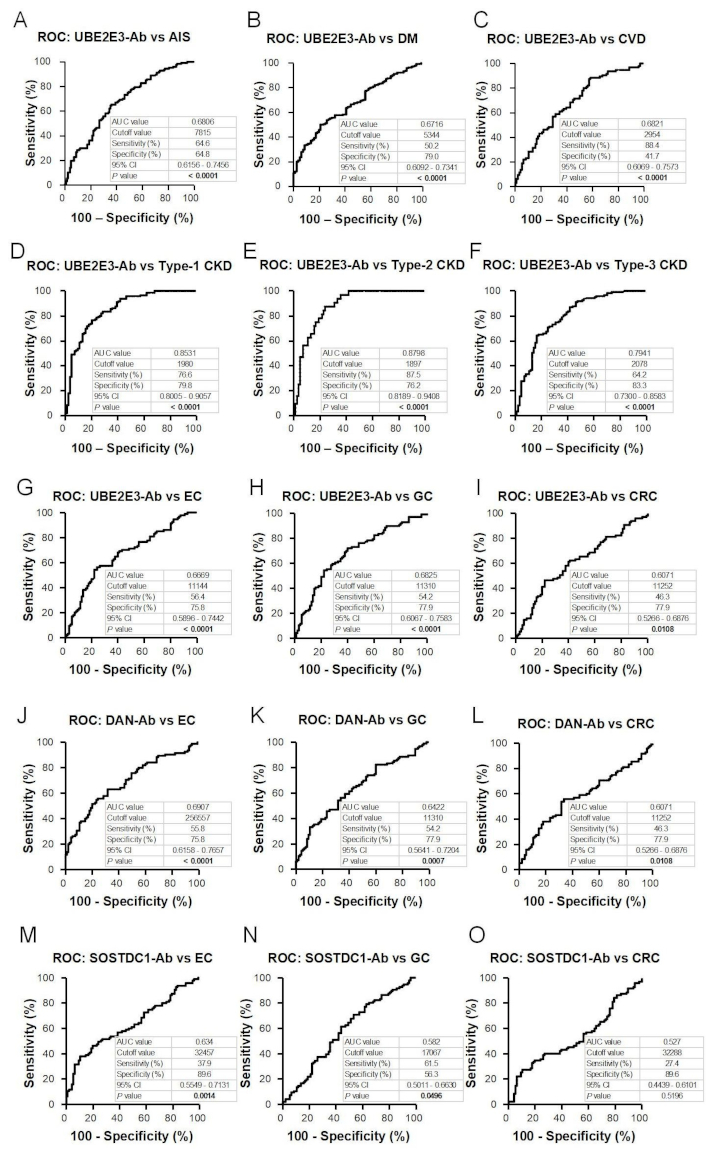
Receiver operating characteristic curve (ROC) analysis. The abilities of UBE2E3-Abs to detect acute ischemic stroke (AIS) (A), diabetes mellitus (DM) (B), cardiovascular disease (CVD) (C), type-1 chronic kidney disease (CKD) (D), type-2 CKD (E), type-3 CKD (F), esophageal cancer (EC) (G), and gastric cancer (GC) (H) and colorectal cancer (CRC) (I) were evaluated using ROC analysis. Anti-differential screening-selected gene aberrant in neuroblastoma antibodies (DAN-Abs) to detect EC (J) and GC (K), and CRC (L) and SOSTDC1-Abs to detect EC (M), GC (N), and CRC (O) were also examined. The numbers in the figures represent area under the ROC curve (AUC), cutoff values (Youden index) for antibody levels, sensitivity, specificity, 95% confidence interval (CI), and P values. P values < 0.05 are marked in bold text
Next, we examined the UBE2E3-Ab levels in patients with DM. Serum samples from HDs and patients with DM (DM cohort) were obtained from Chiba University Hospital. The UBE2E3-Ab levels were significantly higher in patients with DM than in HDs (Figure 1B). At the cutoff value (average plus two SDs of the HD values), the positivity rates of UBE2E3-Abs in HDs and patients with DM were 4.9% and 22.2%, respectively (Table 2). ROC analysis was performed to evaluate the diagnostic ability for patients with DM. The AUC for UBE2E3-Abs was 0.6716, yielding a sensitivity and specificity of 50.2% and 79.0%, respectively (Figure 2B).
Analysis of the serum anti-UBE2E3 antibody (UBE2E3-Ab) levels among HDs and patients with diabetes mellitus (DM)
| Sample information and alpha analysis | |||
|---|---|---|---|
| (A) Sample information | HD | DM | |
| Total sample number | 81 | 275 | |
| Male/Female | 46/35 | 156/119 | |
| Age (Average ± SD) | 45.2 ± 11.0 | 63.1 ± 12.0 | |
| (B) Alpha analysis (antibody level) | UBE2E3-Ab | ||
| HD | Average | 4,003 | |
| SD | 2,709 | ||
| Cutoff value | 9,421 | ||
| Positive No. | 4 | ||
| Positive rate (%) | 4.9% | ||
| DM | Average | 7,034 | |
| SD | 6,207 | ||
| Positive No. | 61 | ||
| Positive rate (%) | 22.2% | ||
| P (vs. HD) | 9.8E-10 | ||
The upper panel (A) represents the total numbers, sex (male and female), and ages (average ± SD). The lower panel (B) provides a summary of the serum antibody levels, measured as Alpha photon counts using amplified luminescence proximity homogeneous assay-linked immunosorbent assay (AlphaLISA) with UBE2E3-GST protein. Cutoff values were defined as the average healthy donor (HD) values plus two SD, and positive samples higher than the cutoff value were scored. P value < 0.05 and positive rate > 10% are marked in bold text. A scatter dot plot of the same results is shown in Figure 1B
We then examined UBE2E3-Ab levels in patients with CVD. Sera from HDs and patients with CVD (CVD cohort) were obtained from Chiba University Hospital. UBE2E3-Ab levels were significantly higher in patients with CVD than in HDs (Figure 1C). Using the cutoff values (average plus two SDs of the HD values), the UBE2E3-Ab positivity rates for HDs and patients with CVD were 5.1% and 8.0%, respectively (Table 3). The AUC value of UBE2E3-Abs was 0.6821 (95% CI: 0.6069–0.7573), with a sensitivity and specificity of 88.4% and 41.7%, respectively (Figure 2C).
Contrast of the serum UBE2E3-Ab levels in HDs and patients with cardiovascular disease (CVD)
| Sample information and alpha analysis | |||
|---|---|---|---|
| (A) Sample information | HD | CVD | |
| Total sample number | 78 | 100 | |
| Male/Female | 46/32 | 84/16 | |
| Age (Average ± SD) | 45.3 ± 11.2 | 66.1 ± 11.3 | |
| (B) Alpha analysis (antibody level) | UBE2E3-Ab | ||
| HD | Average | 4,650 | |
| SD | 3,756 | ||
| Cutoff value | 12,162 | ||
| Positive No. | 4 | ||
| Positive rate (%) | 5.1% | ||
| CVD | Average | 6,375 | |
| SD | 4,211 | ||
| Positive No. | 8 | ||
| Positive rate (%) | 8.0% | ||
| P (vs. HD) | 4.4E-03 | ||
The upper panel (A) displays the total number of samples, along with a breakdown by sex and the age distribution (average ± SD). The lower panel (B) shows the serum antibody levels examined by amplified luminescence proximity homogeneous assay-linked immunosorbent assay (AlphaLISA) using the antigen, purified UBE2E3-GST, as described in the legend of Table 1. P value < 0.05 is marked in bold text. A scatter dot plot of the same results is shown in Figure 1C
Next, we analyzed the antibody levels in the sera of patients with CKD (CKD cohort), a condition strongly associated with atherosclerosis. CKD was divided into three subtypes: type 1, diabetic kidney disease; type 2, nephrosclerosis; and type 3, glomerulonephritis. Samples from patients with CKD were obtained from the Kumamoto cohort, and samples from HDs were obtained from Chiba University Hospital. Patients in all three CKD groups had significantly higher serum UBE2E3-Ab levels than the HDs (Figure 1D). The UBE2E3-Ab positivity rates in HDs and patients with types 1, 2, and 3 CKD were 2.4%, 17.2%, 15.6%, and 8.1%, respectively (Table 4). ROC analysis suggested that the AUCs of types 1, 2, and 3 CKD were 0.8531 (95% CI: 0.8005–0.9057) (Figure 2D), 0.8798 (95% CI: 0.8189–0.9408) (Figure 2E), and 0.7941 (95% CI: 0.7300–0.8583) (Figure 2F), respectively. Overall, CKD showed much higher AUC values than AIS and DM, irrespective of the CKD type (Figures 2A-F).
Analysis of serum UBE2E3-Ab levels of HDs versus those of patients with chronic kidney disease (CKD)
| Sample information and alpha analysis | |||||
|---|---|---|---|---|---|
| (A) Sample information | HD | Type-1 CKD | Type-2 CKD | Type-3 CKD | |
| Total sample number | 82 | 145 | 32 | 123 | |
| Male/Female | 44/38 | 106/39 | 21/11 | 70/53 | |
| Age (average ± SD) | 44.1 ± 11.2 | 66.0 ± 10.4 | 76.0 ± 9.8 | 62.0 ± 11.7 | |
| (B) Alpha analysis (antibody level) | UBE2E3-Ab | ||||
| HD | Average | 1,625 | |||
| SD | 1,403 | ||||
| Cutoff value | 4,432 | ||||
| Positive No. | 2 | ||||
| Positive rate (%) | 2.4% | ||||
| Type 1-CKD | Average | 3,404 | |||
| SD | 2,348 | ||||
| Positive No. | 25 | ||||
| Positive rate (%) | 17.2% | ||||
| P (vs. HD) | 1.3E-11 | ||||
| Type 2-CKD | Average | 3,177 | |||
| SD | 1,409 | ||||
| Positive No. | 5 | ||||
| Positive rate (%) | 15.6% | ||||
| P (vs. HD) | 2.1E-06 | ||||
| Type 3-CKD | Average | 2,602 | |||
| SD | 1,381 | ||||
| Positive No. | 10 | ||||
| Positive rate (%) | 8.1% | ||||
| P (vs. HD) | 2.1E-06 | ||||
Type-1, -2, and -3 CKDs correspond to diabetic kidney disease, nephrosclerosis, and glomerulonephritis, respectively. The upper panel (A) indicates the numbers of all samples and samples from males and females, as well as age (average ± SD). The lower panel (B) summarizes the serum antibody levels examined by AlphaLISA using purified UBE2E3-GST protein as an antigen, as described in the legend of Table 1. P values were calculated using the Kruskal–Wallis test (Mann–Whitney U test with Bonferroni correction applied). P values < 0.05 and positive rates > 10% are marked in bold text. A scatter dot plot of the same results is shown in Figure 2D
An increasing number of reports have indicated that atherosclerosis is closely associated with cancer [7–9], which is supported by shared biomarkers for both atherosclerosis and cancer. To investigate this further, we analyzed serum samples from patients with EC, GC, or CRC (cancer cohort) obtained from Toho University Hospital. UBE2E3-Ab levels were significantly higher in patients with EC and GC, but not with CRC, than in HDs (Figure 1E, Table 5). The AUCs for EC, GC, and CRC were 0.6669, 0.6825, and 0.6071, respectively (Figures 2G–I).
Comparison of UBE2E3-Ab levels in HDs and patients with cancer
| Sample information and alpha analysis | |||||
|---|---|---|---|---|---|
| (A) Sample information | HD | GC | CRC | EC | |
| Total sample number | 95 | 94 | 96 | 95 | |
| Male/Female | 51/44 | 73/21 | 66/30 | 57/38 | |
| Age (average ± SD) | 57.9 ± 6.0 | 66.6 ± 9.1 | 66.6 ± 9.7 | 67.2 ± 11.6 | |
| (B) Alpha analysis (antibody level) | UBE2E3-Ab | DAN-Ab | SOSTDC1-Ab | ||
| HD | Average | 9,193 | 218,241 | 18,075 | |
| SD | 6,267 | 75,817 | 13,567 | ||
| Cutoff value | 21,728 | 369,876 | 45,208 | ||
| Positive No. | 5 | 4 | 4 | ||
| Positive rate (%) | 5.3% | 4.2% | 4.2% | ||
| EC | Average | 12,574 | 291,060 | 26,084 | |
| SD | 6,739 | 118,712 | 18,331 | ||
| Positive No. | 10 | 24 | 13 | ||
| Positive rate (%) | 10.6% | 25.5% | 13.8% | ||
| P (vs. HD) | < 0.001 | < 0.001 | < 0.05 | ||
| GC | Average | 13,081 | 264,614 | 14,297 | |
| SD | 7,715 | 97,415 | 12,101 | ||
| Positive No. | 11 | 14 | 2 | ||
| Positive rate (%) | 11.5% | 14.6% | 2.1% | ||
| P (vs. HD) | < 0.001 | < 0.01 | ns | ||
| CRC | Average | 11,197 | 247,181 | 19,476 | |
| SD | 6,792 | 102,736 | 15,742 | ||
| Positive No. | 7 | 8 | 5 | ||
| Positive rate (%) | 7.4% | 8.4% | 5.3% | ||
| P (vs. HD) | ns | ns | ns | ||
Types of cancer diagnoses included esophageal cancer (EC), gastric cancer (GC), and colorectal cancer (CRC). Purified UBE2E3-GST protein, DAN-GST protein, and antigenic SOSTDC1 peptide were used as antigens. Cutoff values were determined as the average HD values plus two SDs. P values were calculated by comparing the results of HDs and patients using the Kruskal–Wallis test. P values < 0.05 and positive rates > 10% are marked in bold. A scatter dot plot of the same results is shown in Figure 1E–G. DAN-Ab: anti-differential screening-selected gene aberrant in neuroblastoma antibody
UBE2E3 suppresses the cellular senescence of bone marrow mesenchymal stem cells, leading to osteoporosis [23], possibly via bone morphogenetic proteins (BMPs) [24]. We previously identified serum antibodies against BMP antagonists as atherosclerosis markers, such as anti-DAN antibody (DAN-Ab) [21] and anti-SOSTDC1 antibody (SOSTDC1-Ab) [16]. DAN-Ab levels were elevated in patients with EC and GC, but not with CRC, compared to those in HDs (Figure 1F, Table 5). The AUC values of DAN-Abs for EC, GC, and CRC were 0.6907, 0.6422, and 0.6071, respectively (Figures 2J–L). In contrast, only patients with EC had higher SOSTDC1-Ab levels than those in HDs (Figure 1G, Table 5). The AUC values of SOSTDC1-Abs for EC, GC, and CRC were 0.634, 0.582, and 0.527, respectively (Figures 2M–O).
Next, we tested whether UBE2E3-Ab levels were associated with the postoperative survival of patients with EC, GC, and CRC. We divided the UBE2E3-Ab levels into positive and negative groups using the cutoff values obtained from the X-tile software [22] to determine the optimal cutoff values for the discrimination of survival rates. Although there were no significant differences in overall survival between the UBE2E3-Ab-positive and -negative EC groups (P = 0.1271), the UBE2E3-Ab-positive group showed a tendency toward a better prognosis (Figure 3A).
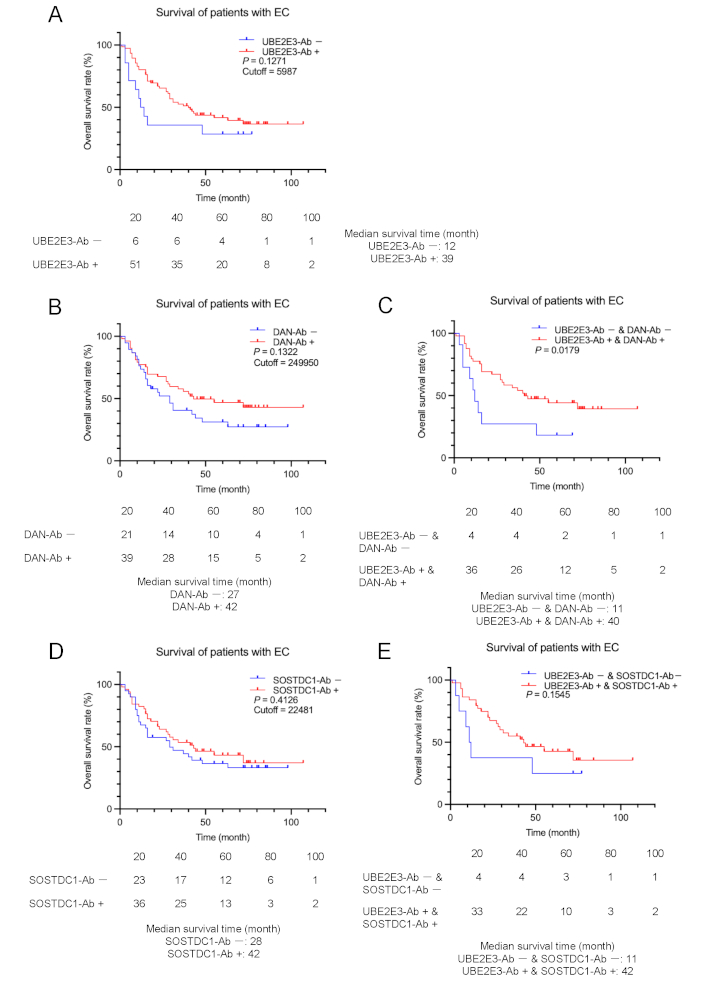
Comparison of EC prognosis between the antibody-positive and negative groups. Overall survival of the patients with EC was compared according to UBE2E3-Ab-positive (UBE2E3-Ab+) and negative (UBE2E3-Ab–) groups (A). Cutoff values were determined using X-tile software. Statistical analyses were performed using the log-rank test. P values and cutoff values are shown in the figures. Similar analyses were performed between anti-differential screening-selected gene aberrant in neuroblastoma antibody (DAN-Ab)-positive and negative groups or SOSTDC1-Ab-positive and negative groups alone (B and D, respectively) or in combination with UBE2E3-Abs (C and E, respectively). The numbers of patients at each follow-up period are shown below the figures. The median survival times are also shown
The patients with EC in the DAN-Ab-positive group also showed a more favorable prognosis than the DAN-Ab-negative group, although the difference was not statistically significant (P = 0.1322) (Figure 3B). The prognosis of the UBE2E3-Ab-positive/DAN-Ab-positive group was significantly more favorable than that of the UBE2E3-Ab-negative/DAN-Ab-negative group (P = 0.0179) (Figure 3C). Patients with EC in the SOSTDC1-Ab-positive group showed no difference in prognosis compared with the SOSTDC1-Ab-negative group (P = 0.4126) (Figure 3D). The prognosis of the UBE2E3-Ab-positive/SOSTDC1-Ab-positive group was more favorable than that of the UBE2E3-Ab-negative/SOSTDC1-Ab-negative group, but the difference was not significant (P = 0.1545) (Figure 3E). Thus, significant discrimination was observed only for the combination of UBE2E3-Abs and DAN-Abs.
In contrast, the UBE2E3-Ab-positive group had a significantly poorer prognosis than the UBE2E3-Ab-negative group in patients with GC (P = 0.0193) (Figure 4A). The DAN-Ab-positive group showed a more unfavorable prognosis than the DAN-Ab-negative group, but the difference was not significant (P = 0.0640) (Figure 4B). The difference in prognosis between the UBE2E3-Ab-positive/DAN-Ab-positive and UBE2E3-Ab-negative/DAN-Ab-negative groups was greater than that of each alone (P = 0.0098) (Figure 4C). Likewise, the SOSTDC1-Ab-positive group showed a somewhat poorer prognosis than the SOSTDC1-Ab-negative group (P = 0.1148) (Figure 4D), and the combined UBE2E3-Ab-positive/SOSTDC1-Ab-positive group exhibited a somewhat more unfavorable prognosis than the combined UBE2E3-Ab-negative/SOSTDC1-Ab-negative group (P = 0.0063) (Figure 4E). Thus, a more precise prediction of GC prognosis was achieved using a combination of UBE2E3-Abs and DAN-Abs or SOSTDC1-Abs.
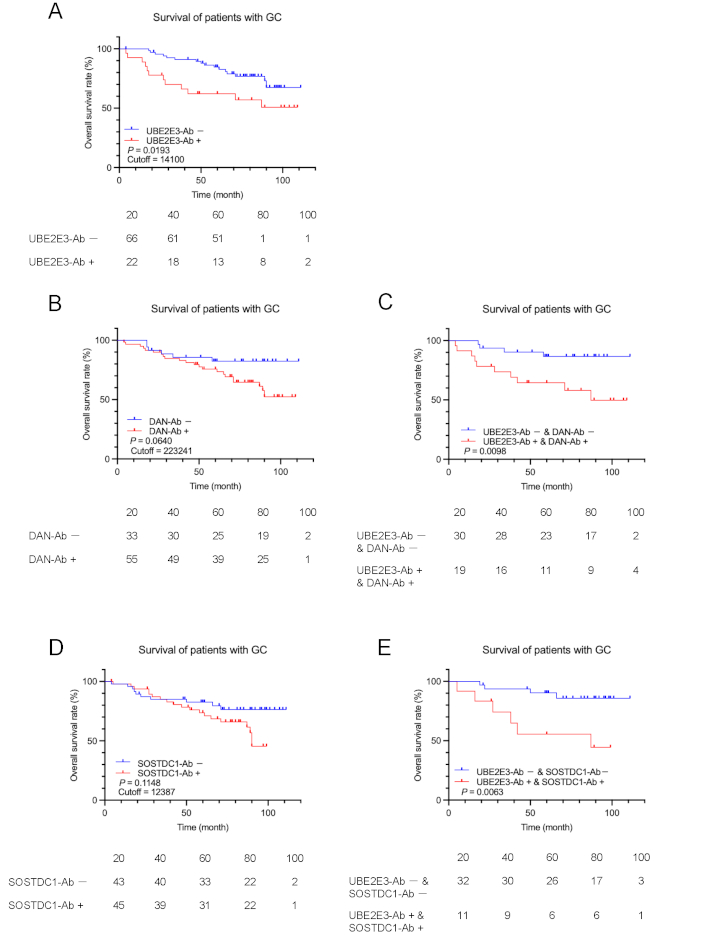
Comparison of GC prognosis between the antibody-positive and negative groups. Overall survival of the patients with GC was compared according to UBE2E3-Ab-positive (UBE2E3-Ab+) and negative (UBE2E3-Ab−) groups (A). Cutoff values were determined by X-tile software. Statistical analyses were performed using the log-rank test. P values and cutoff values are shown in the figures. Similar analyses were performed between anti-differential screening-selected gene aberrant in neuroblastoma antibody (DAN-Ab)-positive and negative groups or SOSTDC1-Ab-positive and negative groups alone (B and D, respectively) or in combination with UBE2E3-Abs (C and E, respectively). The numbers of patients at each follow-up period are shown below the figures
The prognostic analysis of CRC showed results similar to those of GC but not of EC. The UBE2E3-Ab-positive group had a significantly worse prognosis than the UBE2E3-Ab-negative group in patients with CRC (P = 0.0212) (Figure 5A). The DAN-Ab-positive group tended to have a worse prognosis than the DAN-Ab-negative group (P = 0.1478) (Figure 5B). The prognosis of the combined UBE2E3-Ab-positive/DAN-Ab-positive group was worse than that of the combined UBE2E3-Ab-negative/DAN-Ab-negative group (P = 0.0362) (Figure 5C). The SOSTDC1-Ab-positive group had a significantly poorer prognosis than the SOSTDC1-Ab-negative group (P = 0.0290) (Figure 5D), and the combined UBE2E3-Ab-positive/SOSTDC1-Ab-positive group exhibited an even more unfavorable prognosis than the combined UBE2E3-Ab-negative/SOSTDC1-Ab-negative group (P = 0.0033) (Figure 5E). Thus, a more precise prediction of CRC prognosis was achieved using a combination of UBE2E3-Abs and DAN-Abs or SOSTDC1-Abs.
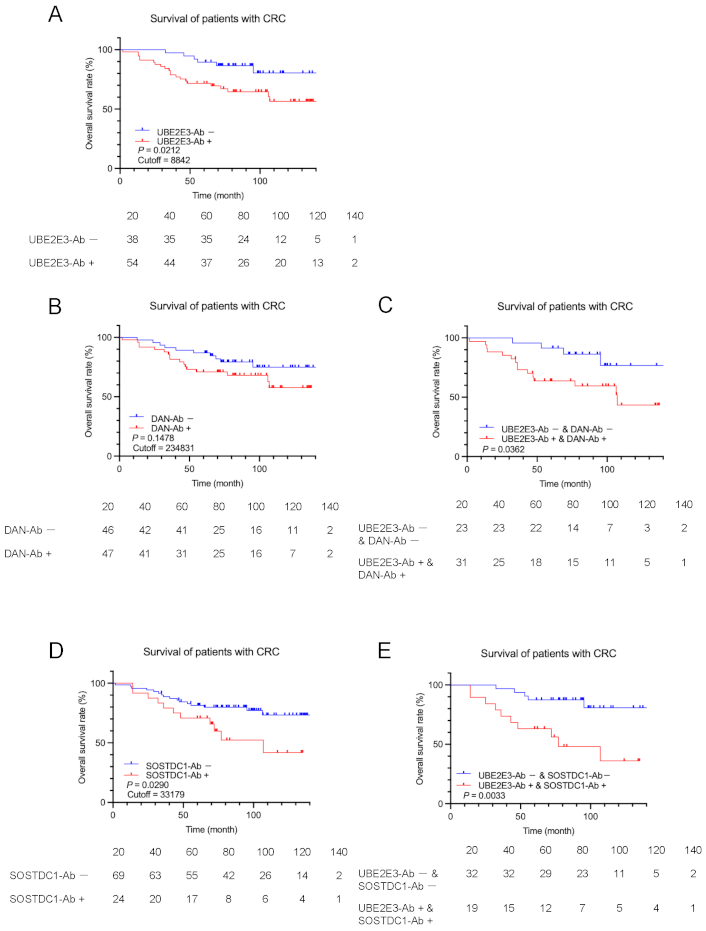
Comparison of CRC prognosis between the high antibody and low antibody groups. Overall survival of the patients with CRC was compared between UBE2E3-Ab-positive (UBE2E3-Ab+) and negative (UBE2E3-Ab−) groups (A). Cutoff values, statistical analyses, and P values are as described in the legends of Figure 3. Similar analyses were performed between anti-differential screening-selected gene aberrant in neuroblastoma antibody (DAN-Ab)-positive and negative groups or SOSTDC1-Ab-positive and negative groups alone (B and D, respectively) or in combination with UBE2E3-Abs (C and E, respectively). The numbers of patients at each follow-up period are shown below the figures
Spearman’s correlation analysis of the CKD cohort of 300 participants revealed significant associations between the plaque score, maximum intima-media thickness (max-IMT) [25, 26], and cardio-ankle vascular index (CAVI) (right and left) [27] (Table 6), which are key indicators of atherosclerosis. Aspartate aminotransferase (AST) levels were weakly associated, and standardized urea clearance (Kt/V), urea nitrogen levels, and high-density lipoprotein cholesterol (HDL-c) levels were inversely correlated with UBE2E3-Ab levels. Other patient data, including age, height, weight, and body mass index (BMI), showed no significant correlation with UBE2E3-Ab levels.
Correlation analysis of serum UBE2E3-Ab levels with the clinical data of CKD cohort
| Patient data | s-UBE2E-Ab | |
|---|---|---|
| rho | P value | |
| Age* | 0.0726 | 0.2100 |
| Height | 0.0935 | 0.1065 |
| Weight | 0.0211 | 0.7165 |
| Body mass index (BMI) | –0.0257 | 0.6584 |
| Dialysis period | –0.0981 | 0.0897 |
| Plaque score | 0.1478 | 0.0109** |
| Maximum intima-media thickness (max-IMT) | 0.1187 | 0.0412 |
| Ankle brachial pressure index (ABI) (right) | 0.0253 | 0.6664 |
| ABI (left) | –0.0003 | 0.9952 |
| Cardio-ankle vascular index (CAVI) (right) | 0.1915 | 0.0013 |
| CAVI (left) | 0.1716 | 0.0038 |
| Glycated hemoglobin (HbA1c) | –0.0865 | 0.2959 |
| Whole parathyroid hormone (W-PTH) | 0.0954 | 0.0993 |
| Transferrin saturation ratio | 0.0030 | 0.9584 |
| Standardized urea clearance (Kt/V) | –0.1515 | 0.0086 |
| Red blood cell | –0.0712 | 0.2187 |
| Hemoglobin | –0.0354 | 0.5410 |
| Hematocrit | –0.0205 | 0.7238 |
| Platelet | –0.0681 | 0.2394 |
| Total protein | –0.0318 | 0.5832 |
| Albumin | –0.0537 | 0.3544 |
| Urea nitrogen (UN) | –0.1427 | 0.0134 |
| Creatinin | –0.0498 | 0.3902 |
| Uric acid | –0.0859 | 0.1376 |
| Na | 0.0389 | 0.5018 |
| K | –0.1030 | 0.0749 |
| Cl | 0.0255 | 0.6599 |
| Ca | –0.0110 | 0.8491 |
| Inorganic phosphate (IP) | –0.0280 | 0.6287 |
| Ca | 0.0186 | 0.7478 |
| Mg | 0.0899 | 0.1202 |
| Fe | –0.0595 | 0.3046 |
| Ferritin | 0.1319 | 0.0223 |
| Aspartate aminotransferase (AST) | 0.1212 | 0.0359 |
| Alanine amino transferase (ALT) | 0.0658 | 0.2560 |
| Lactate dehydrogenase (LDH) | 0.0701 | 0.2258 |
| γ-glutamyl transpeptidase (γ-GTP) | 0.0465 | 0.4223 |
| Alkaline phosphatase (ALP) | –0.0389 | 0.5026 |
| Total bilirubin (tBil) | 0.0229 | 0.6934 |
| Amylase | –0.0284 | 0.6246 |
| Creatin kinase (CK) | –0.0127 | 0.8273 |
| Total cholesterol | –0.0540 | 0.3516 |
| High-density lipoprotein cholesterol (HDL-c) | –0.1261 | 0.0290 |
| Low-density lipoprotein cholesterol (LDL-c) | –0.0399 | 0.4913 |
| Triglyceride (TG) | 0.1030 | 0.0747 |
| C-reactive protein (CRP) | 0.1129 | 0.0507 |
Correlation coefficients (rho) and P values obtained by Spearman’s correlation analysis between UBE2E3-Ab levels and the subjects’ data are shown. *Subjects’ data used were age, height, weight, body mass index (BMI), maximum intima-media thickness (max-IMT), plaque score, cardio-ankle vascular index (CAVI), ankle brachial pressure index (ABI), glycated hemoglobin (HbA1c), whole parathyroid hormone (W-PTH), dialysis period, angiotensin II receptor blocker (ARB), angiotensin converting enzyme (ACE), prothrombin (PTA), iron (Fe), ferritin, Transferrin saturation ratio (TSAT ratio), standardized urea clearance (Kt/V), red blood cell number (RBC), hemoglobin (HGB), hematocrit (HCT), platelet number (PLT), total protein (TP), albumin (ALB), urea nitrogen (UN), creatinine (CRE), uric acid (UA), sodium (Na), potassium (K), chlorine (Cl), calcium (Ca), inorganic phosphate (IP), magnesium (Mg), aspartate aminotransferase (AST), alanine amino transferase (ALT), lactate dehydrogenase (LDH), γ-glutamyl transpeptidase (γ-GTP), alkaline phosphatase (ALP), total bilirubin (tBil), amylase (AMY), creatinine kinase (CK), total cholesterol (T-CHO), high-density lipoprotein cholesterol (HDL-c), low-density lipoprotein cholesterol (LDL-c), triglyceride (TG), and C-reactive protein (CRP). **Significant correlations (P < 0.05) are marked in bold
We performed a correlation analysis of UBE2E3-Ab levels in the Sawara cohort. UBE2E3-Ab levels were significantly correlated with carotid artery stenosis, including IMT (right and left) and max-IMT (Table S1), confirming the results from the CKD cohort (Table 6). UBE2E3-Ab levels were strongly associated with blood pressure (P = 0.0015) and smoking duration (P = 0.0020), which are major risk factors for atherosclerosis [28, 29]. Furthermore, UBE2E3 levels were positively correlated with age, alkaline phosphatase levels, thymol turbidity test (TTT) results, and white blood cell numbers and negatively correlated with height, weight, and chlorine levels. The correlation between UBE2E3-Ab levels and the IMT in the Sawara cohort also suggested that UBE2E3-Ab levels were associated with arterial stenosis or atherosclerosis. A chi-square test was conducted to compare the sex differences between the UBE2E3-Ab-positive and -negative groups. No significant correlation was observed between sex and UBE2D3-Ab positivity (P = 0.9317) (Table S2). Univariate and multivariate analyses were performed using the AIS cohort. The UBE2E3-Ab level was not a significant independent predictor in the multivariate analysis (P = 0.34) (Table S3).
The correlation of UBE2E3-Ab levels was also examined in 275 patients with DM (DM cohort) at Chiba University Hospital. UBE2E3-Ab levels were correlated with the blood pressure and estimated glomerular filtration rate (eGFR) but were inversely correlated with calcium levels and platelet numbers (Table S4). Thus, the results of the correlation analyses in the CKD, DM, and Sawara cohorts support an association between UBE2E3-Abs levels and the level of atherosclerotic progression.
Initial ProtoArray screening identified UBE2E3 as an antigen recognized by serum IgG in patients with atherosclerosis. Serum antibody levels were examined by AlphaLISA using a purified recombinant GST-tagged UBE2E3 protein. The AlphaLISA results indicated significantly higher UBE2E3-Ab levels in patients with AIS, DM, CVD, CKD, EC, and GC than in HDs (Figures 1A–E, Tables 1–5). ROC analysis revealed that the highest AUC values were observed for CKD types 1–3 (Figures 2A–F). Furthermore, Spearman’s correlation analysis of the Sawara and CKD cohorts showed significant correlations between UBE2E3-Ab levels and the max-IMT, plaque score, and CAVI (Table 6), which are key indicators of atherosclerosis and arterial stenosis [30–32]. Therefore, UBE2E3-Ab levels may reflect the development of atherosclerosis.
In addition to the UBE2E3-Abs employed in this study, the levels of autoantibodies targeting ATP2B4, BMP-1, KIAA0513, DHPS, LRPAP1, and ASXL2, which are known markers of atherosclerosis, are also elevated in the sera of patients with EC [7, 10, 30–32], suggesting a relationship between atherosclerosis and cancer. Consistently, angiogenesis, the physiological process of the formation of new blood vessels, is crucial for the growth, progression, and metastasis of solid tumors [11], and both diabetes and arteriosclerosis are known risk factors for cancer [12, 33–36]. Therefore, common mechanisms may be involved in the development of atherosclerotic diseases and cancers.
UBE2E3 is a member of the ubiquitin-conjugating enzyme (UBE2) family. Although its biological function remains unclear, another member of the family, UBE2C, is overexpressed in advanced-stage hepatocellular carcinoma tissues [37], head and neck squamous cell carcinoma [38], and uterine corpus endometrial carcinoma [39]. This unfavorable prognosis-associated UBE2C expression is consistent with the results of our survival analyses of UBE2E3-Abs for GC and CRC but not for EC (Figure 3A).
It has been reported that UBE2E3 suppresses cellular senescence in bone marrow mesenchymal stem cells, leading to osteoporosis [23], possibly via BMP signaling [40]. UBE2E3 suppresses cellular senescence in bone marrow mesenchymal stem cells, leading to osteoporosis [23], possibly via BMP signaling [40]. In previous studies, BMP-related proteins have demonstrated causal effects on the development of atherosclerosis [41, 42]. These include BMP-2 [43], BMP-4 [44], the BMP type II receptor BMPRII [45], and the BMP antagonist MGP [46]. Our large-scale screening for atherosclerosis antibody markers also identified BMP-1 [47], BMP antagonists such as SOSTDC1 [16] and DAN [21], and a BMP target gene product DIDO1 [13, 48], as antigens recognized by autoantibodies in patients with atherosclerosis. The possible absorption of BMP antagonists by their respective autoantibodies may play a key role in the development of atherosclerosis by increasing active BMP levels.
BMP signaling is also involved in the development of cancer. BMPs play tumor-promoting or tumor-suppressive roles depending on the cancer cell types [49–52]. Thus, we compared the overall survival between the groups that were positive and negative for UBE2F3-Abs, DAN-Abs, and SOSTDC1-Abs, alone or in combination. Among patients with EC, the UBE2E3-Ab-positive group tended to have a more favorable prognosis than the UBE2E3-Ab-negative group, and this prognostic difference became significant in combination with DAN-Abs (Figures 3A and C). In contrast, UBE2E3-Ab positivity was associated with an unfavorable prognosis in GC and CRC, which became significant in combination with positive DAN-Abs or SOSTDC1-Abs. Thus, the tumor-suppressive or -promoting role of BMP signaling may account for the differential prognosis of UBE2E3-Abs between EC and GC or CRC.
Autoantibodies may develop after tissue destruction, followed by leakage of the antigenic proteins that are overexpressed in the lesional tissues, as suggested previously [9, 13]. The repeated leakage of small amounts of antigens results in a marked increase in antibodies to detectable levels. Therefore, antibody markers offer greater sensitivity than antigen markers, and IgG antibodies remain very stable in serum samples. Consequently, serum UBE2E3-Abs are useful for the early diagnosis of AIS, DM, CVD, CKD, and gastrointestinal cancer.
AIS: acute ischemic stroke
AlphaLISA: amplified luminescence proximity homogeneous assay-linked immunosorbent assay
AMI: acute myocardial infarction
AUC: area under the receiver operating characteristic curve
BMP: bone morphogenetic protein
CAVI: cardio-ankle vascular index
CI: confidence interval
CKD: chronic kidney disease
CRC: colorectal cancer
CVD: cardiovascular disease
DAN: differential screening-selected gene aberrant in neuroblastoma
DAN-Ab: anti-differential screening-selected gene aberrant in neuroblastoma antibody
DM: diabetes mellitus
EC: esophageal cancer
GC: gastric cancer
GST: glutathione S-transferase
HDs: healthy donors
max-IMT: maximum intima-media thickness
ROC: receiver operating characteristic
SD: standard deviation
SEREX: serological identification of antigens by cDNA expression cloning
SOSTDC1: sclerostin domain-containing protein 1
SOSTDC1-Ab: anti-sclerostin domain-containing protein 1 antibody
UBE2E3: ubiquitin conjugating enzyme E2 E3
UBE2E3-Ab: anti-ubiquitin conjugating enzyme E2 E3 antibody
The supplementary materials for this article are available at: https://www.explorationpub.com/uploads/Article/file/101258_sup_1.pdf.
The authors would like to thank Prof. Masaki Takiguchi (Chiba University), Prof. Kenichiro Kitamura (Yamanishi University), Prof. Hao Wang (Jinan University), Dr. Xiao-Meng Zhang (Chiba University), Dr. Mari Oba (National Center of Neurology and Psychiatry, Tokyo), Dr. Risa Kimura (Chiba University), for supporting this research as well as Ms. Seiko Otsuka, Masae Suzuki, Chiho Kusaka, Satoko Ishibashi, and Akiko Kimura for technical assistance.
TH: Conceptualization, Investigation, Writing—original draft. YY: Writing—review & editing, Validation. MK: Investigation, Writing—original draft. BSZ: Investigation, Writing—original draft. SYL: Investigation, Writing—original draft. T Matsutani: Resource, Validation, Writing—review & editing. SH: Resource, Validation. MT: Conceptualization, Resource, Validation. KI: Investigation, Validation. SM: Resource, Validation. T Machida: Conceptualization, Validation, Writing—review & editing. YK: Conceptualization, Resource, Validation. HT: Resource, Validation. MI: Resource, Validation. SY: Resource, Validation. HS: Conceptualization, Writing—review & editing, Supervision. KY: Writing—review & editing, Supervision. YH: Writing—review & editing, Supervision. All authors read and approved the submitted version.
The authors declare that they have no conflicts of interest.
This study was approved by the Local Ethical Review Board of Chiba University, Graduate School of Medicine [approved numbers: 2012-438, 2014-44, 2016-86, 2017-251, 2018-320, 2020-1129, 2022-623, 2023-836], Toho University, Faculty of Medicine [approved numbers: A18103_A17052_A16035_A16001_26095_25024_ 24038_22047, 25131_23005], Toho University Omori Medical Center [approved number: 26-255], and Port Square Kashiwado Clinic [approved number: 2012‑001] as well as by the review boards of the participating hospitals. All experimental procedures were performed in accordance with the Declaration of Helsinki, version 2013.
Written informed consent was obtained from all participants by following the protocols approved by their institutional ethical committees.
Not applicable.
All of the results of ProtoArray are available in the public Figshare database (https://figshare.com/articles/dataset/Results_of_protein_array_for_atherosclerosis/25906330). The other raw data supporting the conclusions of this manuscript will be made available by the authors, without undue reservation, to any qualified researcher.
This work was supported, in part, by research grants from the Japan Science and Technology Agency [JST: Exploratory Research No. 14657335], Japan Science and Technology Agency SPRING [grant nos. JPMJSP2109], and research grants from Japan Society for the Promotion of Science KAKENHI [Grant Number: 20K17953, 22K07273, 20K07810, 21K19437, 21K08695, 16K10520]. The funders had no role in study design, data collection and analysis, decision to publish, or preparation of the manuscript.
© The Author(s) 2025.
Open Exploration maintains a neutral stance on jurisdictional claims in published institutional affiliations and maps. All opinions expressed in this article are the personal views of the author(s) and do not represent the stance of the editorial team or the publisher.
Copyright: © The Author(s) 2025. This is an Open Access article licensed under a Creative Commons Attribution 4.0 International License (https://creativecommons.org/licenses/by/4.0/), which permits unrestricted use, sharing, adaptation, distribution and reproduction in any medium or format, for any purpose, even commercially, as long as you give appropriate credit to the original author(s) and the source, provide a link to the Creative Commons license, and indicate if changes were made.

View: 2662
Download: 208
Times Cited: 0
