Perspective

Affiliation:
1Department of Medicine, School of Medicine, Nazarbayev University, Astana 010000, Kazakhstan
Email: alessandro.salustri@nu.edu.kz
ORCID: https://orcid.org/0000-0002-4596-0887
Affiliation:
2Department of Cardiovascular Disease, Università degli Studi G. D’Annunzio, 66013 Chieti-Pescara, Italy
ORCID: https://orcid.org/0000-0001-5210-3499
Affiliation:
1Department of Medicine, School of Medicine, Nazarbayev University, Astana 010000, Kazakhstan
ORCID: https://orcid.org/0009-0005-2554-1676
Affiliation:
1Department of Medicine, School of Medicine, Nazarbayev University, Astana 010000, Kazakhstan
ORCID: https://orcid.org/0000-0003-2071-6949
Affiliation:
1Department of Medicine, School of Medicine, Nazarbayev University, Astana 010000, Kazakhstan
ORCID: https://orcid.org/0000-0002-0856-0139
Affiliation:
1Department of Medicine, School of Medicine, Nazarbayev University, Astana 010000, Kazakhstan
ORCID: https://orcid.org/0000-0002-2409-5644
Affiliation:
1Department of Medicine, School of Medicine, Nazarbayev University, Astana 010000, Kazakhstan
ORCID: https://orcid.org/0000-0001-7958-7956
Explor Cardiol. 2025;3:101257 DOI: https://doi.org/10.37349/ec.2025.101257
Received: March 11, 2025 Accepted: April 18, 2025 Published: May 27, 2025
Academic Editor: Varga Albert, University of Szeged, Hungary
Analysis of intraventricular pressure gradients has gained interest due to the recent development of a new method of image analysis based on cardiac magnetic resonance feature tracking or echocardiographic speckle tracking. Currently, images acquired from routinely performed cardiac magnetic resonance or echocardiography can be analyzed, and the left ventricular hemodynamic forces (HDF) curves generated and displayed for measurements. This modality has been applied in clinical scenarios and normal reference values are available. However, different parameters have been derived in the available studies on HDF, and there is no standardization on which parameters should be reported. In this short review, we describe how to assess HDF and discuss the different parameters that can be derived from the HDF curves.
Hemodynamic forces (HDF) analysis has been proposed as a promising approach for the study of blood flow within the ventricular chambers through the evaluation of intraventricular pressure gradients (IVPG) [1]. In fact, the blood flow is driven by IVPG, which in turn are determined by the functional interplay of the myocardium, valves, and large vessels. Previous attempts to explore HDF (which represents the forces exchanged between blood and surrounding tissues and corresponds to the global value of IVPG integrated over the ventricular volume) were based on echocardiographic particle image velocimetry and 4-D flow magnetic resonance imaging, which gained limited popularity for various reasons: the former needs contrast agent infusion and present limited accuracy, the latter is the reference standard but presents high cost, low availability, and the procedure is complex and time-consuming. Recently, a new approach using a mathematical model based on the first principle of fluid dynamics and mass conservation principles has been proposed [2]. This model is based on the detection and tracking of endocardial tissue velocities (using the same speckle tracking technique used for strain and strain rate analysis), and on the blood velocity across the valves (which is calculated from the volumetric changes of the left ventricle and the valve area, using the conservation of mass principle). By integrating knowledge of left ventricular (LV) geometry, endocardial tissue movement, and the dimensions of the aortic and mitral orifices, the need for direct measurements of blood velocities within the left ventricle is eliminated (Figure 1). Therefore, the force associated with a fluid volume can be evaluated from measurements performed at the boundaries of the volume regardless of flow phenomena developing in the cavity.
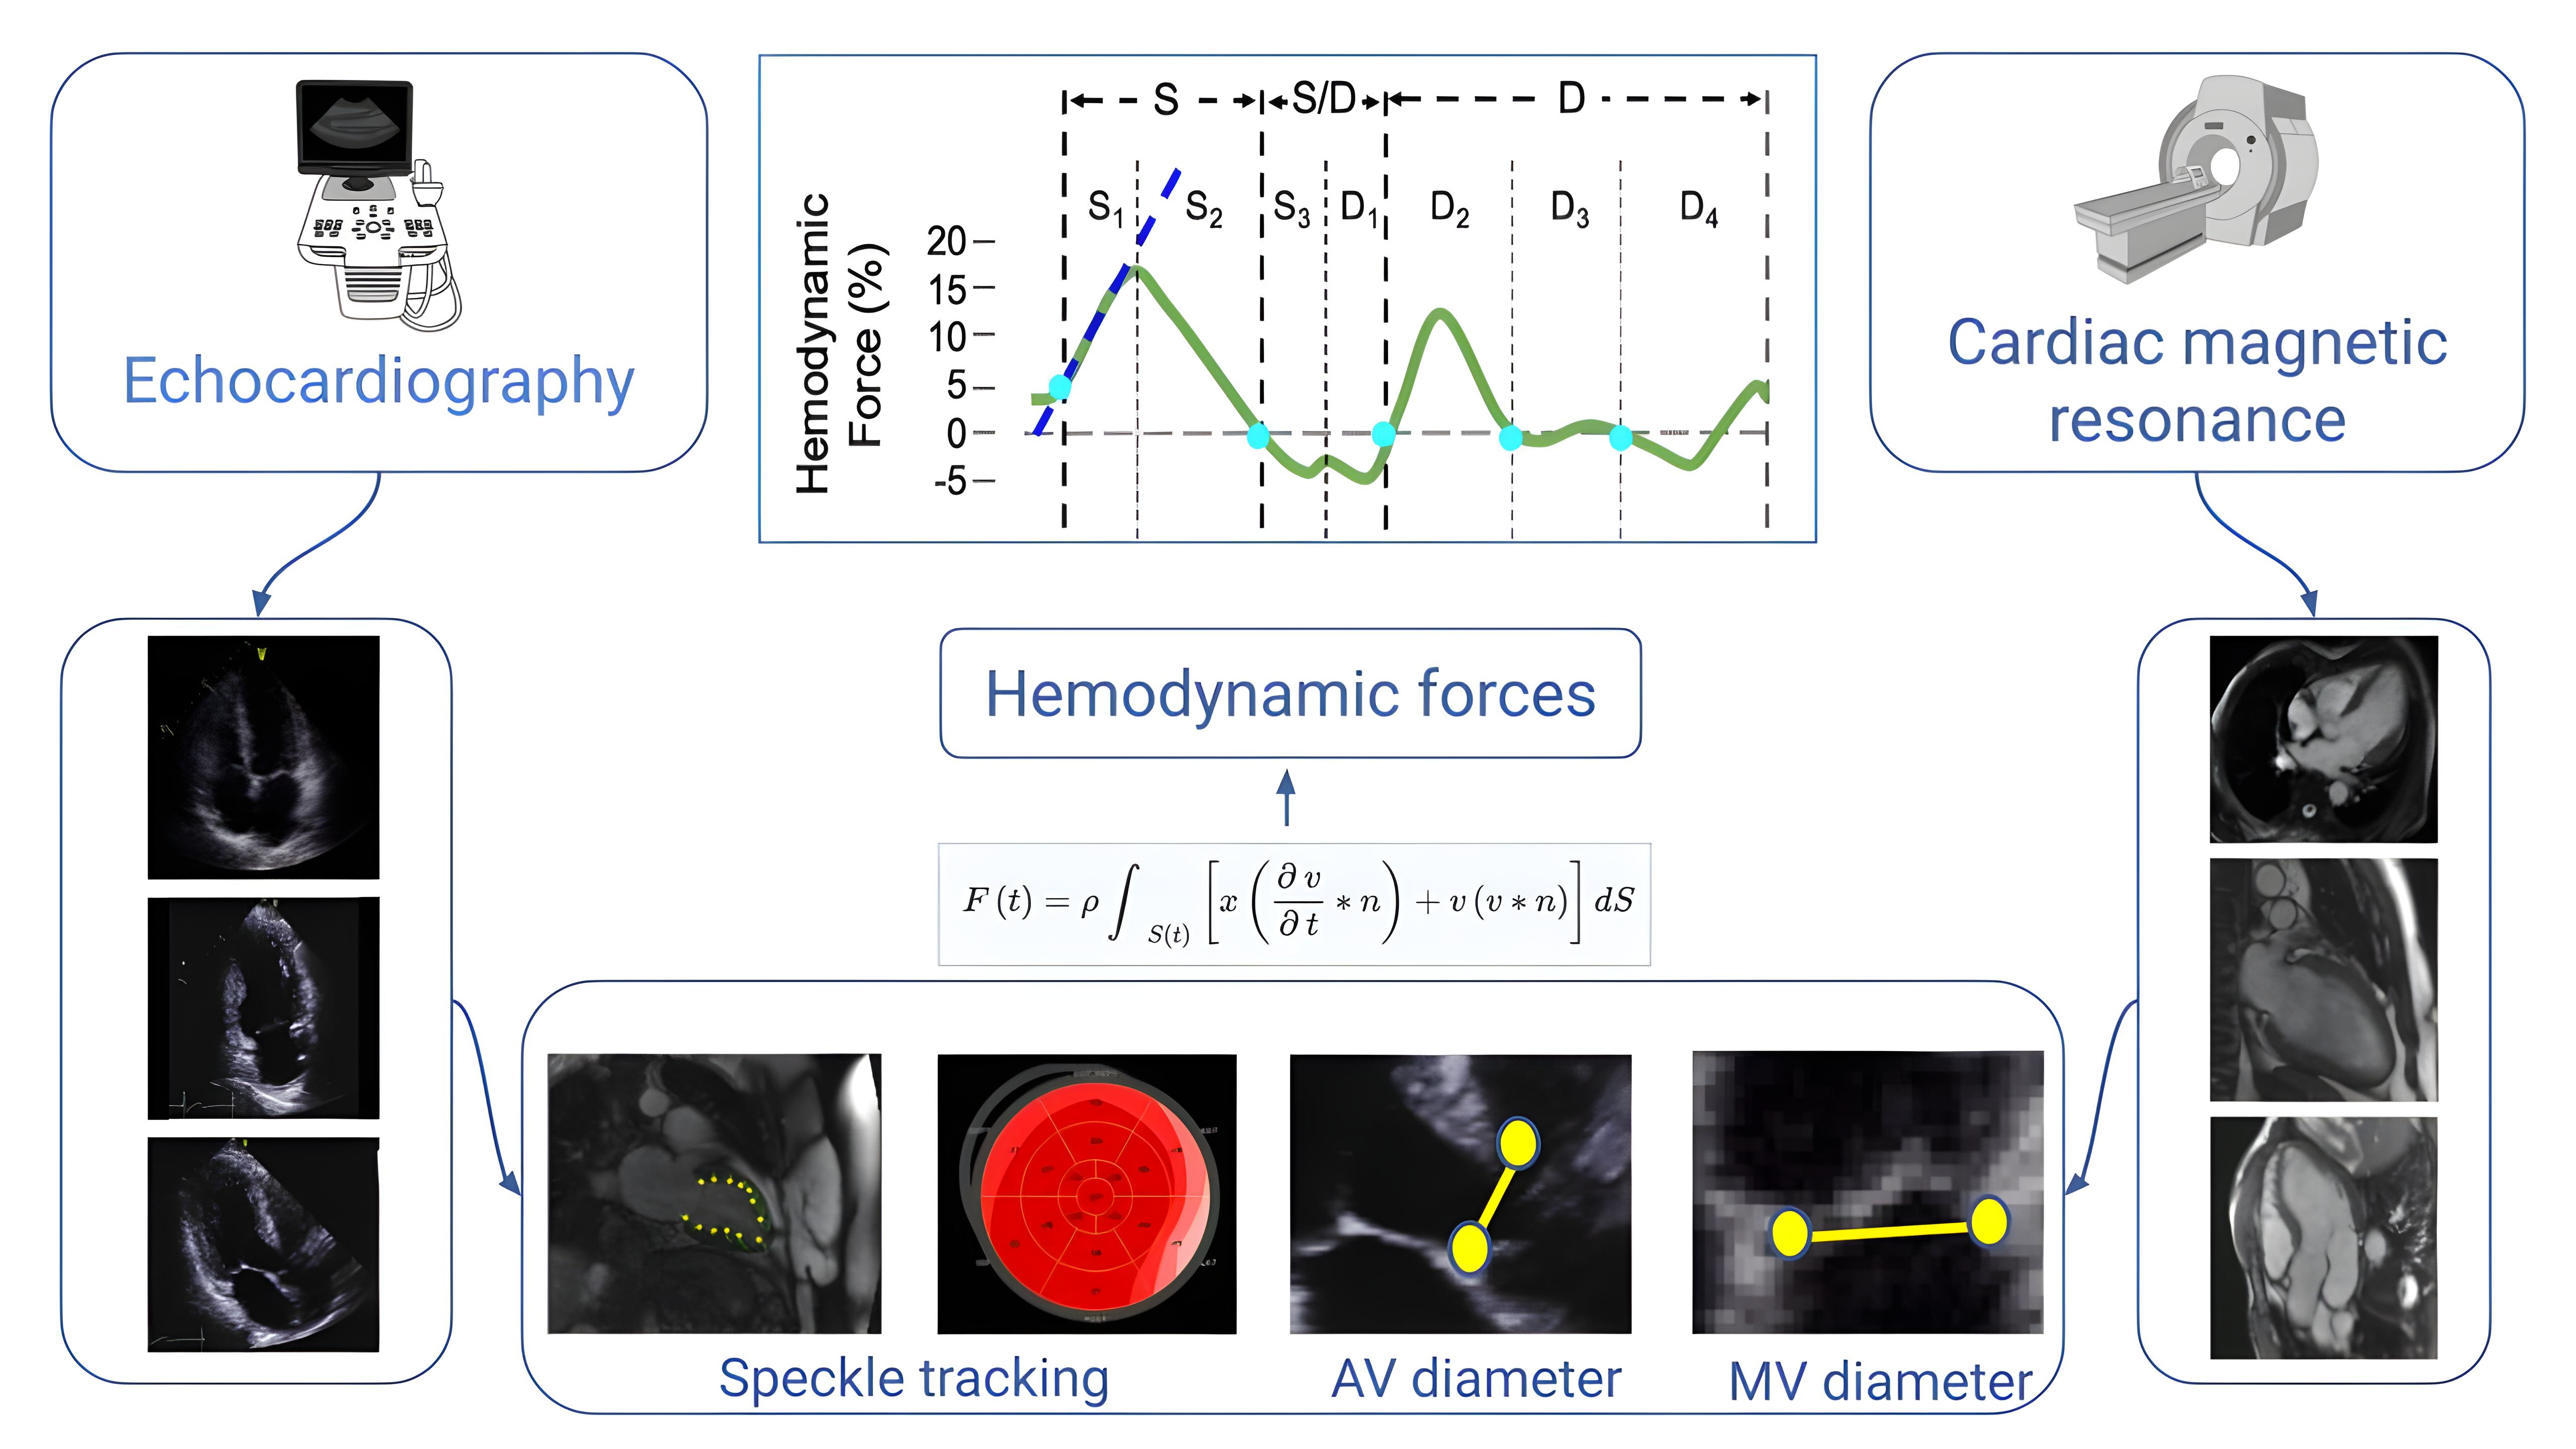
Flow chart of the steps required for HDF analysis. Images are acquired using routine 2-D echocardiography or non-contrast CMR. Three apical views are selected and the endocardial border is detected. Tracking of the endocardial motion provides strain assessment. Aortic and mitral valve areas are calculated from the relative valve diameters. Finally, a mathematical model based on the first principle of fluid dynamics and mass conservation principles allows for HDF curve assessment and display. AV: aortic valve; CMR: cardiac magnetic resonance; HDF: hemodynamic forces; MV: mitral valve. Adapted with permission from the Figure previously published by the author of this article [11], © 2024 the authors (CC BY NC ND)
In this article, we describe the pattern of a normal HDF curve, the morphology of the discrete parts of the cardiac cycle, and the parameters that can be derived. In addition, studies on HDF are reported in terms of parameters that have been used and clinical findings.
HDF analysis can be performed from cine cardiac magnetic resonance (CMR) or 2-D echocardiography. The CMR scanning protocol includes standard cardiac sequences (long axis 2-, 3-, and 4-chamber views) recommended by international associations. Echocardiography is similarly focused on the acquisition of good quality apical views (2-, 3-, and 4-chamber). A parasternal long-axis view is recommended for accurate measurement of the aortic valve (AV) diameter. The acquired images are stored in an archive for offline analysis using dedicated software.
End-diastolic and end-systolic frames in the acquired images are selected. Then, the LV endocardial border is automatically detected by the software and the operator has the freedom to manually adjust the endocardial border if needed. The endocardial border is tracked over the cardiac cycle to derive a calculation of the standard volumetric parameters. The calculation of HDF requires measurements of the aortic and mitral valve area, which can be derived from the measurements of the respective valve diameters. Figure 2 represents a schematic drawing of the time course of the parameters derived from image analysis.
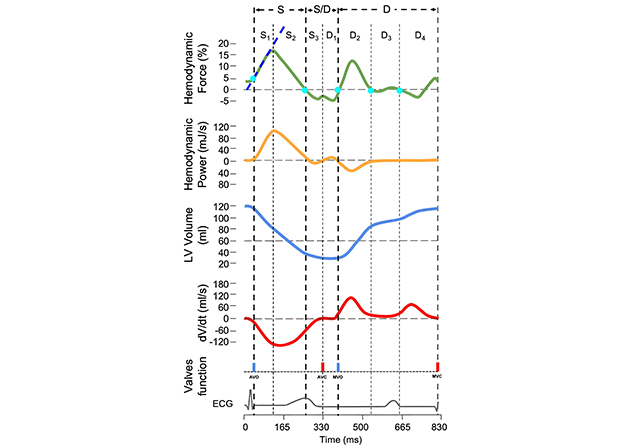
Longitudinal HDF (green) and hemodynamic power (orange) curves in relation to LV volume (blue), instantaneous LV volume changes over time (dV/dt) (red), mitral and aortic valve opening and closure, and ECG. By convention, an IVPG directed from the apex to the base (apical pressure higher than basal pressure) is represented by a positive HDF value (above the zero line); when the IVPG is directed from the base to the apex it is displayed as negative (below the zero line). The different phases of the cardiac cycle considered for measurements of HDF parameters are labeled with letters (S = systolic ejection; S/D = systo-diastolic transition; D = diastole) and numbers. S1: initial impulse; S2: force decline; S3: elastic rebound; D1: suction; D2: early filling of the left ventricle; D3: diastasis; D4: late filling of the left ventricle. In this diagram, the time interval of each phase is set up from the HDF curve (light blue dots); the area under the curve on the corresponding time interval of the HDF curve represents the impulse (change of momentum, Δp) of the selected cardiac phases. AVC: aortic valve closure; AVO: aortic valve opening; ECG: electrical activity; HDF: hemodynamic forces; IVPG: intraventricular pressure gradients; LV: left ventricular; MVC: mitral valve closure; MVO: mitral valve opening. Adapted with permission from the Figure previously published by the author of this article [11], © 2024 the authors (CC BY NC ND)
The HDF curve represents the integral over the LV blood volume of the force per unit volume (pressure gradient), and the result is a force measurable in Newton (N). Positive values indicate gradients with an apex-to-base vector, while negative values indicate gradients with a base-to-apex vector. For easy comparison between subjects with different LV sizes, values are normalized with the LV volume and expressed as a percentage of gravity acceleration. Thus, units are dimensionless (%). It is important to understand the difference between the direction of the HDF (pressure gradients within the ventricle) and the direction of blood flow (pressure gradients between cardiac chambers). In fact, the vectors of the two gradients are dissociated (opposite directions) during selected parts of the cardiac cycle (see below, HDF during discrete parts of the systole).
Similarly, the hemodynamic power (HDP) curve represents the integral of the mechanical power per unit volume (that is the product of pressure gradient and blood velocity) and the result is the mechanical power measured in Watt (J/s) [3]. Although interesting from a theoretical point of view, the HDP suffers from practical drawbacks (complexity of the formula, noise, and extreme sensitivity to the measurement of valve dimensions) and does not provide robust data, therefore its use is still under investigation. The LV volume curve represents the changes in the LV volume over time. Units are mL. Finally, the dV/dt curve represents the rate at which the LV volume changes over time. Units are mL/s.
Phantom validation of HDF showed good accuracy [4], and force reproducibility in humans has been proven to be strong [5, 6]. Normal values of HDF have been reported [7–9] and the method has been applied to several clinical models including athletes [10, 11], hypertensive patients [11], heart failure [12–15], dilated and non-ischemic cardiomyopathies [16–18], post-CRT (cardiac resynchronization therapy) [19–22], post-myocardial infarction [23], post-aortic coarctation repair [24], post-transcatheter AV implantation [25], evaluation of diastolic dysfunction [26], and to evaluate the effect of medical therapy [27, 28], however, several parameters have been proposed including HDF values throughout the cardiac cycle which provides information on the overall myocardial function. Selected HDF parameters have also been proposed with the aim of understanding the IVPG behavior during a specific time interval of the cardiac cycle [29, 30], however, there is a lack of consistency in the definition of the cardiac phases and how to set the time interval for HDF measurements. Table 1 summarizes the HDF parameters that have been reported in previous studies.
Summary of the published studies on HDF
| Study population | Method | Parameters | Period of the cardiac cycle analyzed | Findings (as reported in the abstract of the article) | Reference |
|---|---|---|---|---|---|
| Healthy subjects, DCM | CMR | Sax-max/Lax-max force ratio | Entire diastole; early filling phase; late filling phase | The LV hemodynamic filling forces showed a similar temporal progression among healthy subjects, whereas DCM patients had forces that were more heterogeneous in their direction and magnitude during diastole | [16] |
| Healthy volunteers/athletes | CMR | Peak values; average amplitude (RMS); early diastolic filling impulse | First third of systole; middle third of early filling; final third of atrial contraction; systole; diastole; E-wave; A-wave | Force patterns were similar between healthy subjects and athletes, indicating potential utility as a cardiac function biomarker | [10] |
| Heart failure with LBBB | CMR | Sax-max force/Lax-max force; average amplitude (RMS) | Entire diastole; early filling phase; late filling phase | HDF may serve as an additional tool for considering the risks imposed by conduction abnormalities in heart failure patients and prove to be useful in predicting response to CRT | [13] |
| CRT | Echo | RMS longitudinal; RMS transversal; RMS transversal/RMS longitudinal | Entire cardiac cycle | Pacing-induced realignment of HDFs is associated with CRT efficacy at follow-up | [22] |
| Heart failure | CMR | Average amplitude (RMS); peak forces; in the transverse plane and the apical-to-basal direction | Entire cardiac cycle | LV hemodynamic forces noninvasively computed using the newly developed mathematic model may significantly improve the detection of early myocardial systolic dysfunction when volumetric and deformation cardiac measures are still intact | [12] |
| Healthy volunteers | Echo | Average amplitude (RMS); LV impulse (AUC) | Entire cardiac cycle; systolic phase; LV suction | This approach could differentiate normality from pathology by providing average HDF parameters, differentiated by age and gender | [7] |
| Healthy volunteers | Echo | Longitudinal; transverse; systolic impulse (AUC); systolic peak of the longitudinal forces; average amplitude (RMS); angle (orientation) | Entire cardiac cycle; systole; diastole | Knowledge of the physiologic range of LV HDF may prompt their implementation into the clinical routine and allow a more comprehensive assessment of the LV function | [9] |
| Diastolic dysfuntion | Echo | Mean amplitude of the longitudinal forces (RMS) | Diastole | A scoring system including HDFs might improve the accuracy of echocardiography in estimating LV filling pressures | [26] |
| HFpEF | CMR | Average amplitude (RMS); peak forces; in the transverse plane and the apical-to-basal direction | Entire cardiac cycle; systole; diastole; with/without volume normalization | LV hemodynamic force analysis, whether indexed to LV volumes or not, is not ready for clinical trials on HFpEF assessment | [15] |
| Post-MI | CMR | Average amplitude (RMS); longitudinal (A-B) HDFs; horizontal (L-S) HDFs; L-S/A-B HDFs ratio; angle (orientation) | Entire cardiac cycle; systole; diastole | Misalignment of diastolic hemodynamic forces after STEMI is associated with adverse LV remodeling after 4 months | [23] |
| HFrEF | Echo | Average amplitude (RMS); longitudinal (A-B) HDFs; horizontal (L-S) HDFs; L-S/A-B HDFs ratio; angle (orientation) | Entire cardiac cycle; systole; diastole | In patients with HFrEF, therapy with sacubitril/valsartan improves HDF distribution | [28] |
| HFpEF | CMR | Average amplitude (RMS); peak systolic HDF; systolic impulse (AUC); systolic–diastolic transition (LV deceleration and LV suction) | Entire cardiac cycle; early diastolic filling/diastolic deceleration; late diastolic filling/atrial thrust; early diastolic filling/late diastolic filling | Assessment of HDF indicates impairment of LV systolic ejection force in HFpEF which is associated with cardiovascular events | [14] |
| CRT | CMR | Average amplitude (RMS); A-B strength; L-S strength; I-A strength | Entire cardiac cycle; systole; diastole | HDF parameters can predict the response to CRT in heart failure patients, aiding in the selection of candidates who are more likely to benefit from the therapy | [21] |
| CRT | Echo | Average amplitude (RMS); A-B strength; L-S strength; L-S/A-B ratio; angle (orientation); systolic impulse (AUC) | Entire cardiac cycle; systolic thrust | HDF in CRT recipients reflect the acute effect of CRT and the effect of LV reverse remodeling on intraventricular pressure gradients. Whether HDF analysis provides incremental value over established Echo parameters, remains to be determined | [19] |
| Dilated cardiomyopathy | CMR | IVPG | Entire cardiac cycle; systolic ejection; isovolumic relaxation; E-wave deceleration; A-wave acceleration | In the absence of pressure reversal, lower systolic ejection force, E-wave decelerative force, and overall LV-IVPG are powerful predictors of outcome, independent of clinical and imaging parameters | [17] |
| After TAVI | Echo | Average amplitude (RMS); angle (orientation); systolic impulse (AUC); time from R wave to peak systole; time of transition; time from the start of relaxation to positive peak of diastolic | Entire cardiac cycle; systolic phase; transition; suction | Echo analysis of HDFs could help differentiate patients with LV function recovery after TAVI from patients with persistent hemodynamic dysfunction | [25] |
| CRT | Echo | Average amplitude (RMS); A-B strength; L-S strength; angle (orientation); systolic impulse (AUC) | Entire cardiac cycle; systolic thrust | Six months after CRT, the orientation of HDF improves in LV responders and LV non-responders, while the magnitude of A-B HDF only improves in LV responders | [19] |
| Healthy volunteers | CMR | Average amplitude (RMS); L-S/A-B HDF ratio; LV impulse (AUC) | Entire cardiac cycle; systole; diastole; systolic/diastolic transition; diastolic deceleration; atrial thrust | The study provided comprehensive normal values of HDF assessments with specific age and sex stratification | [8] |
| Post-aortic coarctation repair | Echo | Average amplitude (RMS); LV impulse (AUC) | Entire cardiac cycle; systolic phase; LV suction | Patients with coarctation of the aorta had lower LV myocardial strain and HDF parameters values, independently associated with hospitalization for heart failure | [24] |
| Athletes, hypertensive patients | CMR | Average amplitude (RMS); longitudinal (A-B) HDFs; horizontal (L-S) HDFs; L-S/A-B HDFs ratio; angle (orientation); hemodynamic work (AUC); peak; duration | Entire cardiac cycle; systolic phase; suction; early LV filling; atrial thrust | HDF allows distinction between the hemodynamic patterns of athletes and patients with hypertension | [11] |
| Non-ischemic LV cardiomyopathy | CMR | Unsupervised clustering of longitudinal and transversal HDF | Entire cardiac cycle | Analyzing both longitudinal and transversal HDF throughout the cardiac cycle enables the identification of distinct phenotypes with prognostic value beyond EF and LGE in non-ischemic LV cardiomyopathy | [18] |
A-B: apical-basal; AUC: area under the curve; CMR: cardiac magnetic resonance; CRT: cardiac resynchronization therapy; DCM: dilated cardiomyopathy; Echo: echocardiographic; EF: ejection fraction; HDF: hemodynamic forces; HFpEF: heart failure with preserved ejection fraction; HFrEF: heart failure with reduced ejection fraction; I-A: inferior-anterior; IVPG: intraventricular pressure gradients; L-S: lateral-septal; LBBB: left bundle branch block; LGE: late gadolinium enhancement; LV: left ventricular; RMS: root mean square; STEMI: S-T segment elevation myocardial infarction; TAVI: transcatheter aortic valve implantation
Clearly, different parameters are calculated in different phases of the cardiac cycle. More importantly, the terminology is sometimes confusing. For instance, the definition of the systolic phase varies according to the time limits (encompassing or not the negative wave of the elastic recoil). Furthermore, the term “impulse” can be ambiguous according to the context where it is used. In physics, the impulse is a vector quantity defined as the time integral of the force or as the change in momentum (Δp) and is equivalent to the area under a force-time curve. However, from a physiological and semantic point of view, the term impulse implies a thrust related to acceleration. Thus, to avoid confusion and misinterpretation, we suggest using the term “impulse” for the intervals including an ascending HDF curve (acceleration) and reserving the term “change in momentum” when the waves are downsloping (deceleration). Finally, the AUC (area under the curve) can be measured either in the HDF or in the HDP curve. In the first case, the AUC represents an impulse (change in momentum) and once normalized by the time interval it is the averaged or normalized AUC (nAUC). When the AUC is computed from the HDP curve, it represents a hemodynamic work. A glossary of physics terms with a technical meaning is reported in Table 2.
Glossary
| Parameter | Definition | Formula | Unit |
|---|---|---|---|
| Force | An influence that can cause an object to change its velocity. | Mass × acceleration, | N |
| Momentum | Mass in motion (quantity of movement). | kg × m/s | |
| Impulse | The time integral of the force, i.e. the change (Δ) in momentum (p) of an object (momentum is a vector quantity, so impulse is a vector quantity). | N × s | |
| HDF [2] | The integral of pressure gradients over the left ventricle, normalized to left ventricular volume and blood specific weight (thus reported as % of gravity acceleration). | A vector defined by the integral. | % |
| HDP [3] | A physics-based measure that takes into account the dynamics of the space-time shape changes in combination with blood flow. | d(HW)/dt. A scalar quantity defined by the scalar product between the HDF vector, normalized by the LV volume V(t), and another vector obtained by a surface integral | W = J/s |
| HW | The displacement of an object due to force. | Force × distance. The time integral of the HDP, computed by | J = N × m |
| RMS | The square root of the arithmetic mean of the squares of a set of values. Based on the mathematical formula, this parameter cannot differentiate between positive and negative curves. | Computed by | - |
| AUC | The space between a curve and a straight line that connects two points on that curve. | N × s |
AUC: area under the curve; HDF: hemodynamic forces; HDP: hemodynamic power; HW: hemodynamic work; J: Joule; N: Newton; RMS: root mean square; W: Watt
Based on our experience, we describe the main parameters that can be derived from the HDF curve with the aim of providing a guide for a uniform assessment and easy comparison among different studies.
This analysis includes the whole cardiac cycle from the beginning to the end of the curve. It corresponds to the mean amplitude of the forces throughout the entire cardiac cycle. Longitudinal and latero-medial HDF are expressed as root mean squared (RMS), also called quadratic mean, which is the arithmetic mean of the squares of a group of values. Thus, both positive and negative values of the curve are included in the analysis. Accordingly, the following parameters can be derived:
Longitudinal (apex-to-base) HDF (%)
Latero-medial HDF (%)
Latero-medial/longitudinal HDF ratio
In addition, the average angle of the HDF vector (which represents the dominant direction of HDFs) can be measured using a polar coordinate system, with values ranging from 90° (when the force is perfectly along the base-apex direction) to 0°. In normal subjects, HDF are predominantly oriented in a longitudinal direction, with a small component aligned in a lateral direction. Although these measurements are widely used, they include both systole and diastole, thus the contribution of the specific phases of the cardiac cycle cannot be differentiated.
Analysis of a given event during the cardiac cycle can be easily performed by selecting appropriate time intervals on the curves. At this aim, the dV/dt curve is theoretically ideal, because it represents the rate at which volume changes over time, which can be crucial for understanding the behavior of systems whose volume is not constant. However, in practice, the dV/dt curve is often noisy (this usually happens when the quality of wall tracking is poor and the volume curve itself is irregular, which is uncommon in CMR studies), which may hamper the accuracy of the selection of proper time intervals. Alternatively, the HDF curve can be used, with the intercept of the curve with the zero line (zero-crossing) as a reliable marker for the selection of most of the time intervals. It should be noted that when one event fades into another without crossing the zero line (as the transition from the elastic recoil into suction), the time setting from the HDF curve is misleading.
This phase is defined from the rise of the HDF curve [in patients with delayed ventricular contraction, the R wave in the ECG (electrical activity) is preferred] until the next zero-crossing, which corresponds to the minimum value on the volume curve. The systolic ejection includes two components.
It expresses the ability of the ventricle to generate a high-pressure gradient in a short period of time. Timing is selected from the rise until the positive systolic peak of the HDF curve (Figure 2, S1). Parameters:
Impulse (AUC of the HDF wave) (mN or %)
Slope: the tangent to the ascending phase of the systolic ejection starting from the point when the HDF curve changes its direction (becoming positive)
Peak value: the maximal value reached during this phase (%)
Time to peak: the time needed to reach the maximal value during this phase (ms)
When the HDF curve reaches its peak, the apex-to-base IVPG starts to decrease (descending part of the positive curve), as a large amount of blood volume has been ejected, until the curve reaches the zero value (no pressure gradient). The starting point is set on the systolic peak of the HDF curve. The endpoint is set at the next zero-crossing, which corresponds to the minimum value on the volume curve (Figure 2, S2). Parameters:
Δp: the change in momentum (AUC of the HDF wave) (mN or %)
Duration (ms)
This phase consists of two components, the elastic rebound and the suction.
At this point, LV flow is decelerating and the IVPG revert (base-to-apex direction), thus the HDF curve has a short negative component. The interval is from the S2 zero-crossing until the end of this negative wave (that in general does not reach the zero line). During this phase, the HDF moves in the opposite direction with respect to the flow, until AV closes (Figure 2, S3). Parameters:
Δp: the change in momentum (AUC of the HDF wave) (mN or %)
Peak value: the maximal value reached during this phase (%)
Ventricular apical suction starts at the end of myocardial fibers contraction. In this phase there are no changes in LV volume, however, IVPG is generated by the changes in the shape of the LV. At the end of the LV contraction, the rapid untwist of the apex and the recoil of the elastic forces, stored in the myocardium during the previous systolic phase, generate a pressure gradient directed from the base of the LV to the apex before the opening of the mitral valve (i.e. during the isovolumic phase of the ventricular relaxation). This interval is set from the end of S3 to the next zero-crossing of the HDF curve (Figure 2, D1). Parameters:
Δp: the change in momentum (AUC of the HDF wave) (mN or %)
Duration (ms)
The initial part of the HDF during this phase is still oriented toward the apex of the heart (negative values). As soon as the LV pressure exceeds the left atrial pressure, the passive LV filling decreases, the IVPG is reverted (apex-to-base direction), and the HDF increases in the positive ascending phase. Then, the flow from the left atrium to the left ventricle is progressively reduced, which eventually equalizes the pressure in the two chambers. At this stage, the HDF curve reaches the zero value. During these phases, the HDF vector is opposite to the blood flow direction. The endpoint of the early filling phase is set at the zero-crossing at the end of the positive wave (Figure 2, D2). Parameters:
Δp: the change in momentum (AUC of the HDF wave) (mN or %)
Duration (ms)
During this period the HDF is close to zero (Figure 2, D3).
The atrial contraction causes a relative gradient from base to apex (atrial thrust, HDF negative vectors) due to the blood actively forced into the left ventricle by the left atrial contraction. Parallel to the increase in LV blood volume, the IVPG is reversed and, after crossing the zero line, the HDF curve becomes positive, despite the blood still flowing from the left atrium to the left ventricle (Figure 2, D4). Parameters:
Δp: the change in momentum (AUC of the HDF wave) (mN or %)
Duration (ms)
The separation between elastic rebound and suction is not always clear. In this case, a single interval including both events (S3 + D1) is recommended as a measure of the systo-diastolic transition.
Spectral Doppler recording of the aortic and mitral flow can be used as an additional marker for time setting of the intervals of the cardiac phases in case of HDF curve ambiguity.
Aortic and mitral valve areas affect the morphology of the HDF curve. Therefore, care must be taken for the acquisition of high-quality images (in particular with echocardiogram) and standardization of diameter measurements. For follow-up studies, the same values of valve areas are recommended in the same subject.
There are no data on the feasibility of echocardiography and CMR for HDF analysis. Reliable HDF curves are based on high-quality endocardial border tracking, thus higher feasibility with CMR can be anticipated.
Given the profound impact of various clinical conditions on the magnitude, spatial distribution, and temporal trend of both segmental and global myocardial mechanics, the great diagnostic potential of HDF analysis becomes evident. In fact, this approach translates complex myocardial dynamics into a concise set of clinically relevant parameters which facilitates diagnostic accuracy.
Thanks to the application of advanced mathematical models, HDF analysis can be currently applied to routinely acquired echocardiographic or CMR images independent from the brands of equipment. This approach offers advantages compared to LVEF (left ventricular ejection fraction) and deformation imaging and is able to resolve the changes in cardiac mechanics that occur during selected phases of the cardiac cycle. The main findings of the studies on HDF are reported in Table 1 based on the conclusions of the authors. The available experience indicates the clinical utility of HDF in the early detection and follow-up of patients with cardiomyopathy/heart failure, assessment of patients with dyssynchrony, and evaluation of the athlete’s heart. However, the most relevant parameters in these clinical scenarios have not been defined yet. Finally, comparative studies between echocardiography and CMR in the same group of normal subjects are needed to assess differences in values due to the imaging methods applied.
HDF is a physical property that provides a spatial-temporal representation of the pressure gradients induced by cyclic interaction between blood and tissue boundaries. Its analysis represents a useful novel tool to detect early impairment of LV function and might provide an opportunity for medical intervention at an early stage. The definition of cardiac events, both in terms of timing and terminology, is of paramount importance for comparing the results of different studies. The HDF parameters reported in this article might represent an effort toward standardization for most clinical studies. Additional parameters during different phases of the cardiac cycle could be considered to answer specific questions.
AUC: area under the curve
AV: aortic valve
CMR: cardiac magnetic resonance
HDF: hemodynamic forces
HDP: hemodynamic power
IVPG: intraventricular pressure gradients
LV: left ventricular
AS: Conceptualization, Writing—original draft, Writing—review & editing, Supervision. GT: Conceptualization, Writing—review & editing. AZ, BT, ZK, and DJ: Validation. NZ: Visualization, Validation.
The authors declare that they have no conflicts of interest.
Not applicable.
Not applicable.
Not applicable.
Not applicable.
This work was supported by the Ministry of Science and Higher Education of the Republic of Kazakhstan [AP23490021]. The funder had no role in study design, data collection and analysis, decision to publish, or preparation of the manuscript.
© The Author(s) 2025.
Open Exploration maintains a neutral stance on jurisdictional claims in published institutional affiliations and maps. All opinions expressed in this article are the personal views of the author(s) and do not represent the stance of the editorial team or the publisher.
Copyright: © The Author(s) 2025. This is an Open Access article licensed under a Creative Commons Attribution 4.0 International License (https://creativecommons.org/licenses/by/4.0/), which permits unrestricted use, sharing, adaptation, distribution and reproduction in any medium or format, for any purpose, even commercially, as long as you give appropriate credit to the original author(s) and the source, provide a link to the Creative Commons license, and indicate if changes were made.