 Original Article

Affiliation:
1Department of Biosystems and Agricultural Engineering, University of Kentucky, Lexington, KY 40506, USA
Affiliation:
2School of Engineering, University of Guelph, Guelph, ON N1G2W1, Canada
Affiliation:
3Department of Molecular and Cellular Biochemistry, University of Kentucky, Lexington, KY 40506, USA
Affiliation:
1Department of Biosystems and Agricultural Engineering, University of Kentucky, Lexington, KY 40506, USA
Email: akinbode.adedeji@uky.edu
ORCID: https://orcid.org/0000-0002-3497-0166
Explor Foods Foodomics. 2025;3:101088 DOI: https://doi.org/10.37349/eff.2025.101088
Received: January 18, 2025 Accepted: July 03, 2025 Published: July 17, 2025
Academic Editor: Zuhaib F Bhat, SKUAST-Jammu, India
Aim: Protein structure-function relationship understanding is very important to the study of protein chemistry. In this study, we determined the 3D structure of glutelin type-B 5-like (GTB) protein from proso millet and investigated the effects of simulated temperature and static electric field on GTB protein’s secondary structures, solvent accessibility surface area (SASA), the radius of gyration (Rg), root mean square deviation (RMSD), and total dipole moment with the view to elucidate its structural behavior under different simulated processing stresses.
Methods: This study leveraged homology modeling to determine the 3D structure of the GTB protein from proso millet. We further explored in silico modeling using molecular dynamic modeling tools to study the behavior of the GTB protein structure under simulated temperatures and static electric field processing stresses.
Results: The 3D protein structure of GTB is majorly a protomer that comprises three monomers with one jelly-like β-barrel and two extended helix domains, and the remaining 35% as coils. From the molecular dynamic simulation, the secondary structure of the protein was not disrupted at temperatures between 300–400 K and static electric fields between 0.1–3 V/nm, albeit with the loss of a few amino acid residues. The RMSD increased significantly with temperature, static electric field, and simulation time increase. However, the Rg and SASA decreased for the same conditions, suggesting that the protein structure is compacting during thermal and electrical treatment.
Conclusions: We concluded that low levels of simulated temperature and low levels of the electric field may cause a temporary reversible conformational change of GTB protein, not enough to cause a major disruption as may be expected during empirical processing of protein. To achieve greater disruption that would mimic protein denaturation, there is a need for in silico study of protein molecules under more aggressive simulated stressors for a longer time, and consideration given to protein structure development from AlphaFold3.
The three-dimensional structures of food proteins dictate their biological and sometimes processing functionality. The structure-function relationship has remained a central dogma in elucidating the mechanism of protein functionality at the molecular level. This understanding provides information to identify processes and technologies to improve protein functionality and/or suppress undesirable functionality such as allergenicity and unwanted flavor [1]. For instance, Tandang-Silvas et al. [2] compared the three-dimensional structure of 11S proglobulins of amaranth, procruciferin, pumpkin pro-11S, soybean proA1aB1b, soybean proA3B4, and pea prolegumin and showed that the smaller cavity (4,167.1 Å3) of 11S proglobulin of amaranth seed was responsible for the higher midpoint denaturation temperature (Tm) values (98.85˚–102.85˚C) and the thermal stability, compared to other 11S proglobulins. Pantoja-Uceda et al. [3] revealed that the presence of a hydrophobic patch (five methionine residues that partially hide Trp76) at the surface of the three-dimensional structure protein surface may have been responsible for the high emulsifying properties of a 2S albumin protein from seeds of sunflower. The authors showed that the presence of a superhelix motif, especially a “hypervariable loop” in the sunflower albumin 8 (SFA-8) structure of sunflower protein, which is also common to other 2S albumin proteins, may have been responsible for the allergenicity of the sunflower proteins. Fukuda et al. [4] compared the three-dimensional structures of 7S globulin proteins from dzuki beans (7S1, 7S3), soybeans (β-conglycinin β, β-conglycinin α′c), and mung beans (8Sα). Their work revealed that the differences in their thermal stability and solubilities are related to the size of the cavity found inside the molecules of each of these proteins. Furthermore, they showed that the difference in electrostatic surface potential distribution may cause differential solubility at pH 8. For instance, while the 7S1, 7S3, and 8Sα were soluble at pH 8, the β-conglycinin β and β-conglycinin α′c were not [4].
Molecular dynamic (MD) modeling is one of several tools that is gaining interest in studying the structure-function relationship of food proteins. Unlike traditional empirical investigations, MD provides an elucidation of structural changes at the atomic and molecular levels under dynamics-simulated processing stresses. Several authors have studied the structure-function relationship of food protein using MD modeling. Vagadia et al. [5] investigated the effects of temperature (300 K to 393 K) and oscillating electric field (0.5 V/nm and 2.45 GHz) of the soybean trypsin inhibitor (STI) in silico. The study showed that the effects of the external stresses disrupted the amino acid (AA) residues (31–41, 61–66) and a rearrangement of the secondary structure (coils and turns), but the core of the STI was still stable due to an antiparallel β-sheet structure [5].
In another earlier study, a myoglobin molecule in water exposed to pulsed and static electric fields (108 V/m to 109 V/m) was examined using MD; the authors reported that a remarkable structural rearrangement in the myoglobin molecules can be achieved by the application of 109 V/m pulsed electric field for a few picoseconds or static electric field for a few nanoseconds [6]. It is confirmed by several authors that only a high electric field strength can cause a major disruption in the secondary structure of protein molecules [1, 6, 7].
Glutelin is the second-largest group of storage proteins in proso millet, with the protein concentration accounting for about 34–39% of the total protein content [8]. The glutelin group forms most of the proteins in proso millet protein concentrate (MPC) as produced by acid/alkaline extraction methods; the MPCs are used as a protein ingredient for food applications such as making cookies, bread, and other ready-to-eat products. Like other cereal proteins, the wide applications of MPC in food applications are limited by their low functionality (solubility, emulsion, and foam properties) compared to other premium ingredients like similar proteins from soy, pea, and dairy [8, 9]. Knowledge of the structure-function relationship of protein is needed to understand how the functionality of MPC could be improved. The traditional method of structure-function relationships does not allow for multiple scenario analysis and could be costly to implement. There is a significant benefit in in silico modeling of stress environments that modify protein-structure functions [8, 10, 11]. MD modeling has been used in biological sciences to study the protein structure of various food and non-food proteins under different environmental conditions, such as temperature, pH, electric field, ionic strength, and pressure. In particular, MD modeling allows researchers to simulate how these stressors induce conformational changes in protein secondary and tertiary structures, revealing mechanisms that affect solubility, aggregation, and binding interactions. For proso millet glutelin, MD modeling could be employed to identify specific AA residues or structural motifs that contribute to poor functional properties, thereby enabling the rational design of protein modifications or processing conditions to enhance emulsification, foaming, and solubility. This computational approach provides a powerful, cost-effective tool for screening multiple structural scenarios before experimental validation, accelerating the development of functional millet-based protein ingredients for diverse food systems [11, 12].
The first step to the structural prediction and structure-function study of such proteins begins with the identification of their AA sequence and, in some cases, their close homologs (usually AA similarity > 30%). Very recently, the genes that coded for the AA sequence glutelin storage proteins in proso millet were annotated and reported by Shi et al. [13]. They identified three glutelin protein subunits. One “glutelin type-B 5-like” protein with 256 AA residues and two “glutelin-2-like” proteins, possible isoforms, one having an AA residue of 156 and the other with AA residues of 161 AA residues [13]. In our previous study, we had identified that “glutelin type-B 5-like” protein has close homologs (above 40% structural identity) in the Protein Data Bank (PDB), which could facilitate easy determination of its three-dimensional structure, unlike the two “glutelin-2-like” proteins with zero homologs. We further cloned the gene that codes for the “glutelin type-B 5-like” protein and performed purification steps, but were unable to obtain a stable protein for X-ray crystallography [10]. Owing to the difficulties and time constraints associated with the empirical determination of the three-dimensional structure of the glutelin storage proteins from proso millet and lack access to the AlphaFold platforms (an AI program developed by DeepMind, a subsidiary of Alphabet, capable of performing prediction of protein structure at a higher level than the traditional approach) as at the time of the study, we, therefore, determined its three-dimensional structures using the traditional comparative homology modeling and predicted some of its physicochemical properties. Additionally, we investigated the effects of temperature with static electric fields on the “glutelin type-B 5-like” protein using MD modeling. We evaluated three levels of temperatures (300 K, 350 K, and 400 K) and three levels of static electric fields (0.1 V/nm, 1 V/nm, and 3 V/nm) on the root mean square deviation (RMSD), root mean square fluctuations (RMSF) per residue, the radius of gyration (Rg), total dipole moment, volume, density, secondary structure analysis, and solvent accessibility surface area (SASA). The study of “glutelin type-B 5-like” in silico provides a model for understanding the 11–12S globulin proteins of most cereals, which are widely homologous to the “legumin” type globulin protein present in most legumes.
The AA sequence corresponding to the “glutelin type-B 5-like” proteins (256 AA) was retrieved from the National Centre for Biotechnology Information (NCBI, www.ncbi.nlm.nih.gov) in FASTA format with accession number RLM98351 [11, 12]. The AA sequence was searched by protein-protein BLAST against the PDB proteins to identify templates for model building. The templates with over 35% AA identity were selected for the “glutelin type-B 5-like” protein. A summary of the protein details used for homology modeling is presented in Table S1.
Template-based protein structure modeling of “glutelin type-B 5-like” protein was carried out using the Swiss‐Model server (https://swissmodel.expasy.org/) [11–15] and the Robetta web server (http://robetta.bakerlab.org) [16] using the five templates with over 35% sequence identified from the PDB database (IDs: 2E9Q, 3QAC, 3KSC, 3C3V, and 1UD1). The procedure for modeling using the Swiss-Model and the Robetta web server has been documented by [14, 17]. Unlike the Swiss-Model server, the Robetta web server returned only the monomer of “glutelin type-B 5-like” protein, and since the active form of “glutelin type-B 5-like” protein is a trimer, the homo-trimers configuration of “glutelin type-B 5-like” protein was further modeled into a trimer with the Galaxy Homomer web server (https://galaxy.seoklab.org/cgi-bin/submit.cgi?type=PEPDOCK) [18, 19]. Structural comparison of all the models (a total of five) generated by the two structure-building servers was evaluated by the Partial Order Structure Alignment (POSA) server using the RMSD as an index of similarity [20]. Assessment of the model quality was performed by the Swiss-Model structural assessment tool to identify the best model quality from all models. The best model, determined based on Qualitative Model Energy Analysis (QMEAN) [15], was selected and used for geometry minimization.
Geometry minimization of selected models for the “glutelin type-B 5-like” protein one from each modeling server was carried out by the geometry minimization tool of Python-based Hierarchical Environment for Integrated Xtallography (PHENIX) [21] with 1,000 maximum iterations and five macro-cycles. The evaluation of refined models was assessed by the Psi/Phi Ramachandran plot from PROCHECK [22]. The overall quality of the models was assured using Z-scores of the ProSA-web tool (https://prosa.services.came.sbg.ac.at/prosa.php/) [23, 24] and the QMEAN with Distance Constraints (QMEANDisCo) [25]. Furthermore, the final model was submitted to the Protein Model Database (PMDB, http://srv00.recas.ba.infn.it/PMDB/main.php) with PMDB identifier PM0083241.
The MD simulations of the “glutelin type-B 5-like” in water were carried out by the Groningen Machine for Chemical Structure (GROMACS) software package (version 2018.1, Stockholm Center for Biomembrane Research, Stockholm, Sweden) [26]. The “glutelin type-B 5-like” protein used in this study can be downloaded from the PMDB with the identity number PM0083241, where we had deposited it. The protein is a protomer of three non-covalently linked monomers, with each monomer chain comprising 5.0% α-helix, 2.5% 3/10 helix, 23.8% β-sheet, and 69.17% coils/turns/bends/bridges (Figure 1). The protein-containing 11,574 atoms from 768 residues were kept in a cubic box of a dimension 11.683 nm × 11.683 nm × 11.683 nm as a periodic boundary condition, and the protein was solvated with 146,262 atoms of water molecules neutralized with 6 sodium ions.
A snapshot of the three-dimensional structure of the “glutelin type-B 5-like” protein molecule
The OPLS-AA/L all-atom force field [27] and SPC/E water model [28] were selected to provide potential energy function and water parameters to the system. Following neutralization of the systems to mimic the physiological state of the protein, the systems were energy minimized to converge at maximum force value < 1,000.0 kJ/(mol·nm) using a stepwise descent minimization algorithm for 100,000 steps, and the systems were further equilibrated to a constant number of particles, volume, and temperature (NVT) and a constant number of particles, pressure, and temperature (NPT) for 200 ps at 300 K and 1 bar. The MD simulations were run for 1 ns using a leap-frog integrator algorithm during which the temperature of the systems was maintained using a modified Berendsen thermostat, and the pressure was maintained using the Parrinello and Rahman barostat [29, 30]. A total of nine simulations were run for static electric field levels coupled with the temperature levels (Table 1). The results of simulations such as RMSD, Rg, and SASA were analyzed using GROMACS inbuilt tools. GROMACS inbuilt dictionary of the secondary structure of protein (DSSP) [31, 32] was used for the secondary structure analysis, and virtual MDs (VMD) [33] were used to visualize protein conformational change.
A summary of experimental process conditions
| Temperature | Pressure | Static electric field | Simulation length |
|---|---|---|---|
| 300 K | 1 bar | 0.1 V/nm1 V/nm3 V/nm | 1 ns |
| 350 K | 1 bar | 0.1 V/nm1 V/nm3 V/nm | 1 ns |
| 400 K | 1 bar | 0.1 V/nm1 V/nm3 V/nm | 1 ns |
A completely randomized 23-factorial design was used in this experiment. Two treatment factors of temperature and static electric field, and three levels per treatment were considered. Six response variables (RMSD, total dipole moment, Rg, SASA, volume, and density) average replicates were analyzed by one-way-ANOVA using the GLM procedure of SAS (SAS Institute, 2004) to determine the differences in means at a significant level of P < 0.05. Tukey’s test was used to assess the difference among specific treatment means at P < 0.05. The temperature and pressure levels were selected to represent typical industrial process conditions (room temperature, denaturation temperature, and super-critical temperature range).
Five templates were selected for building the “glutelin type-B 5-like” protein. The templates were obtained from the PDB by searching using the “glutelin type-B 5-like” protein AA as the query and for sequence alignment on the NCBI database. The search query returned about 16 hits (matches) with sequence similarity above 30%. Only five templates (ID: 2E9Q, 3QAC, 3KSC, 1UD1, and 1FXZ) were considered based on sequence similarity above 35%, the expected value (E-value), and conformational resemblance with the empirical data of the structure of the protein (i.e., trimer). The E-value gives information on the likelihood of getting a hit or a protein by chance. Thus, the lower the score, the better the template fits our model. A summary of the results from the search query for the templates is shown in Table S2. Other crystal structures with similar identities and E-values were not selected due to non-conformation with the empirical data. For example, the crystal structure of coconut allergen cocosin (ID: 5WPW) with 38.35% similarity and an E-value of 8 × 10–25 was not selected because its natural state was a homo hexamer while our protein from empirical studies is a homo-trimer [11].
A total of ten models of the “glutelin type-B 5-like” protein were developed (five from each server) using two of the top-ranked and widely used structural building servers (Robetta and Swiss-Model servers) as ranked according to the community-wide critical assessment of predicted interactions (CAPRI) [12]. Unlike the Swiss-Model, which builds a model by transferring structural information of a conserved atom from the template onto the model, the Robetta web server builds up the model by turning the protein sequence into a parsed domain and then predicts the model from the domain [14, 17]. Protein residues that cannot be modeled were built by de novo structure prediction by both servers. Inputting both the target sequence (“glutelin type-B 5-like”) and the templates into the servers generated five models, one for each template. Unlike the Robetta web server, the Swiss-Model server returned models with truncated residues: residues 1–76 and 245–256 were removed by moving the N- (AA residue) and C- (carboxyl group) terminals to glutamine (77) and glycine (244), respectively. This is expected since all the templates have five variable regions (I, II, III, IV, and V) that were removed from their original AA sequence because the residues in these regions caused disorder in the crystal growth during experimentation of their homologs [34]. These regions are mainly looped within all the AA sequences. Generally, the “glutelin type-B 5-like” protein model reveals a protomer composed of three monomers, which are linked non-covalently, as can be seen in Figure 2. The model tertiary structure contains a jelly-like β-barrel and two extended helix domains. These domains are highly conserved relative to the different 11S or pro-11S globulin proteins of pea, soybean, pumpkin, amaranth, rapeseed, and Ara h protein of peanuts, except that these other proteins have two jelly-like β-barrels, not one as seen in their homologs [2, 34, 35]. The structure also contains two major variable regions at the terminals. This structure was not unexpected, as many of the “glutelin type-B 5-like” protein homologs displayed similar protomer structure. Empirically, from another study we conducted, we observed from cloning, expression, and purification of the “glutelin type-B 5-like” protein, that the protein is a trimer with a molecular weight of 96 kDa, as against its predicted molecular weight of 22.4 kDa [11].
Visualization of the three-dimensional structure of the “glutelin type-B 5-like” protein model geometrically minimized using PHENIX. (A) Model generated from the Swiss-Model server; (B) model generated from the Robetta web server. The color code points to each chain of the monomer. PHENIX: Python-based Hierarchical Environment for Integrated Xtallography
To evaluate the ten models generated from the servers, the RMSD of the superimposed models from each of the servers showed a good fitting of the protein main chain with minimal deviations of 1.16 Å and 2.86 Å for models from the Swiss-Model and Robetta web servers, respectively. The higher RMSD value for Robetta may have been contributed by the disordered variable region. Furthermore, model quality assessment was done by QMEAN Z-scores [36] using the Swiss-Model structural assessment tool [15] as presented in Table S3. The closer this value is to zero, the more the predicted model fits the experimental structure of a similar size. Thus, the model generated from the 2E9Q template was further used for geometry minimization.
To improve the structure of the “glutelin type-B 5-like” protein, the two models following the initial quality assessment were subjected to geometry minimization using PHENIX [21] with 1,000 maximum iterations and five macrocycles. Geometry minimization relaxes the backbone bond angle by allowing full flexibility of the bond angle and bond lengths, thereby improving the energy landscape of the protein [37]. The models following geometry minimization are presented in Figure 2 and were re-evaluated using the Ramachandran plot, Z-scores, and QMEANDisCo scores as presented in Table 2. Although the Z-scores seem not to have improved, the bond and bond angles improved significantly, as can be seen in the Ramachandran plots. The bond angles increase from 94.01% to 99.8% and from 93.4% to 98% for the Swiss-Model and Robetta model, respectively (Figure S1). Comparing the minimized structure to the unminimized ones showed that there were zero bad angles and bad bonds for both minimized models and 6 bad bonds, 97 bad angles, 3 bad bonds, and 15 bad angles for both unminimized models, respectively.
Summary of the “glutelin type-B 5-like” protein geometry minimized model’s quality assessment scores
| Model type | Ramachandran plot (%) | Z-scores | QMEANDisCo scores | ||
|---|---|---|---|---|---|
| Allowed | Generally allowed | Disallowed | |||
| Swiss-Model server | 99.8 | 0.7 | 0 | –5.44 | 0.62 ± 0.05 |
| Robetta web server | 98 | 1.4 | 0.5 | –5.11 | 0.48 ± 0.05 |
QMEANDisCo: Qualitative Model Energy Analysis with Distance Constraints
Following model optimization, the model from the Swiss-Model server was used in the MD simulation. The RMSD is a measure of the changes in the conformation of the protein due to the application of external processing stresses such as temperature, pressure, and electric field. It compares the protein’s new conformation to its native or initial conformation as shown by the equation:
Where rfinal is the final coordinates of atom i, rinitial is the initial coordinate of atom i, and N is the number of atoms. The average of the RMSD for the “glutelin type-B 5-like” protein after 1 ns simulation from different combinations of temperature and static electric field is presented in Table 3 and Figure 3. The average values of RMSD for the “glutelin type-B 5-like” protein ranged from 0.28 to 0.61 across temperatures of 300–400 K, looking at both data for static and zero electric field treatments. It can be observed that the RMSD increases with temperature (Figure 3) at all electric field levels and decreases with a static electric field at all temperature levels, except at 300 K. Both the temperature and static field have significant effect (P < 0.0001) and interaction effects on the RMSD of the protein (P < 0.001). Additionally, the RMSD was observed to increase with simulation time for all treatment combinations (Figure 3). Static electric field treatments caused a higher RMSD compared to zero electric field treatment for all levels of temperatures. At 300 K levels of thermal treatment, the effects of the electric field were less pronounced compared to higher temperature thermal treatment. This phenomenon has been reported by Singh and co-workers [1] where it showed a static electric field of 0.002 V/nm and 0.004 V/nm had no effects on the stability of the structure of soybean hydrophobic protein at 300 K. Vanga and co-workers [38] also reiterated this observation when they revealed that both static (0.05 V/nm) and oscillating electric field (0.05 V/nm, 2,450 MHz) at 300 K had no significant effects on the RMSD of Ara h 6 peanut protein allergen.
Average root mean square deviation (RMSD), the radius of gyration (Rg), solvent accessibility surface area (SASA), volume, and density of the “glutelin type-B 5-like” protein after 1 ns simulation under different temperature and electric field conditions
| Treatments | RMSD (nm) | Rg (nm) | SASA (nm2) | Vol (nm3) | Density (g/L) |
|---|---|---|---|---|---|
| 300 K, 0 V/nm | 0.28 ± 0.05a1 | 3.25 ± 0.02a1 | 495.70 ± 5.38a1 | 167.02 ± 1.28a12 | 829.07 ± 6.35a12 |
| 300 K, 0.1 V/nm | 0.29 ± 0.06b2 | 3.22 ± 0.01b1 | 490.94 ± 3.40b1 | 166.69 ± 1.12b2 | 830.72 ± 5.56b1 |
| 300 K, 1 V/nm | 0.32 ± 0.08c13 | 3.21 ± 0.02c1 | 503.71 ± 6.50c1 | 167.56 ± 1.19c2 | 826.44 ± 5.87c1 |
| 300 K, 3 V/nm | 0.30 ± 0.06d23 | 3.23 ± 0.01d3 | 492.81 ± 3.82d1 | 166.28 ± 1.33d1 | 832.79 ± 6.64d12 |
| 350 K, 0 V/nm | 0.40 ± 0.09a1 | 3.23 ± 0.02a1 | 495.55 ± 6.96a1 | 167.09 ± 1.54a12 | 828.75 ± 7.62a12 |
| 350 K, 0.1 V/nm | 0.46 ± 0.10b2 | 3.24 ± 0.04b1 | 484.91 ± 17.21b1 | 166.24 ± 2.07b2 | 833.07 ± 10.41b1 |
| 350 K, 1 V/nm | 0.39 ± 0.09c13 | 3.18 ± 0.04c2 | 471.00 ± 13.43c1 | 164.72 ± 1.64c2 | 840.71 ± 8.37c1 |
| 350 K, 3 V/nm | 0.45 ± 0.12d23 | 3.20 ± 0.03d3 | 476.08 ± 15.57d1 | 164.98 ± 2.05d1 | 839.41 ± 10.39d2 |
| 400 K, 0 V/nm | 0.54 ± 0.12a1 | 3.23 ± 0.06a1 | 462.85 ± 26.15a1 | 163.65 ± 3.27a12 | 846.48 ± 16.88a12 |
| 400 K, 0.1 V/nm | 0.61 ± 0.16b2 | 3.22 ± 0.04b1 | 479.99 ± 15.84b1 | 165.33 ± 2.23b2 | 837.69 ± 11.24b1 |
| 400 K, 1 V/nm | 0.57 ± 0.13c13 | 3.23 ± 0.02c3 | 485.62 ± 15.03c1 | 166.18 ± 2.21c2 | 833.38 ± 11.11c1 |
| 400 K, 3 V/nm | 0.59 ± 0.14d23 | 3.30 ± 0.06d3 | 483.40 ± 20.29d1 | 165.57 ± 2.61d1 | 836.52 ± 13.11d32 |
For a given attribute and corresponding mean, values with different letter or number superscript are significantly different from temperature and PEF standpoint, respectively, while values with common letter or number superscript are not significantly different
Root mean square deviation (RMSD) of the “glutelin type-B 5-like” protein under different simulation conditions (temperature and static electric field) for 1 ns simulation time
RMSF reveals information on the flexible and rigid regions of the protein structure. The RMSF of the protein on a per-residue basis at the end of the 1 ns simulation is presented in Figure 4. From Figure 4, it can be observed that higher fluctuations were recorded at a high temperature of 400 K and the least at 300 K. The fluctuations only increased with an increase in temperature, but not with an increase in static electric field. The N- and C-terminals of the proteins showed a high degree of fluctuation consistently with all the treatments for all the chains (A, B, and C). The regions around the two distant α-helices (R60–A65 and A233–K240) of the protein showed a higher RMSF compared to the β-sheet regions (D103–H106, S122–L128, V132–A133, Y138–T140, S145–V159, A165–L171, Q175–V179, T18–R200, and T20–R209). The average fluctuation for all residues recorded for the treatments are 0.05 ± 0.02, 0.05 ± 0.02, 0.05 ± 0.02, 0.05 ± 0.02 for 300 K, 0–3 V/nm; 0.06 ± 0.03, 0.06 ± 0.03, 0.06 ± 0.03, 0.06 ± 0.03 for 350 K, 0–3 V/nm; and 0.07 ± 0.03, 0.08 ± 0.04, 0.08 ± 0.03, 0.08 ± 0.03 for 400 K, 0–3 V/nm.
Root mean square fluctuations (RMSF) of the “glutelin type-B 5-like” protein per residue under different simulation conditions (temperature and static electric field) after 1 ns simulation time
The secondary structure of the protein molecule was analyzed using the inbuilt DSSP tool of GROMACS. The changes in the number of residues count that contribute to the secondary structure profile of the protein after 1 ns of different treatment levels are presented in Figure 5, while the percentage distribution of the secondary structures is presented in Table S4. It is expected that following the application of processing stresses that cause unfolding and denaturation of the protein, the unstable structures, such as coil, turn, and bend, should increase while the more stable structures, such as helices and sheets, should decrease in count. It was observed that the increase in the number of residues for coils and bends was more obvious at 400 K, with a corresponding decrease in the number of residues for β-sheets and α-helices. There was a progressive increase in the number of residues for bend with temperature, and the effects of the static electric field were observed. It is possible that short-time simulation may not be enough to cause an irreversible unfolding or permanent denaturation of the protein’s secondary structure, which may explain the reason for the absence of a progressive or regressive trend in the behavior of the secondary structures of the protein. It is worthy of note that these changes were not statistically significant at P > 0.05. The expectation as reported by Li et al. [39] was that high temperature treatment should result in the unfolding of glutelin conformation, which should cause a decrease in the α-helix content and increase the β-sheet content.
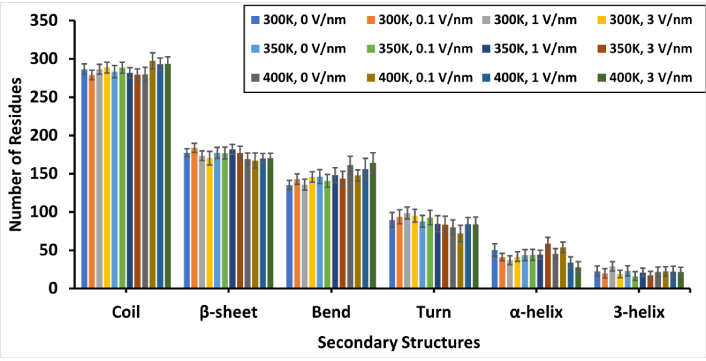
The number of residues present in the secondary structure of the “glutelin type-B 5-like” protein molecules under different simulation conditions (temperature and static electric field) after 1 ns simulation time
The snapshot of the molecule after simulation (Figure S2) did not show an obvious disruption to the secondary structure when compared to all treatments. However, the changes in the percentage distribution profile of the secondary structure (Table S4) showed that some of the residues that make up the secondary structure were lost without necessarily disrupting the secondary structure conformation. In addition, the interchange between turns structure and helices was observed with simulation time (data not shown). For instance, we analyzed the secondary structures of the protein at 300 K temperature level with STRIDE [40] (data not shown) and observed that the α-helix in the region of P114–L119 on chain A lost one residue to become a turn within region I115–L119 after treatment with a static electric field of 0.1 V/nm. No loss of residue was observed with treatments of 1 V/nm and 3 V/nm. Also, an α-helix formed on chain B in the region V222–Y229 when a static electric field of 0.1 V/nm was applied to the protein molecule. This was disrupted to 310-helices when the static electric field changed to 1 V/nm and 3 V/nm (both at region V222–V224), losing 3 residues as turns.
The dipole moment is a good measure of the behavior of a protein to the external electric field [6]. It gives information on the polarization response of the protein to the external electric field, and any shift in the total dipole moment is an indication of protein denaturation or transition in the protein secondary structures [6, 7]. The total dipole moment of the “glutelin type-B 5-like” protein frames with simulation time is presented in Figure 6. It can be observed that as early as 100 ps, there were already deviations from the non-electric field treatment for temperatures 300 K, 350 K, and 400 K, indicating an early transition in the secondary structure of the protein, which became more pronounced between 400 ps to 600 ps and much more between 800 ps to 1,000 ps. The static electric field of 0.1 V/nm was observed to show the least deviation at all temperature levels. Both temperature and static electric field have significant effects (P < 0.05) on the differences observed in the total dipole moment.
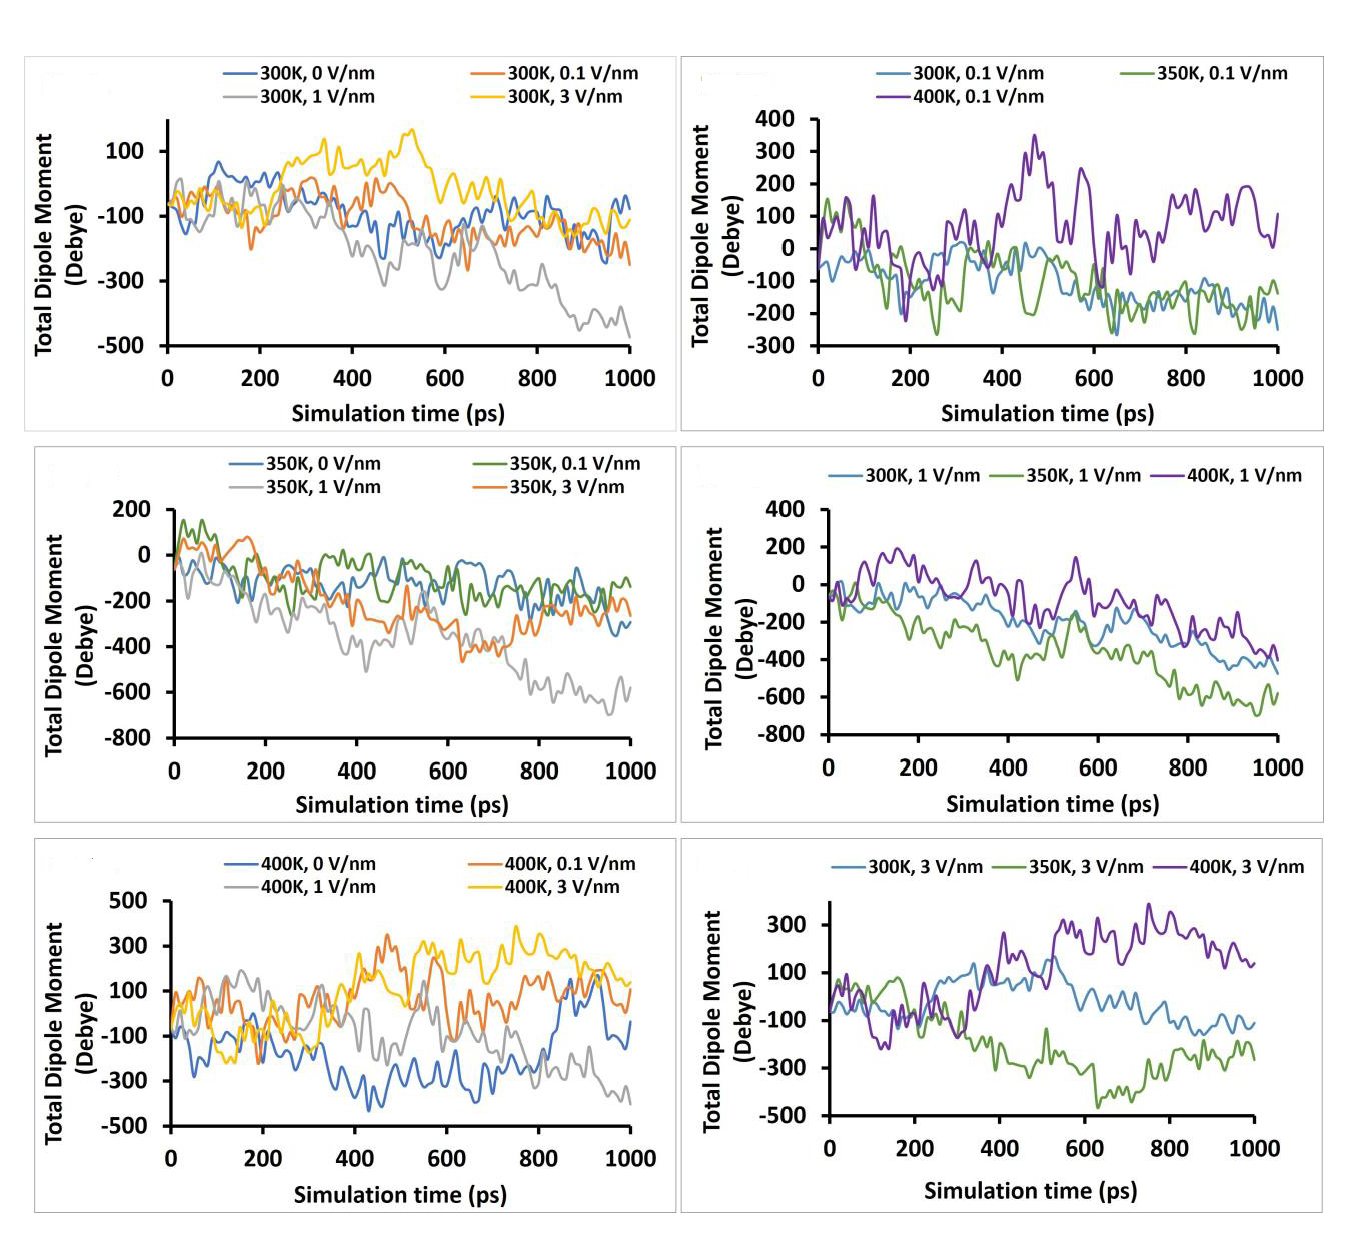
The total dipole moment of the “glutelin type-B 5-like” protein under different simulation conditions (temperature and static electric field) after 1 ns simulation time
The Rg provides information on the spread of the atoms of the protein molecule with respect to its center of mass. This information is useful for understanding if the proteins compact into a globular state or unfold. The higher the Rg, the less compact the protein and vice-versa [1, 41]. The Rg is calculated from the equation below:
Where r(i) is the coordinate of atom i, rcentre is the coordinate of the center of mass of the protein, and N is the number of atoms. The Rg was observed to reduce with the simulation time for all the treatments, which indicates that the protein compacts over time with electrical and heat treatment. Proso millet protein has been reported to compact via hydrophobic aggregation during thermal treatment, which leads to reduced protein digestibility [42]. Similar phenomena of a decrease in Rg with simulation time were reported for peanut allergen (Ara h 6 protein) [38], and the Rg of STI protein was also reported to decrease because of heating. The heating of protein in solution at high temperature (80˚–100˚C for pea protein) has been known to cause new aggregation through hydrophobic interaction following the revelation of hydrophobic residue during heating [43]. This behavior was observed for all the treatments where there was an initial increase in the Rg between 0–200 ps and then followed by a downtrend in Rg for the rest of the simulation time (Figure 7). This could be explained by the initial unfolding of the protein, leading to a high Rg, followed by the new aggregation for the rest of the simulation time. The average Rg for all treatments is presented in Table 3. For zero electric field, the Rg decreased significantly (P < 0.05) with an increase in temperature, and though there were significant differences in Rg with the static electric field and the interaction of the two factors, close observation of the data in Table 3 does not show a steady decrease or increase in Rg with the static electric field.
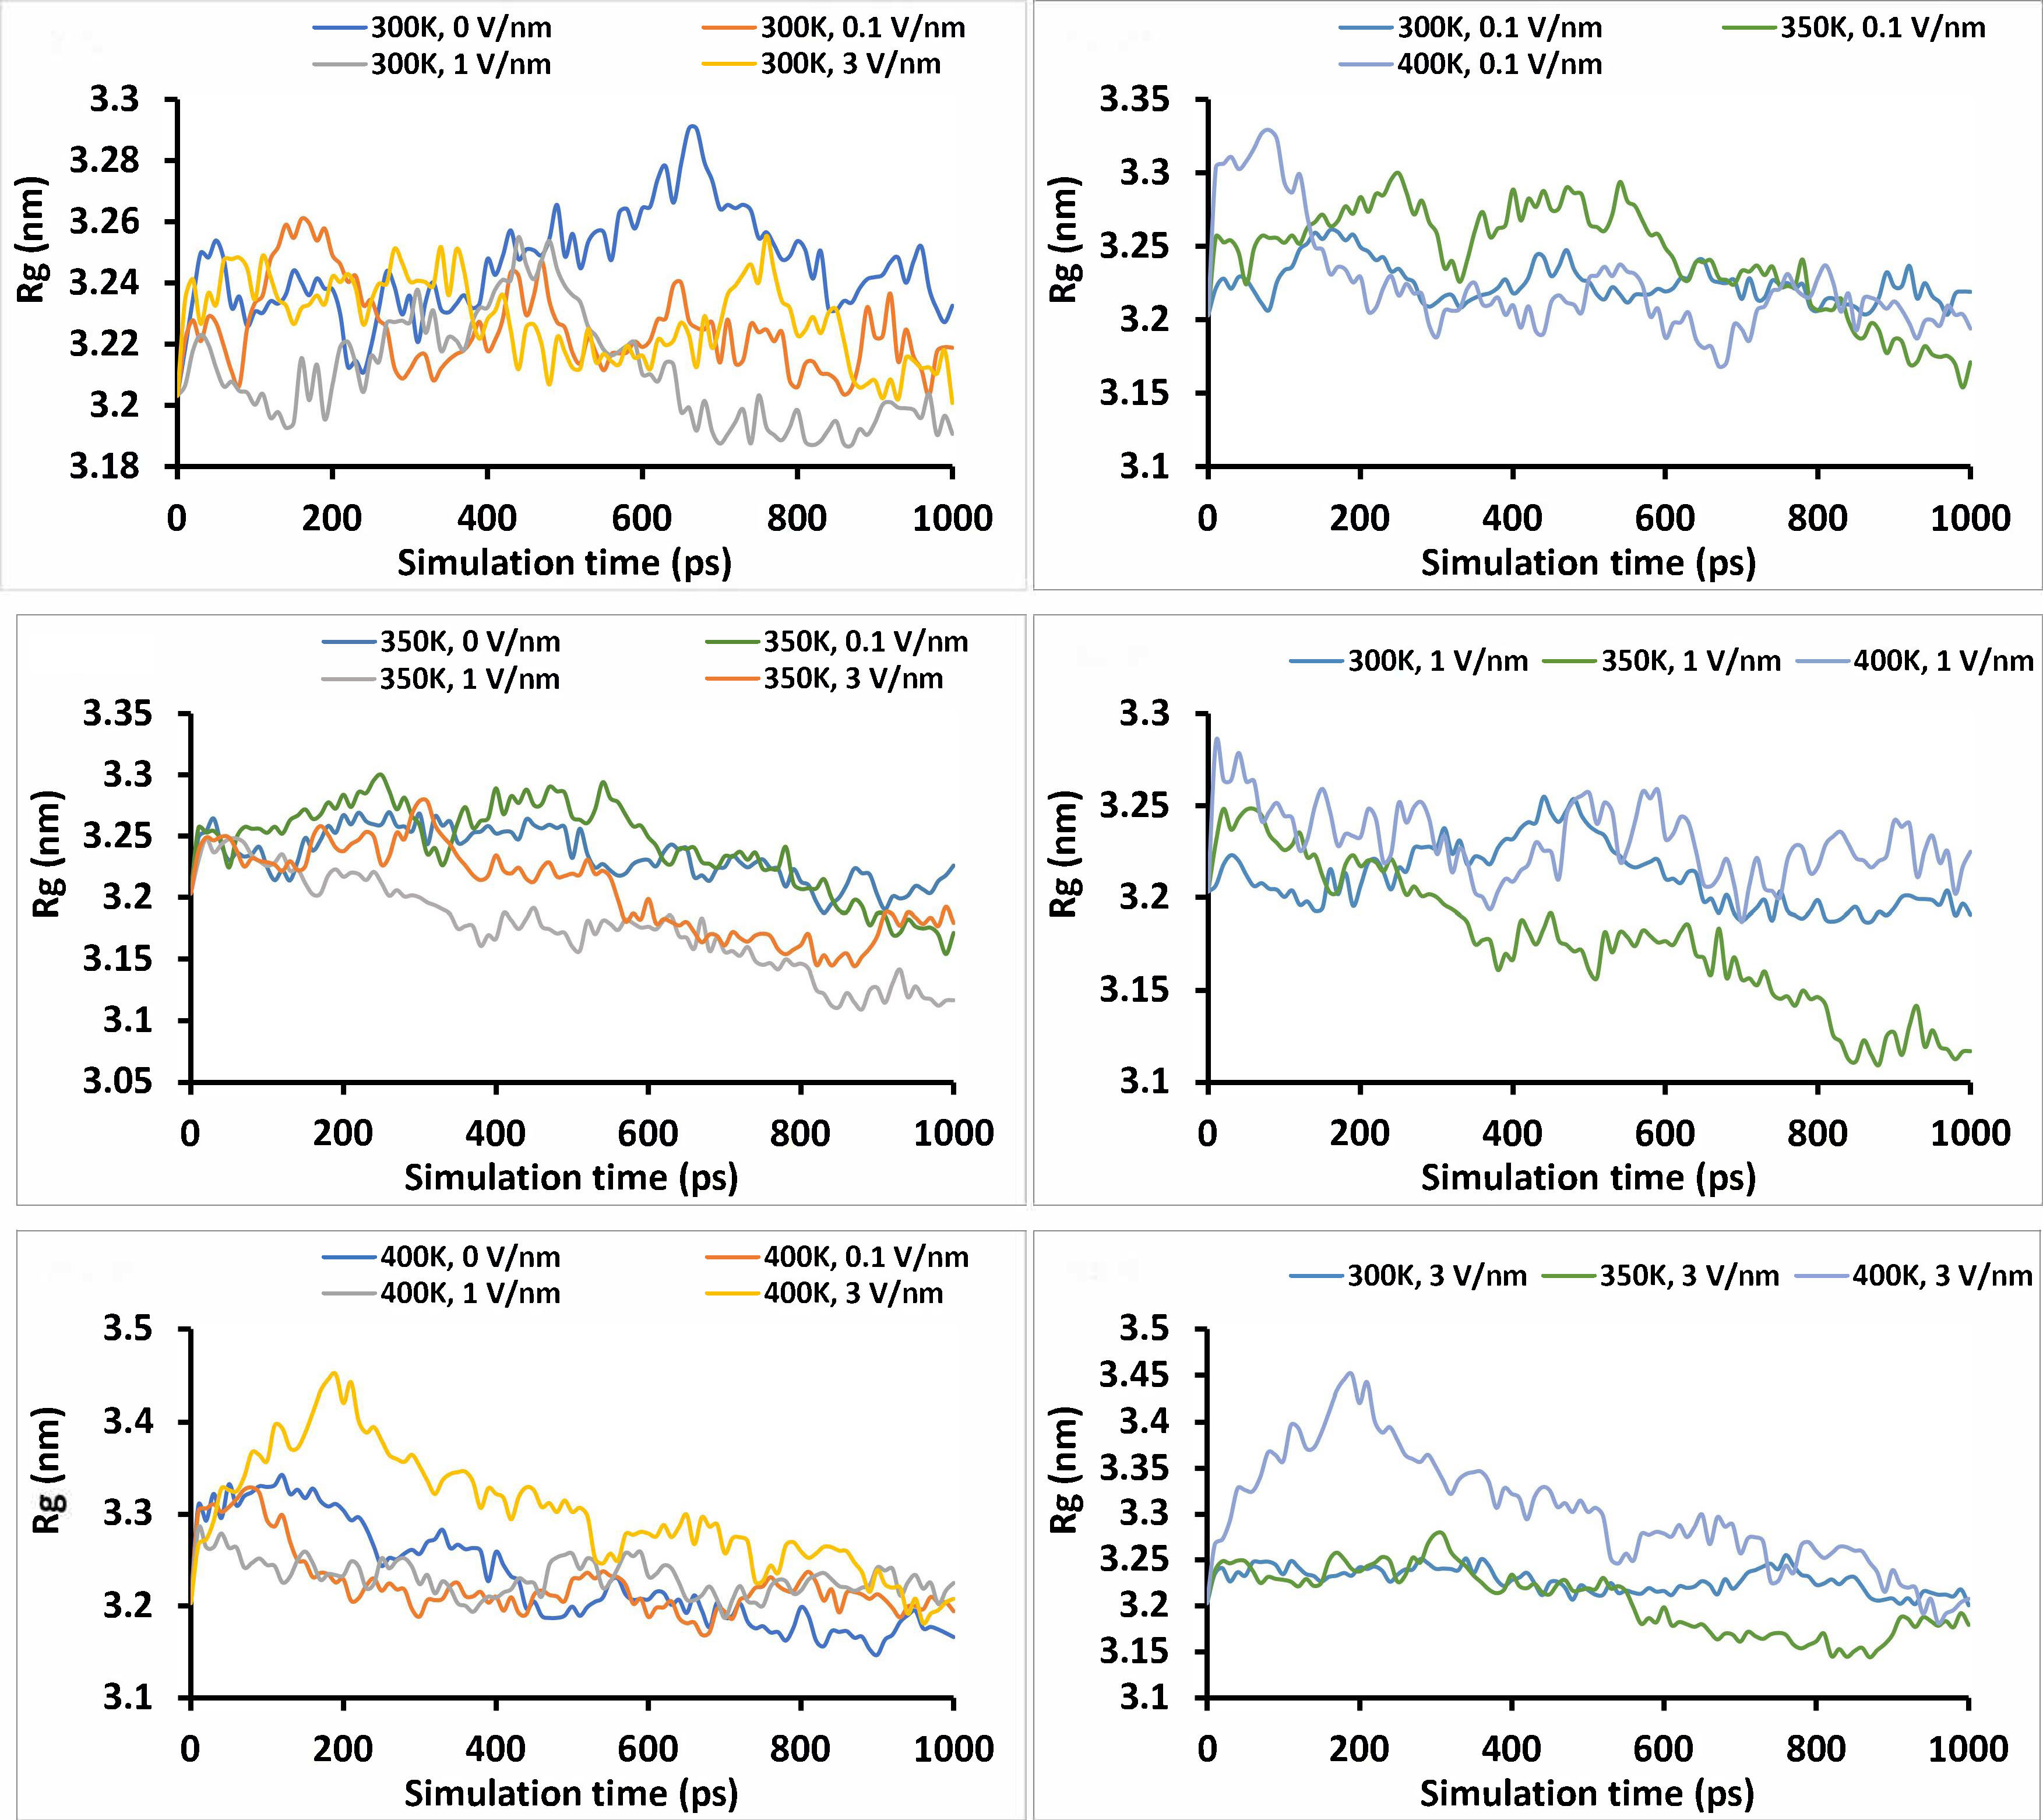
The radius of gyration (Rg) of the “glutelin type-B 5-like” protein under different simulation conditions (temperature and static electric field) for 1 ns simulation time
The SASA is one of the surface-active properties of the protein that impacts its functionality, such as surface hydrophobicity, which in turn affects the protein solubility, emulsifying, and foaming ability [8, 44]. The hydrophobicity of protein is inversely related to its SASA [45]. The values of SASA at the end of 1 ns simulation are presented in Table 3, while the trends with simulation time are presented in Figure 8. From Figure 8, the SASA trends downward as the simulation progresses, confirming that the protein compacts over time, as seen by the trend observed with the Rg. Similar to the Rg, there was an initial increase in SASA of about 0–100 ps, which may indicate the initial unfolding due to applied treatment, causing an increase in SASA. Later, a decrease in SASA with simulation time was observed, which may have been due to the compaction of the protein molecule caused by hydrophobic aggregation. Vanga et al. [38] reported a similar downward trend in SASA with simulation time for Ara h 6 peanut allergy as a result of temperature and electric field treatment. Increasing the temperature from 300 K to 400 K causes a decrease in the average value of SASA at 0 V/nm and 0.1 V/nm static electric field, but at 1 V/nm and 3 V/nm static electric field, a decrease was observed from 300 K to 350 K and increased again at 400 K. The changes observed due to temperature were significant at P < 0.0001, but changes observed due to the static electric field were not at P < 0.05.
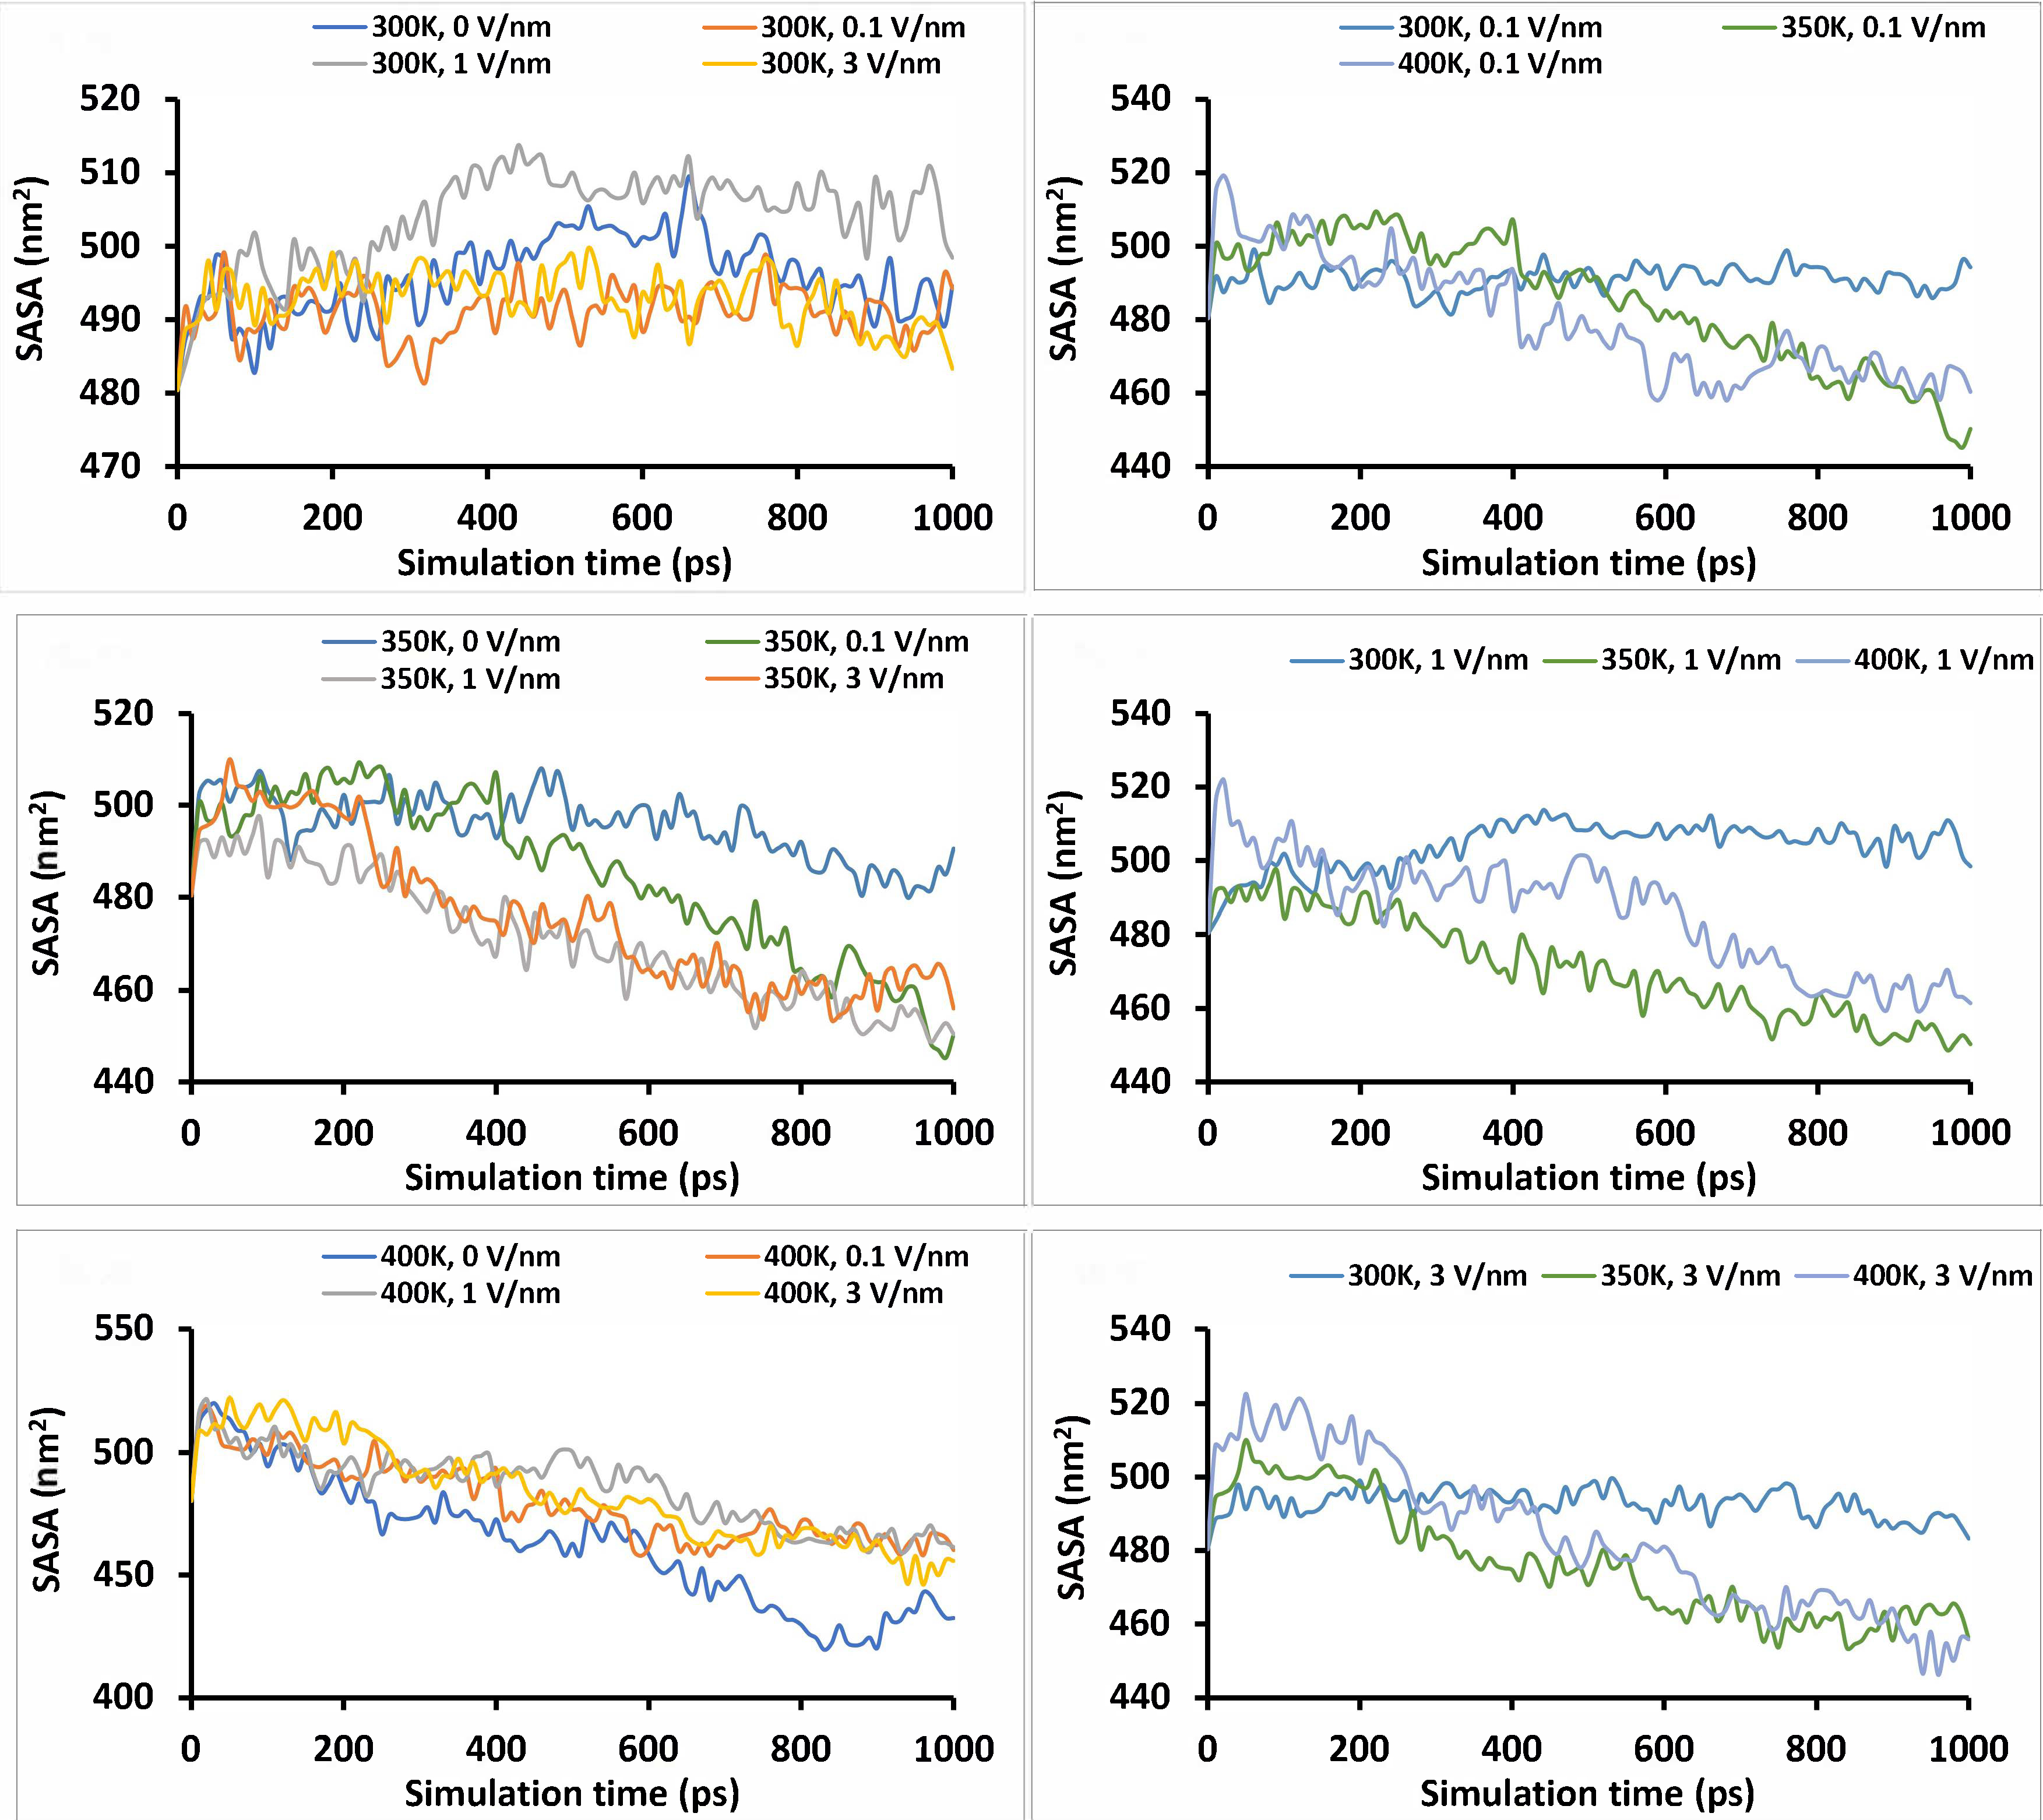
Solvent accessibility surface area (SASA) of the “glutelin type-B 5-like” protein under different simulation conditions (temperature and static electric field) for 1 ns simulation time
The volume and density of the “glutelin type-B 5-like” protein were stable with simulation time at 300 K for all static electric field treatment levels considered, with slight variations. However, at a temperature of 350 K and 400 K, a downward trend in the volume with simulation time was observed for all static treatment levels (Figure 9). At all levels of static electric field treatment, the average volume was observed to decrease from 300 K to 400 K, while the density, as expected, increased in reverse order. This further confirms that the protein molecules compacted as the temperature was ramped up from 300 K to 400 K. The changes observed in volume were significant (P < 0.05) for temperature, static electric field, and their interaction.
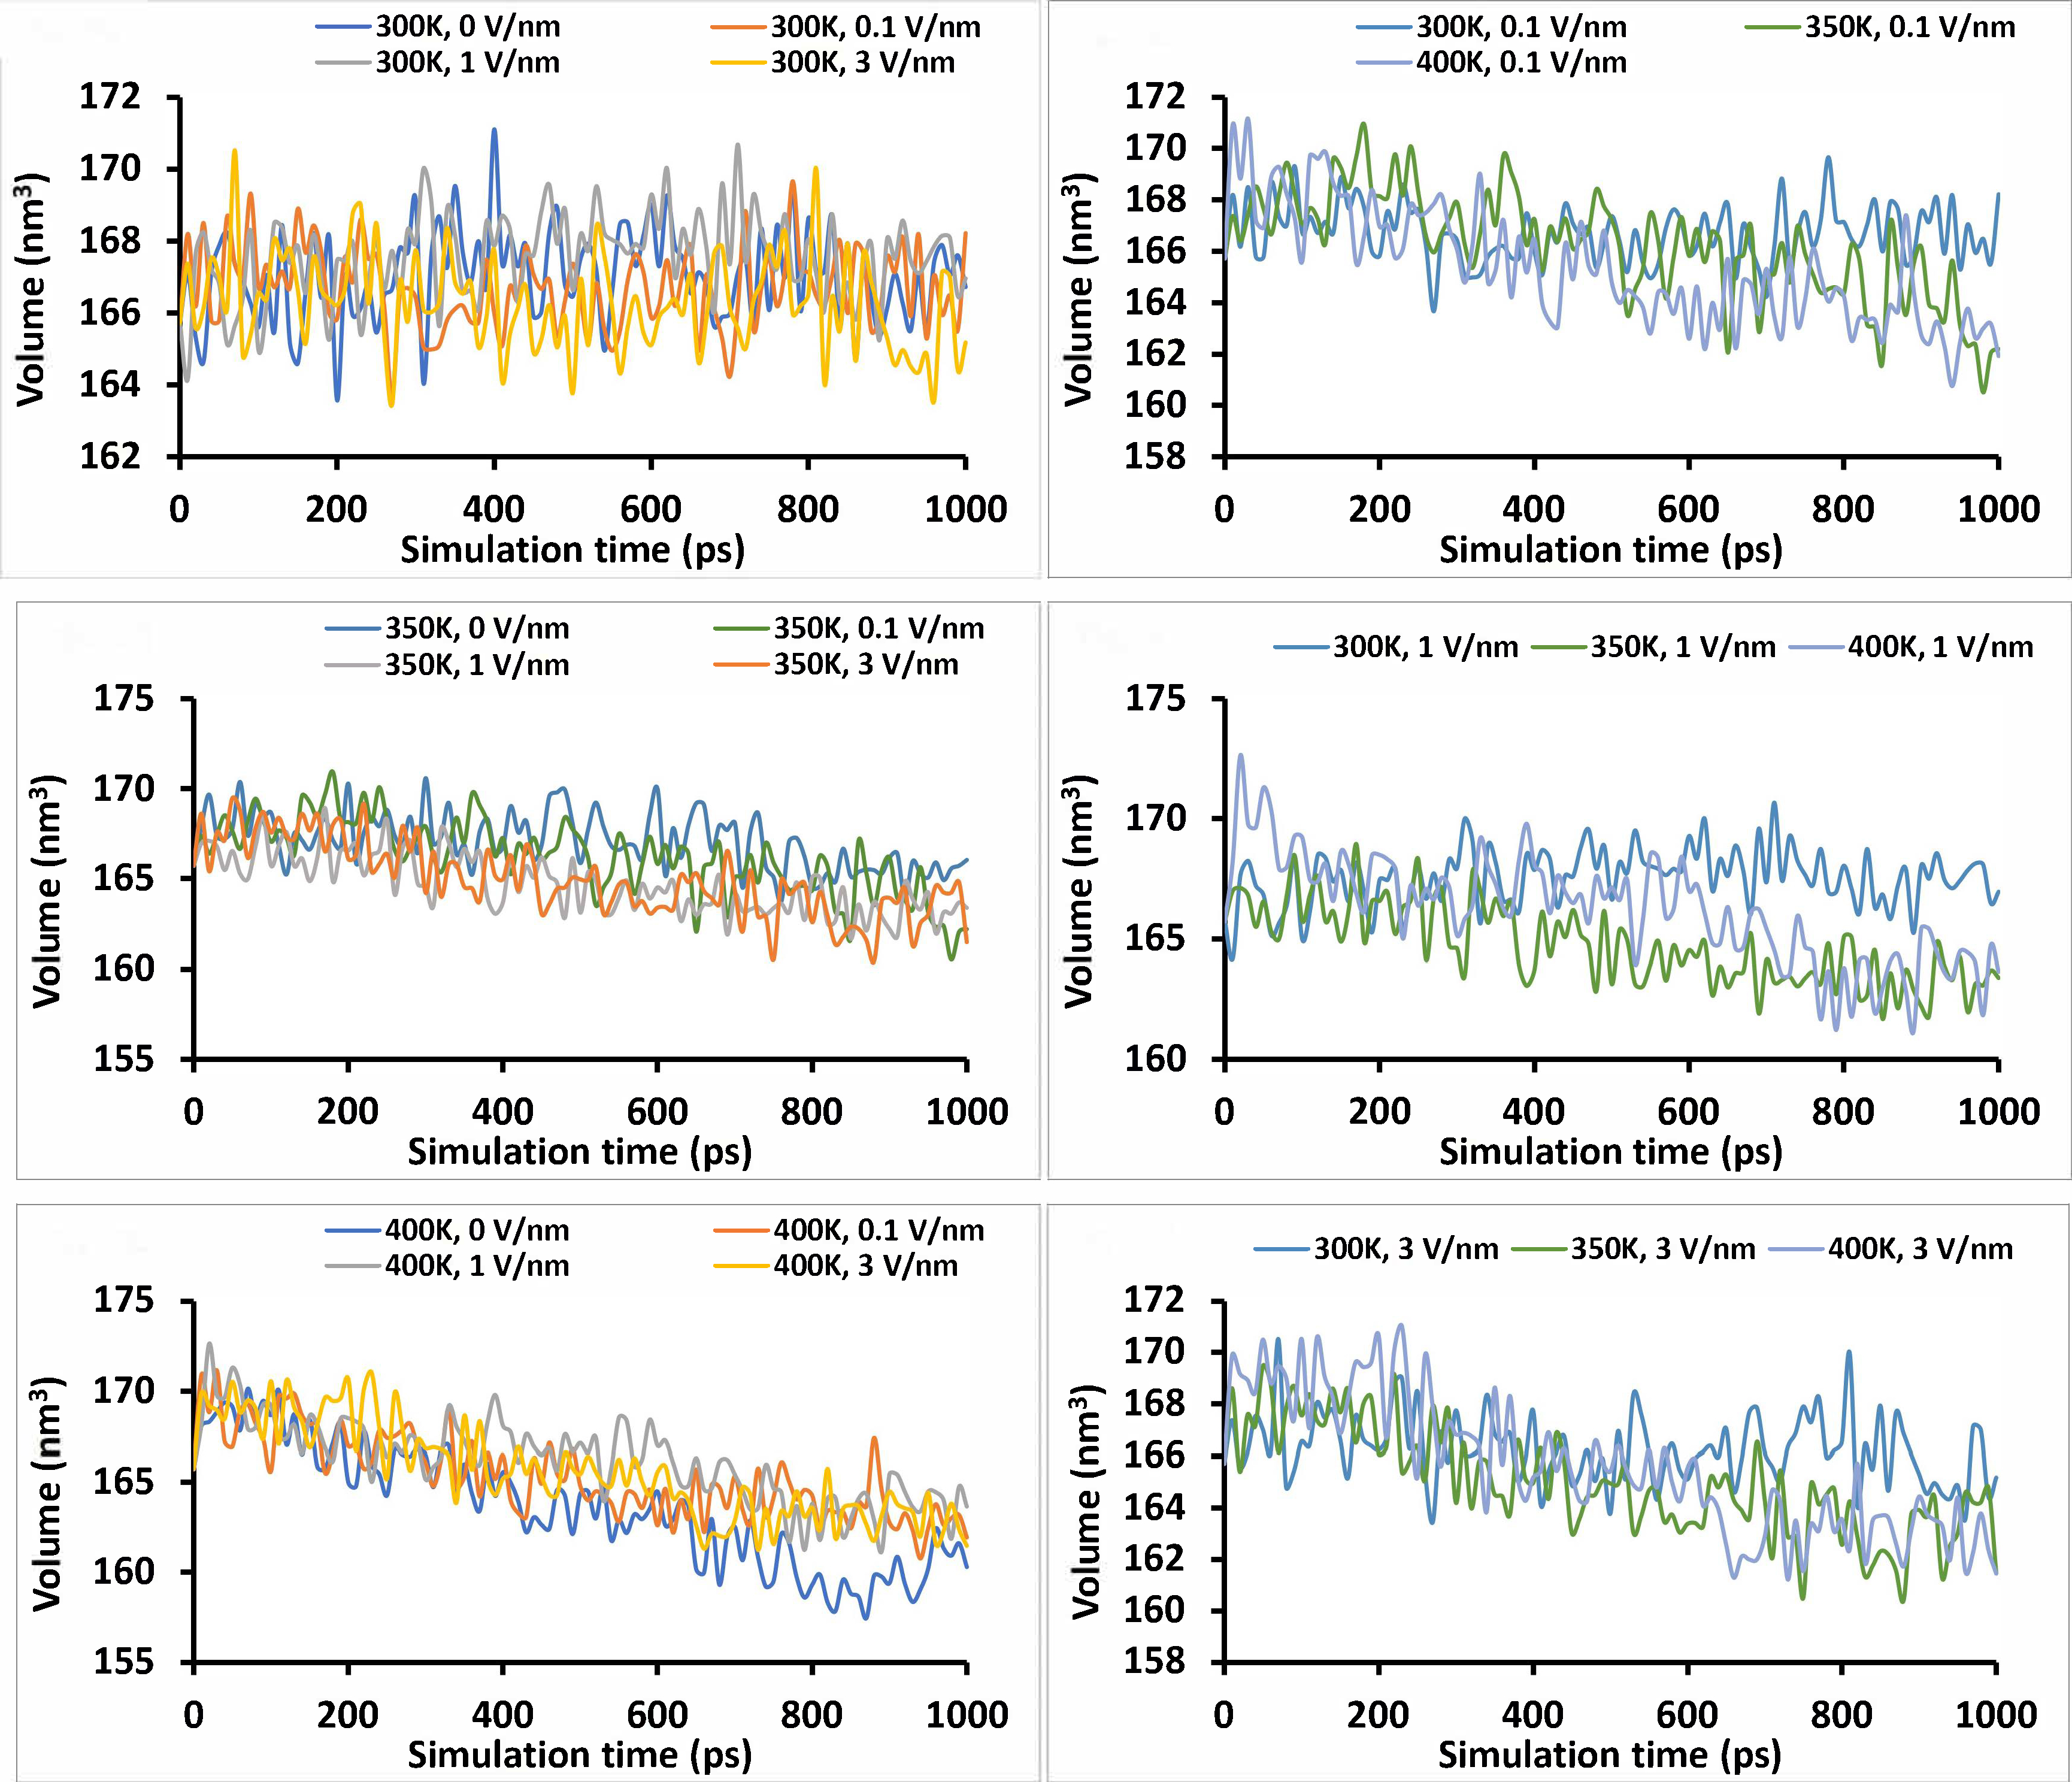
Volume changes were observed for the “glutelin type-B 5-like” protein under different simulation conditions (temperature and static electric field) for 1 ns simulation time
In summary, the three-dimensional structure of the “glutelin type-B 5-like” protein, a type of glutelin protein from proso millet, was successfully predicted using the Swiss-Model server and the Robetta web server. The two models obtained from the servers showed a good agreement in their main backbone and showed conserved domains with the globulin group of proteins from peas, amaranth, rapeseed, and peanuts. Ramachandra plot of the protein structure gave over 98% of residues in the favorable region. In modeling the effects of temperature and static electric field three levels of static electric field on the behavior of the “glutelin type-B 5-like” protein in an MD simulation environment, the simulated stresses caused a significant increase in the RMSD (0.28 nm to 0.61 nm across temperatures of 300–400 K) and a decrease in both the Rg and SASA, implying that the “glutelin type-B 5-like” protein is compacting under these simulated conditions. While the stresses led to the perturbation of the atomic trajectory of the protein with the evolution of time, it, however, did not cause a major disruption of the protein’s secondary structure. Longer MD simulations may be needed to cause the disruptions of the protein secondary structure, which can provide more information on how the surface-active properties (such as SASA and Rg) may be affected. The temperature had significant effects on the changes observed for all parameters measured (RMSD, SASA, and Rg), while the effects of the static electric field were insignificant for SASA.
AA: amino acid
DSSP: dictionary of the secondary structure of protein
E-value: expected value
GROMACS: Groningen Machine for Chemical Structure
MD: molecular dynamic
MPC: millet protein concentrate
PDB: Protein Data Bank
PHENIX: Python-based Hierarchical Environment for Integrated Xtallography
PMDB: Protein Model Database
QMEAN: Qualitative Model Energy Analysis
QMEANDisCo: Qualitative Model Energy Analysis with Distance Constraints
Rg: radius of gyration
RMSD: root mean square deviation
RMSF: root mean square fluctuations
SASA: solvent accessibility surface area
STI: soybean trypsin inhibitor
The supplementary tables for this article are available at: https://www.explorationpub.com/uploads/Article/file/101088_sup_1.pdf. The supplementary figures for this article are available at: https://www.explorationpub.com/uploads/Article/file/101088_sup_2.pdf.
FA: Conceptualization, Methodology, Formal analysis, Investigation, Data curation, Writing—original draft. AS and KVK: Methodology, Formal analysis, Investigation. AA: Conceptualization, Investigation, Methodology, Supervision, Writing—review & editing. All authors read and approved the submitted version.
The authors declare that they have no conflicts of interest.
Not applicable.
Not applicable.
Not applicable.
The raw 3D structure of the glutelin type-B 5-like protein used can be obtained from the protein model database (PMDB; http://srv00.recas.ba.infn.it/PMDB/main.php) with PMDB identifier PM0083241. All other data will be made available by the authors to any qualified researcher.
This work was supported by the Kentucky Agricultural Experiment Station (KAES), the National Institute of Food and Agriculture (NIFA), U.S. Department of Agriculture, Hatch-Multistate project # [1024529]. The funders had no role in study design, data collection and analysis, decision to publish, or preparation of the manuscript.
© The Author(s) 2025.
Open Exploration maintains a neutral stance on jurisdictional claims in published institutional affiliations and maps. All opinions expressed in this article are the personal views of the author(s) and do not represent the stance of the editorial team or the publisher.
Copyright: © The Author(s) 2025. This is an Open Access article licensed under a Creative Commons Attribution 4.0 International License (https://creativecommons.org/licenses/by/4.0/), which permits unrestricted use, sharing, adaptation, distribution and reproduction in any medium or format, for any purpose, even commercially, as long as you give appropriate credit to the original author(s) and the source, provide a link to the Creative Commons license, and indicate if changes were made.

View: 3827
Download: 196
Times Cited: 0
