 Original Article


Affiliation:
1Department of Chemistry, College of Chemistry, University of California, Berkeley, Berkeley, CA 94720, United States
†These authors contributed equally to this work.
Email: isaac_kaba@berkeley.edu
ORCID: https://orcid.org/0000-0003-0234-0626


 ,
Affiliation:
2Centre d’Etudes des Substances Naturelles d’Origine Végétale (CESNOV), Faculty of Pharmaceutical Sciences, University of Kinshasa, Kinshasa B.P. 212, Democratic Republic of Congo
†These authors contributed equally to this work.
ORCID: https://orcid.org/0009-0006-8385-5988
,
Affiliation:
3Department of Epidemiology and Biostatistics, Arnold School of Public Health, University of South Carolina, Columbia, SC 29208, United States
ORCID: https://orcid.org/0009-0000-9839-1780
,
Affiliation:
2Centre d’Etudes des Substances Naturelles d’Origine Végétale (CESNOV), Faculty of Pharmaceutical Sciences, University of Kinshasa, Kinshasa B.P. 212, Democratic Republic of Congo
4Centre for Chemico- and Biomedicinal Research (CCBR), Department of Chemistry, Faculty of Sciences, Rhodes University, Grahamstown PO Box 94, South Africa
ORCID: https://orcid.org/0000-0001-9966-8251
,
Affiliation:
2Centre d’Etudes des Substances Naturelles d’Origine Végétale (CESNOV), Faculty of Pharmaceutical Sciences, University of Kinshasa, Kinshasa B.P. 212, Democratic Republic of Congo
5Bayer AG, 42096 Wuppertal, Germany
ORCID: https://orcid.org/0000-0002-2879-950X
,
Affiliation:
2Centre d’Etudes des Substances Naturelles d’Origine Végétale (CESNOV), Faculty of Pharmaceutical Sciences, University of Kinshasa, Kinshasa B.P. 212, Democratic Republic of Congo
ORCID: https://orcid.org/0000-0002-2859-7238
,
Affiliation:
2Centre d’Etudes des Substances Naturelles d’Origine Végétale (CESNOV), Faculty of Pharmaceutical Sciences, University of Kinshasa, Kinshasa B.P. 212, Democratic Republic of Congo
ORCID: https://orcid.org/0000-0003-2946-4047
Explor Foods Foodomics. 2026;4:1010194 DOI: https://doi.org/10.37349/eff.2026.1010194
Received: June 14, 2026 Accepted: August 24, 2026 Published: October 19, 2026
Academic Editor: Charalampos Proestos, National and Kapodistrian University of Athens, Greece
Aim: This study assesses the potential health risks associated with the consumption of sweetened beverages sold in Kinshasa, Democratic Republic of Congo (DRC), by analyzing physicochemical parameters and detecting harmful chemical contaminants in these drinks.
Methods: Ten brands of sweetened beverages commercially available in Kinshasa, the capital of DRC, were sampled across multiple flavors (n = 40 brand-flavor combinations, 120 individual samples). Physicochemical parameters including pH, titratable acidity (TA), and Brix degree were measured in triplicate for all samples. A subset of 18 of the 40 brand-flavor combinations was selected and subjected to ultra-performance liquid chromatography coupled to high-resolution mass spectrometry (UPLC-HR-MS) and nuclear magnetic resonance (NMR) for chemical fingerprinting and phthalate identification.
Results: All samples exhibited highly acidic pH values (2.19–3.96), with cola flavors recording the lowest pH across all brands. TA ranged from 1.792 to 5.440 g free acid L–1, with several brands exceeding established dental erosion risk thresholds. Sugar content ranged from 4.40 to 12.39 g/100 mL, exceeding recommended standards in all samples. Flavor type was the primary determinant of acidity, while sugar content varied significantly across brands. Phthalates, including butyl cyclohexyl phthalate, dibutyl phthalate, diisobutyl phthalate, and dimethyl phthalate, were qualitatively detected in most samples analyzed by UPLC-HR-MS and NMR. Azelaic acid, a marker of oxidative degradation of oleic acid, was also identified in several samples.
Conclusions: Sweetened beverages marketed in Kinshasa showed multiple quality concerns, including excessive acidity, high sugar content, and the qualitative identification of phthalates and oxidative degradation products. Although these findings may indicate potential health risks for vulnerable populations, such as children and adolescents and pregnant women, quantitative studies are required to assess full exposure levels of consumers and confirm associated health risks of these sweet beverages.
Over the past few decades, the consumption of sweetened beverages has increased markedly [1], especially in Africa [2–4]. These beverages are particularly consumed by children and adolescents [5] and therefore warrant greater regulatory scrutiny. Soft drinks can be defined as non-alcoholic, flavored, and sweetened beverages, typically carbonated, that contain water, sweeteners, and various food additives with little or no nutritional value. Soft drinks account for roughly a third of total daily sugar intake, making them the main source of added sugar in some consumers’ diets [6]. Sweetened drinks essentially consist of water and sugar [7], with the four major sugars being sucrose, glucose, fructose, and sorbitol [8]. Additionally, sweet drinks may contain plant extracts, such as colas, and/or a varying percentage of fruit juice, together with natural and synthetic food additives used to enhance taste, flavor, and color [7].
Sweet beverages can be categorized into two main groups, namely, sugar-sweetened beverages (SSBs) and fruit juices [9]. SSBs include flavored waters, iced tea, sports drinks, energy drinks, and sweetened carbonated beverages, as well as soda, fruit drinks, fruit nectars, syrup beverages, and sweetened tea [8, 10]. The term soft drink is sometimes used to encompass sodas and other SSBs [11], while juices that consist entirely of fruit (100% fruit juices) are not generally categorized as SSBs [8, 10]. The main characteristics of sweet drinks include high sugar content, low satiety effect, and incomplete energy compensation [12, 13]. Given the high consumption of these drinks, particularly among children and adolescents, they pose dangers to human health by promoting excessive calorie intake and displacing more nutritious dietary options [14, 15]. Several studies have correlated sugary drink consumption with a range of health issues, including excess weight and obesity [16, 17], diabetes and cardiovascular disease [9], and dental caries such as tooth decay [9, 18].
The Democratic Republic of Congo (DRC) is one of the countries facing several nutritional challenges, including undernutrition, micronutrient deficiencies [19], and the increasing burden of diet-related non-communicable diseases associated with contaminated foods due to poor quality control in the region [20, 21]. DRC hosts a large market for sweet beverages that has grown substantially in recent years, with numerous local and foreign manufacturers producing a wide variety of brands and flavors. However, the sweet beverage industry remains underdeveloped and is currently unregulated in DRC. Middle-income consumers generally have access to small packs of sweetened drinks (small doses of 10–15 cL) at an affordable price [2]. Additionally, these sweetened beverages are packaged in plastic bottles purportedly made of polyethylene terephthalate (PET) and appear to be exposed to poor storage conditions, including elevated temperatures, prolonged sunlight exposure, and inadequate cold chain management throughout their supply chain. The unregulated manufacture and poor storage of food-grade products remain a major problem in poor urban regions [22], and Congolese cities such as Kinshasa and Lubumbashi are no exception. Furthermore, the quality of most sugary drinks in the DRC is unknown, raising growing concerns regarding the consequences of their regular consumption by the population. Therefore, there is an urgent need for rigorous assessment and continuous monitoring of the quality of consumed sweet beverages and their impact on public health. National quality standards must be established to ensure that physicochemical properties and bacteriological quality remain within the norms prescribed by international regulations. Standards are also required for adequate packaging, presentation, satisfactory organoleptic characteristics, and supply chain regularity [2]. To assess the potential health risks of sweetened drinks consumed in Kinshasa, we conducted a study on the quality of sweet beverages marketed in the city. First, we evaluated the organoleptic characteristics of each product, including appearance, color, odor, and labeling compliance, across 10 different brands of sweet drinks. We then analyzed physicochemical parameters, including pH, titratable acidity (TA), and Brix degree, for each flavor of the different brands. Lastly, we investigated the presence of phthalates and other chemical contaminants by profiling phthalate fingerprints using nuclear magnetic resonance (NMR) and high-resolution electrospray ionization mass spectrometry (HR-ESI-MS) on a subset of 18 randomly selected samples among the total of 40 samples of different flavors of the 10 branded samples collected.
The samples consisted of 10 different brands of sweet beverages, randomly selected between April 19 and July 16, 2021, in Kinshasa, DRC (Figure 1, Table 1). Each brand comprises multiple flavors. A total of 40 flavor-brand combinations were sampled across the 10 brands. For each brand-flavor combination, three independently purchased bottles were collected from retail outlets, yielding a total of 120 individual samples (Table 1). Each bottle was analyzed separately. To the best of our knowledge, no sugar-sweetened-beverage tax or new beverage-specific regulatory framework has been introduced in the DRC since the 2021 sampling period. The sector continues to be governed only by the general conformity oversight of the Office Congolais de Contrôle (OCC), whose enforcement of standards for sweetened beverages remains limited; the dataset is therefore considered to remain representative of the beverages currently marketed in Kinshasa.
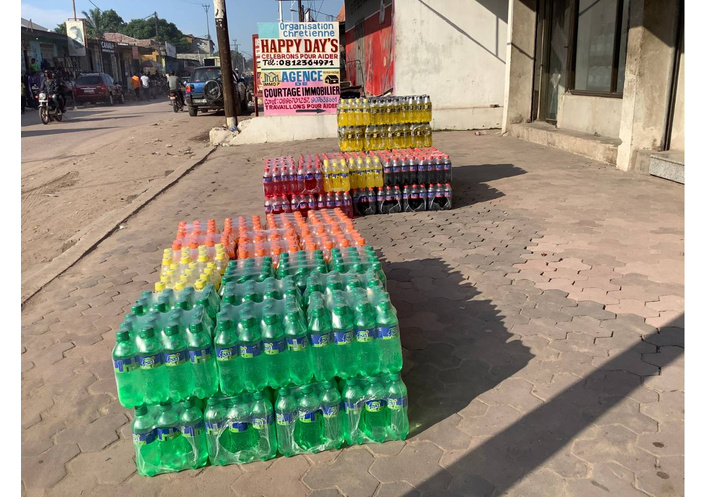
A point of sale of sweetened beverages marketed in Kinshasa, Democratic Republic of Congo. Plastic bottles of multiple brands and flavors of sweetened drinks are displayed directly on the ground in an open-air street market, exposed to direct sunlight and ambient heat.
List of sweet beverage manufacturers (codified) collected in Kinshasa, Democratic Republic of Congo (DRC), with their respective flavors.
| Codified manufacturers | Place of production | Marketing authorization | Flavors |
|---|---|---|---|
| Aa | Poids Lourd, Limete, Kinshasa | Yes | Ananas, cola, grenadine, orange |
| Bb | Not declared on the label* | Yes | Ananas, cola, grenadine, orange |
| Cc | Kingabwa, Limete, Kinshasa | Yes | Grenadine, orange |
| Dd | Kingabwa, Limete, Kinshasa | Yes | Ananas, cola, grenadine, orange |
| Ee | Industrial Limete, Limete, Kinshasa | Yes | Ananas, cola, energy, grenadine, lime, orange, tangawisi (ginger) |
| Ff | Kinkole, N’sele, Kinshasa | Yes | Cola, grenadine, mango, orange |
| Gg | Not declared on the label* | Yes | Tangawisi (ginger) |
| Hh | Not declared on the label* | Yes | Energy |
| Ii | Kingabwa, Limete, Kinshasa | Yes | Coffee, cola, grenadine, orange, tropical |
| Jj | Gombe, Kinshasa | Yes | Ananas, cola, energy, grenadine, mango, maracuja, orange, banana-flavored milk |
*: Means the production site was not declared on the product label.
Three samples of each brand-flavor sweetened drink type were stored in a dry place at room temperature and protected from moisture and light throughout the entire analysis period. Table 1 lists the codified manufacturers of sweet beverages, place of production, available flavors, and marketing authorization status. To maintain manufacturer confidentiality, all samples were codified in alphabetical order from “Aa” to “Jj”.
Prior to proceeding with physicochemical analyses, all beverage samples underwent a preliminary organoleptic inspection performed by investigators to identify obvious quality defects. No trained sensory panel, hedonic scoring, or consumer acceptability testing was performed, and the inspection included only visual assessment of package integrity, color, clarity, and the presence of sediment and other visible abnormalities, as well as the detection of any unusual odor upon opening the container [23]. This assessment allowed for sorting out samples with defects and was not conducted as a formal sensory evaluation. Figure 2 presents the sequential stages of sample analysis and quality control tests carried out on sweetened beverages in this study.
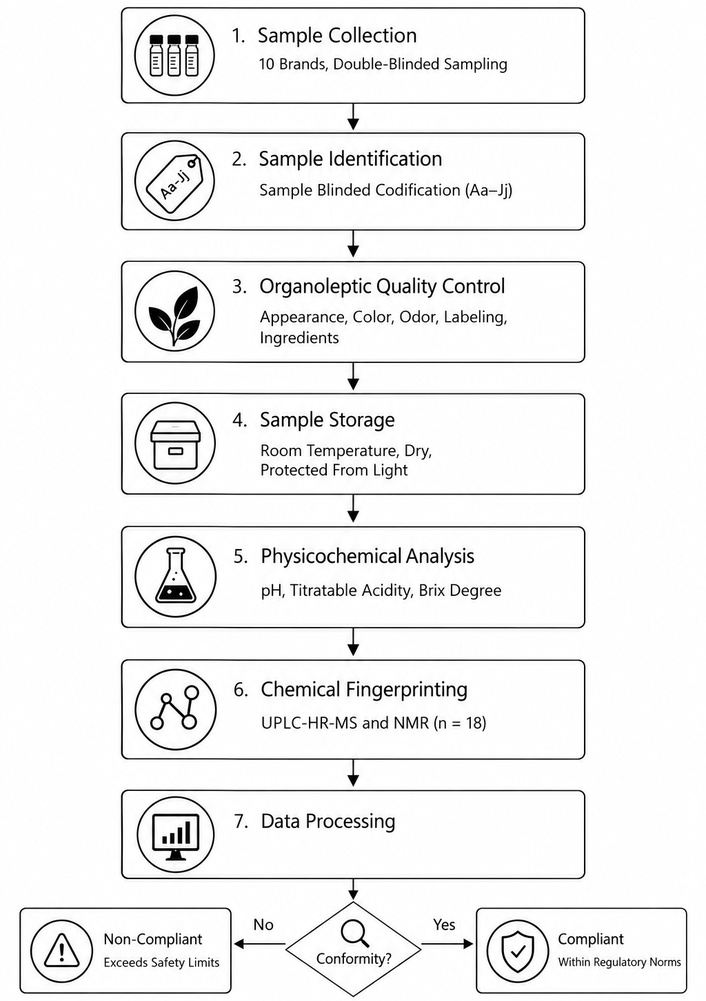
Flow diagram illustrating the sequential stages of sample collection, analysis, and quality control performed in this study. Ten brands of sweetened beverages were randomly purchased from retail outlets in Kinshasa, Democratic Republic of Congo (DRC), and assigned blinded codes (Aa–Jj). All samples underwent organoleptic and physicochemical quality control testing and were stored at room temperature under controlled conditions. Based on the physicochemical screening results, a purposive selection of samples exhibiting the most concerning quality profiles was made for subsequent chemical fingerprinting by ultra-performance liquid chromatography coupled to high-resolution mass spectrometry (UPLC-HR-MS) and NMR spectroscopy. Following data processing, the analyzed samples were classified as compliant or non-compliant.
pH was measured using an accurate electrochemical method with electrodes and a millivoltmeter (Hanna H12211pH/ORP Meter, Romania) following the procedure described by Poungam and coworkers [24]. Prior to each measurement session, the meter was calibrated using a three-point calibration with commercial pH 4.01, 7.01, and 10.01 standard buffer solutions (Hanna Instruments, Woonsocket, RI, USA), and measurements were performed at ambient temperature with automatic temperature compensation.
The total TA was measured using a method described by Tsegay [25]. A digital burette (Titrette, Brand GmbH + Co. KG, Wertheim, Germany) was used to determine the titration volume of the sweet beverage samples. Fifty milliliters of each filtered sample solution was placed in a 250 mL conical flask. First, carbon dioxide was removed by blowing air via a vacuum pump into the conical flask, with continuous shaking, for one to two minutes. Next, 10 mL of the resultant sample was poured into 30 mL of boiled distilled water containing 3 to 5 drops of phenolphthalein solution. Next, the sample solution was titrated with standardized 0.1N NaOH to the phenolphthalein endpoint. TA was expressed as citric-acid equivalents using the citric acid conversion factor of 0.64, allowing consistent comparison across all samples. Because this factor is specific to citric acid, the free-acid values reported for beverages acidified with other acids, most notably the phosphoric-acid-based cola flavors, represent an approximation and should be interpreted with caution. Sodium hydroxide (0.1 N standardized volumetric solution) and phenolphthalein indicator solution were of analytical reagent grade (Sigma-Aldrich/Merck, Darmstadt, Germany), and D-glucose used to prepare the Brix calibration standards was of analytical grade (Sigma-Aldrich, ≥ 99.5% purity).
The Brix levels of the samples were determined using a refractometer (Hanna Instruments H196801, Romania). A refractometer is an optical instrument used to measure the Brix value in fruits, vegetables, juices, jams, wines, and beers. It is a standard technique based on the measurement of the refractive index (RI) of the liquid. RI is the ratio of the speed of light in a vacuum to the speed of light in the given medium. RI depends on the wavelength of the light and the temperature of the sample liquid [26].
Eighteen samples were randomly selected from the whole sample list for analysis by UPLC-HR-MS and NMR. The 18 samples selected for UPLC-HR-MS and NMR analysis were drawn from the total pool of 120 individual samples (40 brand-flavor combinations × 3 replicates) using a stratified random sampling approach. Specifically, samples were selected to ensure representation of all 10 brands and the major flavor categories (cola, energy, grenadine, orange, and ananas), with priority given to brands exhibiting the most concerning physicochemical profiles (i.e., the lowest pH values and highest TA values) based on the results of the physicochemical screening. Where multiple replicates of the same brand-flavor combination were available, one replicate was randomly selected. The total number of 18 samples was determined by practical constraints related to instrument time and sample preparation capacity and represents approximately 45% of the 40 brand-flavor combinations analyzed in the physicochemical phase of the study.
Each crude sample was filtered through a 0.45 um cartridge filter to obtain core solutions. Then, 540 µL was transferred into a 5 mm NMR tube containing 60 uL of D2O. The remaining core solutions were further diluted with Millipore water (H2O) before injection on a UPLC-HR-MS operating in electrospray ionization mode. The NMR samples were stirred and degassed with argon before being measured on a high-resolution NMR spectrometer. The NMR measurements were carried out on a 700 MHz NMR system (Ascend, Bruker, manufactured in 2020), equipped with a 5 mm cryoprobe head and a triple-resonance X-observe (TXO), operating with a Neo console. 1D-(1H and 13C) and 2D-NMR experiments [heteronuclear single-quantum coherence spectroscopy (HSQC), heteronuclear multiple-bond correlation spectroscopy (HMBC), correlation spectroscopy (COSY), total correlation spectroscopy (TOCSY)] were performed with water suppression, as the main solvent was H2O (H2O/D2O: 9/1). For UPLC-HR-MS analysis, the 0.45 µm-filtered core solutions were diluted 1:10 (v/v) with Millipore ultrapure water prior to a 5 µL injection; no solid-phase extraction or additional clean-up step was applied. One-dimensional 1H spectra were acquired with water suppression (excitation sculpting/presaturation), 128 scans, a spectral width of approximately 20 ppm, an acquisition time of about 2 s, and a relaxation delay of about 4 s, using standard Bruker pulse sequences under TopSpin 4.1. Compound annotations from HR-ESI-MS were based on accurate-mass matching of [M + H]+/[M − H]− ions within a mass-error tolerance of ≤ 5 ppm against the PubChem and ChemSpider databases, and NMR assignments were made by comparison of 1D 13C chemical shifts and 2D correlation patterns (HSQC, HMBC, COSY, TOCSY) with published reference data and spectral libraries [Human Metabolome Database (HMDB); Spectral Database for Organic Compounds (SDBS)]. All such identifications are putative and qualitative, as they were not confirmed against authentic reference standards.
All physicochemical measurements (pH, TA, and Brix degree) were performed in triplicate (n = 3), and results are expressed as mean ± standard deviation (SD). To evaluate whether statistically significant differences existed in physicochemical parameters across flavor types and across brands, Kruskal-Wallis tests were applied, as the small sample size per group (n = 3) and the non-normal distribution of several variables precluded the use of parametric one-way ANOVA. Where the Kruskal-Wallis test indicated a significant overall difference (p < 0.05), pairwise post-hoc comparisons were performed using the Mann-Whitney U test with Bonferroni correction for multiple comparisons. Pearson’s correlation coefficients were calculated to examine relationships between physicochemical parameters. Principal component analysis (PCA) was performed on standardized data (mean-centered and unit-variance scaled) to analyze the multivariate structure of the physicochemical dataset and identify patterns of similarity among brand-flavor combinations of sweet drink samples. Given the limited number of replicates per group (n = 3), the statistical power to detect small or moderate differences was limited. Therefore, non-significant results should be interpreted with caution, as they may reflect insufficient statistical power rather than the absence of true differences. All statistical analyses were performed using Python (version 3.x) with the SciPy (version 1.x) and scikit-learn (version 1.x) libraries.
The organoleptic characteristics of the different samples are given in Tables S1–S10. A total of 40 flavor-brand combinations were analyzed for full, partial, and non-compliance for organoleptic quality control. One brand (Jj) offered the widest variety of flavors, with 8 flavors (ananas, cola, energy, grenadine, banana-flavored milk, mango, maracuja, and orange). One brand (Ee) comprised 7 flavors (ananas, cola, energy, grenadine, lime, orange, and tangawisi/ginger), and one brand (Ii) comprised 5 flavors (coffee, cola, grenadine, orange, and tropical). Four brands (Aa, Bb, Dd, and Ff) each offered 4 flavors; three of these (Aa, Bb, and Dd) shared the same flavor combination (ananas, cola, grenadine, and orange), while brand Ff offered a slightly different selection (cola, grenadine, mango, and orange). One brand (Cc) was available in 2 flavors (grenadine and orange), and two brands (Gg and Hh) were each represented by a single flavor (tangawisi/ginger and energy, respectively) (Figure 3).
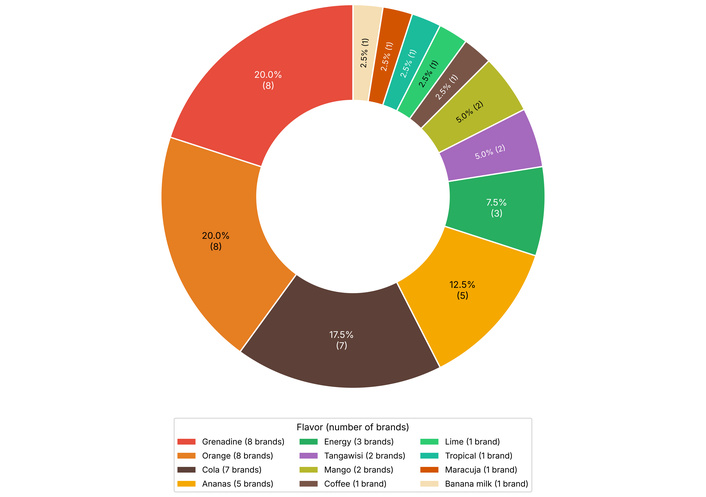
Donut chart showing the relative occurrence of each flavor type across the 10 brands of sweetened beverages sampled in Kinshasa, Democratic Republic of Congo (DRC). Each segment represents one flavor type, with the percentage indicating its proportional share of all flavor-brand combinations recorded (n = 40 total), and the absolute number of brands carrying that flavor shown in parentheses. Colors correspond to the flavor palette used consistently throughout all figures in this study.
Additionally, we found that some brands contained the required nutritional and production information as per country regulations on their bottles, such as “Ii”, “Hh”, “Gg”, “Dd”, “Cc”, and “Aa”. However, one bottle of the brand “Bb” had an illegible batch number. None of the “Ee” brand bottles had a batch number. The “Ff” brand had neither ingredient information nor batch numbers on its bottles, making it the least compliant in terms of labeling. “Jj” had all the required information on its bottles; however, some bottles had illegible expiration dates, and others were too faded to verify. Inspection of organoleptic characteristics showed that 40% of the brand samples had unsatisfactory and inadequate labeling (Figure 4). To complement this brand-level classification, individual bottles with incorrect labeling are reported in the Tables S1–S10 for per-bottle records. Of the 120 bottles inspected, we noticed a subset lacked a legible batch number and faded label information (see Tables S1–S10).
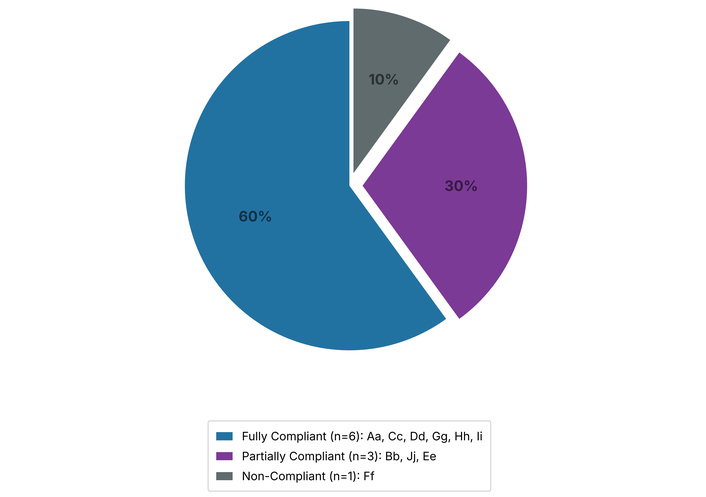
Pie chart showing the labeling compliance status of 10 brands of sweetened beverages marketed in Kinshasa, Democratic Republic of Congo (DRC). Compliance was assessed across three criteria: presence of declared ingredients, batch number, and expiry date, as recorded during sample collection (April–July). Brands were classified as fully compliant (all three criteria present and legible on all bottles; n = 6: Aa, Cc, Dd, Gg, Hh, Ii), partially compliant (one or more criteria missing or illegible on at least one bottle; n = 3: Bb, Jj, Ee), or non-compliant (one or more criteria absent on all bottles of that brand; n = 1: Ff).
The values obtained after the pH measurement are shown in Figure 5 (Table S11). All analyzed sugary drinks had highly acidic pH values, with little variation. All samples had a pH between 2.19 and 3.96, with most in the 2–3 pH range.
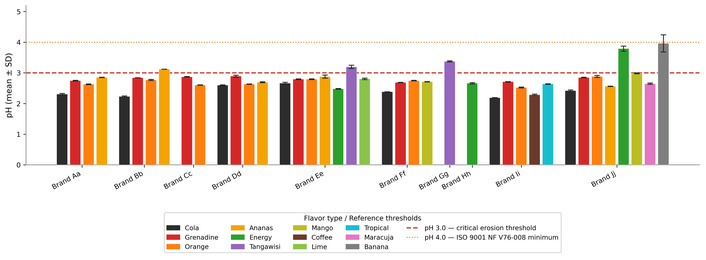
Mean pH values ± standard deviation (SD) of sweetened beverages across all 10 brands and flavor types analyzed in Kinshasa, Democratic Republic of Congo (DRC) (n = 3 replicates per brand-flavor combination). Each bar represents the mean of three independent measurements (S1, S2, S3); error bars indicate ± SD. Bars are color-coded by flavor type as indicated in the legend. The red dashed line (pH = 3.0) marks the critical threshold below which beverages are considered highly erosive to dental enamel, and the orange dotted line (pH = 4.0) indicates the minimum pH prescribed by the International Organization for Standardization (ISO) 9001 NF V76-008 standard for sweetened beverages. pH = 3.0 is the critical erosion threshold, and the ISO 9001 NF V76-008 minimum-pH reference value is adopted from published dental-erosion and beverage-quality studies [2, 27].
The volumes of NaOH used for the titration of each sample are shown in Table S12. To determine the amount of free acid (g/L) in the different samples, we multiplied the volume values of NaOH (used for the titration) by the citric acid coefficient (0.64). The values of TA obtained are shown in Figure 6 (Table S13). We noted that the TA values range from 1.792 to 5.440, with the lowest value assigned to the brand sample “Gg” tangawisi (ginger flavor) and the highest one to the “Jj” brand energy flavor. TA values varied considerably for the different flavors of the same brand. While samples with energy flavors were all found to exhibit the highest TA values, attributable to the presence of taurine, an amino sulfonic acid commonly found in energy drinks [28], the cola and tangawisi (ginger) flavors were generally among the lowest, with only the “Ff” cola and “Gg” tangawisi samples falling below 2.
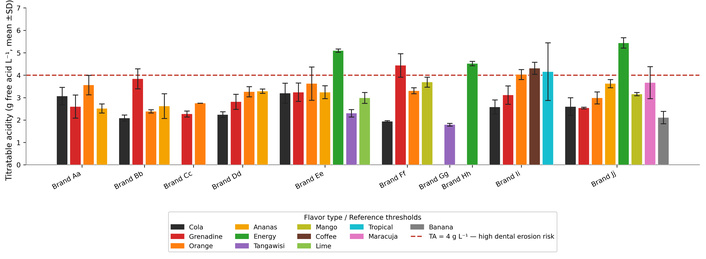
Mean titratable acidity [TA, ± standard deviation (SD)] expressed as grams of free acid per liter (g free acid L–1) across all 10 brands and flavor types (n = 3 replicates per brand-flavor combination). Each bar represents the mean of three measurements; error bars indicate ± SD. Bars are color-coded by flavor type as shown in the legend. The red dashed line (TA = 4 g free acid L–1) marks the threshold above which beverages are considered to pose a high risk of dental erosion.
The Brix degree values obtained for the control solutions prepared from glucose for analysis are given in Table S14. The °Bx values obtained are approximately equal to the quantities (in g) of glucose in 100 mL of solution. The Brix degree values obtained for the different samples are shown in Figure 7. Using the regression line equation and control solutions, we calculated corresponding amounts of sugar in 100 mL of different samples. Applying the formula to the Brix values of the samples, we obtained the amount of sugar in 100 mL of each beverage sample, as shown in Figure 8 (Table S14). Because the refractometer was calibrated with glucose standards, the reported sugar concentrations are expressed as glucose equivalents. As commercial beverages contain mixtures of sugars with slightly different refractive indices, the obtained values are presented here as estimated measurements of total sugar content.
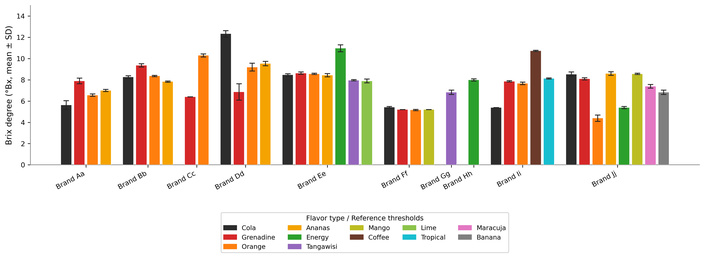
Mean Brix degree (°Bx, ± SD) of sweetened beverages across all 10 brands and flavor types (n = 3 replicates per brand-flavor combination). Each bar represents the mean of three independent measurements; error bars indicate ± SD. Bars are color-coded by flavor type as shown in the legend. The cola flavor of brand Dd recorded the highest mean Brix value (12.39 °Bx), while the orange flavor of brand Jj recorded the lowest (4.40 °Bx).
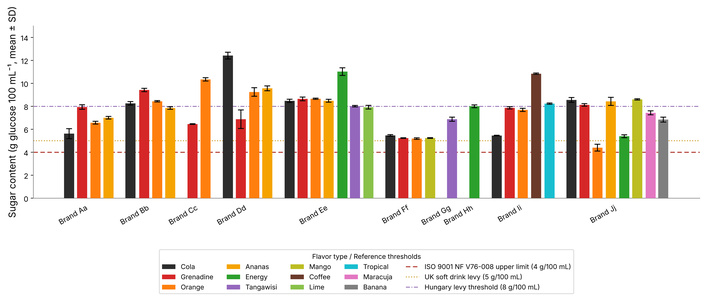
Mean sugar content [g glucose per 100 mL, ± standard deviation (SD)] of sweetened beverages across all 10 brands and flavor types (n = 3 replicates per brand-flavor combination), derived from Brix measurements using a validated regression equation with glucose control solutions. Each bar represents the mean of three independent measurements; error bars indicate ± SD. Bars are color-coded by flavor type as shown in the legend. Three regulatory reference thresholds are indicated: the red dashed line represents the upper limit prescribed by ISO 9001 NF V76-008 (4 g/100 mL); the orange dotted line represents the United Kingdom (UK) Soft Drinks Industry Levy lower threshold (5 g/100 mL); and the purple dash-dot line represents the Hungarian sugar taxation threshold (8 g/100 mL). All 40 brand-flavor combinations exceeded the ISO standard, and the majority exceeded the UK levy threshold.
As indicated in Table S15 and Figures S1–S18, paraben derivatives (butyl paraben, methyl paraben, and propyl paraben) and other substances (caffeine and D-cymarose) were identified in the samples based on their exact masses. The presence of phthalates was confirmed in most samples originating from plastic bottle containers, although at low concentrations relative to the total content. Interestingly, the phthalate with the most concerning toxicity profile, viz. bis(2-ethylhexyl) phthalate (DEHP), was not identified in any of the 18 samples analyzed by NMR and HR-ESI-MS. However, butyl cyclohexyl phthalate (BCP), dibutyl phthalate (DBP), diisobutyl phthalate (DiBP), and dimethyl phthalate (DMP) were detected in the analyzed samples. The identification of azelaic acid in several samples as a marker of oleic acid oxidative degradation may indicate that the beverages had been subjected to conditions that promote lipid peroxidation and degradation of packaging materials and alter the chemical integrity of the product [29]. Its presence in most samples could be attributable to the routine exposure of beverages to direct sunlight and elevated temperatures (Figure 1) during storage and distribution at the points of sale [30].
The pH data recorded in this study are consistent with previous studies in the literature on the pH values of carbonated sweet drinks and fruit juices [27, 31–33]. They also corroborate the results reported by Omba et al. [2], who showed that most of the marketed sweet drinks in Lubumbashi, DRC, have a pH below 4, in conformity with the acidity threshold specified by the ISO 9001 NF V76-008 standard. Interestingly, the highest pH value (3.96) was recorded for the banana-flavored milk of brand Jj, while the lowest (2.19) was that of the cola flavor of brand Ii. All cola flavors had the lowest pH values across all brands and were therefore the most acidic of all samples tested. Such low pH values, particularly those below 3, make these sweetened drinks highly erosive. They may pose a significant risk to the dental health of consumers, especially children, whose teeth are more fragile than adults’. This risk is further elevated by children’s tendency to slowly sip sweet drinks, thereby prolonging contact between the beverage and tooth surfaces, with potential consequences ranging from dental erosion to tooth decay [5, 27].
TA and pH are both key factors in determining potential dental erosion from sweet drinks, and they can be utilized to ascertain the acidic property of beverages using the simple method of Benjakul and Chuenarrom [34]. Many studies have utilized pH and TA measurements to characterize test beverages [2, 34–39]. TA measures all free hydrogen ions available, which could cause dental erosion [3]. TA has been widely accepted as a more accurate measure of the total acid content of a drink and could be a more realistic way to predict erosive potential [36]. We have generated a joint distribution of pH and TA across all brand-flavor combinations tested, which highlights the relationship between these two key indicators of erosive potential. As noted by Benjakul and Chuenarrom [34] and Cairns et al. [36], neither pH nor TA alone is sufficient to characterize the erosive potential of a beverage; both parameters must be considered together, since pH reflects the concentration of free hydrogen ions at a given moment, while TA reflects the total buffering capacity of the drink and its ability to sustain acidic conditions at the tooth surface over time [5].
As shown in Figure 9, the majority of data points cluster in the region defined by pH < 3.0 and TA between 2.0 and 4.0 g free acid L–1, confirming that most of the sweetened beverages analyzed present a substantial erosive risk. Several samples fall within the highest-risk quadrant (pH < 3.0 and TA ≥ 4.0), including the energy flavors of brands Ee and Hh, the coffee flavor of brand Ii, and the grenadine flavor of brand Ff. These beverages are of particular concern, as their combination of high acidity and high buffering capacity means that saliva is less able to neutralize their erosive effect quickly, thereby prolonging the window of demineralization at the tooth surface [39].
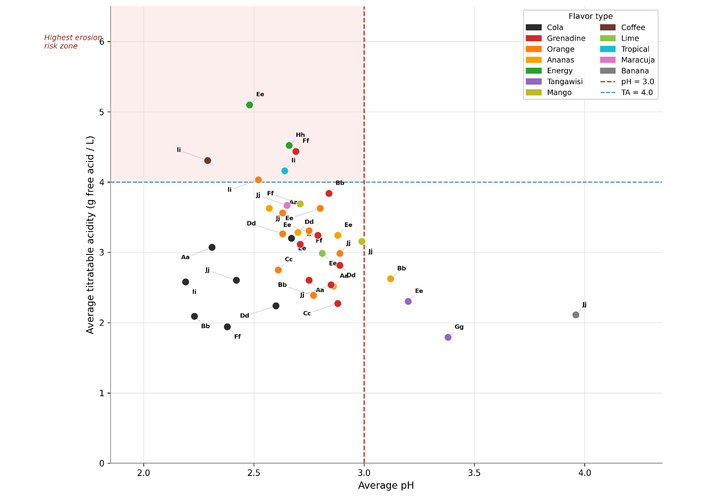
Scatter plot showing the relationship between average pH and average titratable acidity (TA, g free acid L–1) across all 40 flavor-brand combinations tested. Each data point represents the mean of three replicates (n = 3) for a given brand-flavor combination, color-coded by flavor type as indicated in the legend. The vertical red dashed line (pH = 3.0) marks the critical threshold below which beverages are considered highly erosive to dental enamel. The horizontal blue dashed line (TA = 4.0 g free acid L–1) marks the threshold above which beverages pose a high risk of dental erosion. The shaded pink quadrant (pH < 3.0 and TA ≥ 4.0) represents the zone of highest dental erosion risk.
Cola flavors are consistently positioned in the lower-left region of the plot, characterized by very low pH values (all below 2.7) but moderate TA values, reflecting the dominance of phosphoric acid as their primary acidulant. While their TA values do not place them in the highest-risk quadrant, their extremely low pH makes them among the most immediately aggressive beverages for dental enamel [27]. By contrast, energy and Coffee flavors tend toward the upper portion of the plot, with higher TA values despite relatively moderate pH, suggesting that their acid content is more heavily buffered and therefore more sustained in its erosive action. Tangawisi (Ginger) flavors stand out as notable outliers, exhibiting both relatively higher pH values (above 3.0) and the lowest TA values of all samples tested, placing them in the lower-right region of the plot and outside the high-risk zone. This likely reflects the comparatively higher pH and lower TA of these ginger-based (tangawisi) preparations relative to the fruit-flavoured and cola-type carbonated drinks, as observed in the present study. Our analysis suggests that the erosive risk posed by sweetened beverages marketed in Kinshasa is not uniform across flavor types and cannot be predicted from pH or TA in isolation. Regulatory frameworks should therefore require manufacturers to report both parameters on product labels, and public health messaging should specifically target high-risk combinations, particularly energy, coffee, cola, and highly acidic grenadine and orange flavors, which were found to pose the greatest combined threat to the dental health of consumers, especially children and adolescents [5, 40].
As shown in Figures 7 and 8, all the samples contained, on average, an amount of sugar (glucose) greater than 4 g/100 mL (4%) of the solution. The “Jj” brand orange flavor contained the lowest amount of sugar (4.40 g/100 mL), and the “Dd” brand cola flavor had the highest amount (12.39 g/100 mL). These glucose quantities generally deviated considerably between the different flavors of certain brands, although the various flavors of the “Ff” brand had fairly similar sugar concentrations. According to the ISO 9001 NF V76-008 standard, the glucose amount in sweet drinks, including fruit juices, must be between 1.5–4.0% [2]. All the samples analyzed had sugar content above the regulated standard, ranging from 4.40–12.39%. The intensity of sweet flavor is generally due to the addition of sweeteners, either natural or synthetic [41–43]. Although the present study did not analyze the presence or quantify synthetic sweeteners, ingredient label information indicated that some beverages contained artificial sweeteners. Previous studies have suggested that certain synthetic sweeteners can also pose health risks to consumers, as they are reputed to have carcinogenic risks [44–46] and may induce hypersensitivity reactions [47–49]. The large amounts of sugar found in sweetened carbonated drinks constitute a major public health concern, as excessive sugar consumption has been associated with metabolic disorders such as cardiovascular disease and type 2 diabetes [9], obesity [16, 17], and dental caries [9, 18]. To address this concern, the World Health Organization (WHO) has advocated fiscal measures, including higher taxation, to reduce sugar concentrations in sweetened beverages [50]. Several countries have adopted such measures. For example, Hungary imposes a tax on beverages with a sugar concentration of ≥ 8 g/100 mL [51], while the United Kingdom applies a levy on beverages containing ≥ 5 g/100 mL [52]. In the present study, sugar concentrations across all samples ranged from 4.40 to 12.39 g/100 mL. Clearly, all beverages tested exceeded the lower threshold of the British soft drink industry levy, and the majority would also fall within the Hungarian taxation bracket, which highlights the considerable sugar load of sweetened beverages currently available to consumers in Kinshasa, DRC, in the absence of any comparable regulatory framework.
To assess whether the observed differences in physicochemical parameters were statistically significant, Kruskal-Wallis tests were applied to compare pH, TA, Brix degree, and sugar content both across flavor types and across brands. The results in Figure 10 revealed a dissociation between the drivers of acidity and the drivers of sugar content. Flavor type was identified as the primary determinant of acidity: pH differed significantly across flavors (H = 18.28, p = 0.0056, **), and so did TA (H = 17.48, p = 0.0077, **), while neither parameter showed a significant difference across brands (p > 0.31 and p > 0.53, respectively). On the other hand, sugar content and Brix degree did not differ significantly across flavor types (H = 1.40, p = 0.9661, ns), but did differ significantly across brands (H = 16.28, p = 0.0227, *). Results of this statistical analysis suggest that the acidic character of a given beverage is primarily determined by its flavor formulation, with cola and energy flavors consistently driving the extremes of pH and TA, respectively, while sugar load is more closely associated with the manufacturing brand of sweetened drinks. Additionally, pairwise post-hoc comparisons using the Mann-Whitney U test with Bonferroni correction confirmed that cola and grenadine flavors were the only significantly different pair for pH (padj = 0.0065, **); no other pairwise comparisons survived correction, likely reflecting the conservative nature of Bonferroni adjustment in the context of small group sizes (n = 3 per brand-flavor combination).
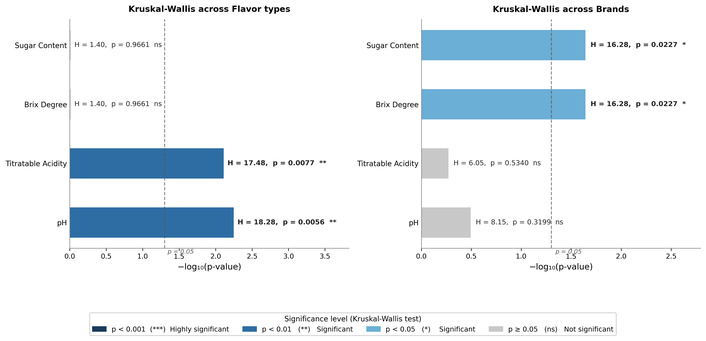
Results of Kruskal-Wallis non-parametric tests comparing physicochemical parameters across flavor types (left panel) and across brands (right panel). Bar length represents the −log10(p-value) for each parameter, with longer bars indicating stronger statistical evidence against the null hypothesis of no group difference. The vertical dashed line marks the significance threshold (p = 0.05, equivalent to −log10(0.05) ≈ 1.30). Statistical significance is indicated by bar color (dark navy: p < 0.001, ***; medium blue: p < 0.01, **; powder blue: p < 0.05, *; silver: p ≥ 0.05, ns) and annotated for each parameter with the corresponding H-statistic and exact p-value. pH and TA differed significantly across flavor types (p < 0.01) but not across brands (p > 0.31), while sugar content and Brix degree differed significantly across brands (p < 0.05) but not across flavor types (p > 0.96).
To further evaluate the multivariate structure of the physicochemical dataset obtained from analyzing 40 brand-flavor combinations of sweet drink samples, PCA was performed on the four standardized parameters. The biplot (Figure 11) showed that 77.3% of the total variance across all 40 brand-flavor combinations is captured by just two principal components. PC1 (52.3% of variance) is almost entirely driven by Brix degree and sugar content (loading = +0.68 for both), and separates samples along a low-to-high sugar axis: the cola flavor of brand Dd, which had the highest recorded sugar concentration (12.39 g/100 mL), is the most extreme outlier on the positive PC1 axis, while low-sugar samples from brand Ff and the orange flavor of brand Jj cluster on the negative PC1 side. PC2 (25.0% of variance) is dominated by TA (loading = +0.94) and separates samples along an acidity axis: the energy flavors of brands Ee, Hh, and Jj and the coffee flavor of brand Ii all project toward the upper portion of the plot, consistent with their high TA values and their clustering within the highest erosion risk zone identified in Figure 9. By contrast, tangawisi (ginger) flavors from brands Gg and Ee occupy the lower-left quadrant of the biplot, reflecting their combination of higher pH and lower TA, which reinforces their status as the least erosive flavor type among those analyzed. Specifically, pH loads weakly and nearly orthogonally to the TA axis on PC2, confirming the statistical independence of these two acidity parameters (Pearson r = − 0.18, ns) and supporting the conclusion that both the pH and TA must be reported and considered jointly when assessing the dental erosive potential of sweetened beverages. The PCA and Kruskal-Wallis results provide a robust quantitative framework that demonstrates that flavor type and manufacturing brand are two independent axes of quality variation in sweetened drinks marketed in Kinshasa, with important and potentially distinct implications for consumer health risk assessment.
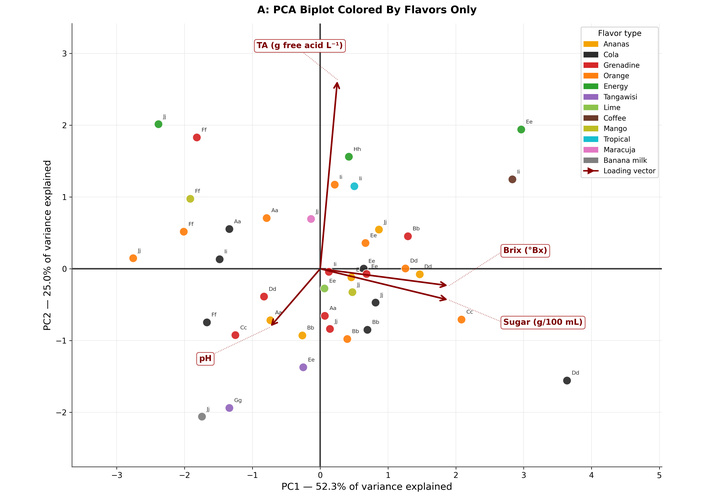
Principal component analysis (PCA) biplot of standardized physicochemical parameters [pH, titratable acidity (TA), Brix degree, and sugar content] across all 40 brand-flavor combinations. Data points are colored by flavor type and labeled with brand codes. The first two principal components (PC1: 52.3%; PC2: 25.0%) together account for 77.3% of total variance. Red arrows indicate the direction and magnitude of each variable’s contribution (loading vector) to the principal components. PC1 is dominated by Brix degree and sugar content (loadings = +0.68 each), separating high-sugar combinations (right) from low-sugar ones (left). PC2 is dominated by TA (loading = +0.94), separating high-acidity combinations (top) from low-acidity ones (bottom). pH loads weakly and independently on both components.
The presence of potentially harmful chemical contaminants, specifically phthalates, in a subset of 18 randomly selected samples suggests the absence of systematic quality control and poor monitoring of sweet beverages. The impacts of phthalates on human health range from alterations in gene expression to broad physiological changes such as reproductive disorders, metabolic dysfunction, impaired brain development, and respiratory issues [53, 54]. In the DRC, food contamination with chemicals represents a context of particular concern requiring public health surveillance, given its combination of a high-risk food supply environment and a near-total absence of systematic food safety monitoring [55]. Epidemiological studies have shown a significant association between phthalate exposure and adverse reproductive outcomes in both women and men, as well as type 2 diabetes and insulin resistance, overweight and obesity, and allergies and asthma [56, 57]. Despite their relatively short half-lives in tissues, chronic exposure to phthalates adversely influences the endocrine system and the functioning of multiple organs, with negative long-term consequences for pregnancy outcomes, child growth and development, and reproductive health in both young children and adolescents [58–60]. The consumption of sweetened beverages packaged in plastic bottles purportedly made of PET may present health risks, and the growing prevalence of plastic packaging exposed to sunlight and elevated temperatures (Figure 1) during storage, sales, and distribution could exacerbate these risks by accelerating polymer degradation and leaching potentially harmful chemicals and microplastics into the drinks [50]. Reducing the consumption of sweetened beverages packaged in plastic containers has become a priority objective for public health authorities worldwide. As of 2007, DEHP, DBP, and benzyl butyl phthalate (BBP) have been restricted in the plasticized materials of toys and childcare articles within the European Union, and diisononyl phthalate (DiNP), diisodecyl phthalate (DiDP), and di-n-octyl phthalate (DnOP) are restricted in those that can be placed in a child’s mouth. DiBP was also added to this list in 2020 [61, 62].
To conclude, this study assessed the overall quality of sweetened beverages produced in the DRC and marketed in Kinshasa. Beverage samples exhibited highly acidic pH values ranging from 2.19 to 3.96, and TA values between 1.792 and 5.440 g free acid L–1. Beverages with the lowest pH values (pH < 3) and highest TA values (TA ≥ 4) exceeded the prescribed norms and represent a significant risk factor for dental erosion. Regarding sugar content, all samples had glucose concentrations ranging from 4.40–12.39 g/100 mL, which also exceeded the standard prescribed by ISO 9001 NF V76-008. Moreover, the presence of phthalates, including BCP, DBP, DiBP, and DMP, was detected in most samples, and azelaic acid, a marker of oleic acid oxidative degradation, was identified in several samples using NMR and HR-ESI-MS. It is important to note that the detection of phthalates was purely qualitative. Compounds were identified based on exact mass matching and NMR spectral comparison, but no absolute quantification of phthalate concentrations was performed. While the presence of these compounds was confirmed, it is not possible from the present data alone to determine whether the detected concentrations exceed established regulatory thresholds and represent a quantitatively significant health risk. Future investigations should include validated quantitative methods such as LC-MS/MS with standards to determine the actual concentrations of phthalates in these beverages and enable formal risk assessment.
BBP: benzyl butyl phthalate
BCP: butyl cyclohexyl phthalate
COSY: correlation spectroscopy
DBP: dibutyl phthalate
DEHP: bis(2-ethylhexyl) phthalate
DiBP: diisobutyl phthalate
DiDP: diisodecyl phthalate
DiNP: diisononyl phthalate
DMP: dimethyl phthalate
DnOP: di-n-octyl phthalate
DRC: Democratic Republic of Congo
HMBC: heteronuclear multiple-bond correlation spectroscopy
HMDB: Human Metabolome Database
HR-ESI-MS: high-resolution electrospray ionization mass spectrometry
HSQC: heteronuclear single-quantum coherence spectroscopy
ISO: International Organization for Standardization
NMR: nuclear magnetic resonance
PCA: principal component analysis
PET: polyethylene terephthalate
RI: refractive index
SD: standard deviation
SDBS: Spectral Database for Organic Compounds
SSBs: sugar-sweetened beverages
TA: titratable acidity
TOCSY: total correlation spectroscopy
TXO: triple-resonance X-observe
UPLC-HR-MS: ultra-performance liquid chromatography coupled to high-resolution mass spectrometry
WHO: World Health Organization
The supplementary tables for this article are available at: https://www.explorationpub.com/uploads/Article/file/1010194_sup_1.pdf. The supplementary figures for this article are available at: https://www.explorationpub.com/uploads/Article/file/1010194_sup_2.pdf.
The authors thank the staff of the Centre d’Etudes des Substances Naturelles d’Origine Végétale (CESNOV), Faculty of Pharmaceutical Sciences, University of Kinshasa, for their assistance with sample collection.
IEK: Conceptualization, Methodology, Investigation, Formal analysis, Data curation, Supervision, Funding acquisition, Visualization, Writing—original draft, Writing—review & editing. GMTN: Investigation, Formal analysis, Data curation, Writing—original draft. CGK: Formal analysis, Data curation, Resources, Writing—review & editing. JMM: Resources, Writing—review & editing. DTT: Investigation, Resources, Writing—review & editing. NKN: Resources, Writing—review & editing. PMK: Conceptualization, Supervision, Project administration, Writing—review & editing. All authors read and approved the submitted version.
The authors declare that they have no conflicts of interest.
Not applicable.
Not applicable.
Not applicable.
The raw data supporting the conclusions of this manuscript will be made available by the authors, without undue reservation, to any qualified researcher.
Isaac Elaka Kaba thanks the UC Berkeley Molecular Graphics and Computation Facility (MGCF) for the computing and data analysis resources and the NIH-funded Computing Cluster-Panther-MGCF (NIH S10OD034382). The funders had no role in study design, data collection and analysis, decision to publish, or preparation of the manuscript.
© The Author(s) 2026.
Open Exploration maintains a neutral stance on jurisdictional claims in published institutional affiliations and maps. All opinions expressed in this article are the personal views of the author(s) and do not represent the stance of the editorial team or the publisher.
Copyright: © The Author(s) 2026. This is an Open Access article licensed under a Creative Commons Attribution 4.0 International License (https://creativecommons.org/licenses/by/4.0/), which permits unrestricted use, sharing, adaptation, distribution and reproduction in any medium or format, for any purpose, even commercially, as long as you give appropriate credit to the original author(s) and the source, provide a link to the Creative Commons license, and indicate if changes were made.



View: 89
Download: 16
Times Cited: 0


