 Original Article


Affiliation:
1Laboratory of Food Safety, Quality, and Applied Biotechnology, Department of Food Science & Technology, School of Agricultural Sciences, University of Patras, 30100 Agrinio, Greece

Affiliation:
1Laboratory of Food Safety, Quality, and Applied Biotechnology, Department of Food Science & Technology, School of Agricultural Sciences, University of Patras, 30100 Agrinio, Greece
ORCID: https://orcid.org/0009-0004-2465-6837
 ,
,
Affiliation:
1Laboratory of Food Safety, Quality, and Applied Biotechnology, Department of Food Science & Technology, School of Agricultural Sciences, University of Patras, 30100 Agrinio, Greece
ORCID: https://orcid.org/0009-0003-8995-6673
,
Affiliation:
1Laboratory of Food Safety, Quality, and Applied Biotechnology, Department of Food Science & Technology, School of Agricultural Sciences, University of Patras, 30100 Agrinio, Greece
Affiliation:
2Attiki Bee Culturing Co.-Alex. Pittas S.A., 14568 Athens, Greece
Affiliation:
1Laboratory of Food Safety, Quality, and Applied Biotechnology, Department of Food Science & Technology, School of Agricultural Sciences, University of Patras, 30100 Agrinio, Greece
ORCID: https://orcid.org/0000-0001-7784-6424
,
Affiliation:
1Laboratory of Food Safety, Quality, and Applied Biotechnology, Department of Food Science & Technology, School of Agricultural Sciences, University of Patras, 30100 Agrinio, Greece
ORCID: https://orcid.org/0000-0003-3729-1430
,
Affiliation:
1Laboratory of Food Safety, Quality, and Applied Biotechnology, Department of Food Science & Technology, School of Agricultural Sciences, University of Patras, 30100 Agrinio, Greece
Email: ikaraba@upatras.gr
ORCID: https://orcid.org/0000-0002-3488-2684

Explor Foods Foodomics. 2026;4:1010180 DOI: https://doi.org/10.37349/eff.2026.1010180
Received: March 27, 2026 Accepted: July 15, 2026 Published: July 29, 2026
Academic Editor: Minhaz Uddin Ahmed, Universiti Brunei Darussalam, Brunei Darussalam
Aim: In the present study, commercial heather, orange, and fir honey samples obtained from three different producers were studied using melissopalynological, physicochemical, biochemical, and antimicrobial analysis to confirm the declaration of the botanical origin of the precursor on the packing label of honey samples.
Methods: The research study aimed to characterize their botanical origin based on physicochemical parameters such as pH, moisture, electrical conductivity, ash, total sugars, vitamin C, free acidity, Pfund color, biochemical parameters such as HMF, hydrogen peroxide, total phenolic content, antioxidant activity, phenolic index, as well as the study of their antimicrobial activity against common pathogenic microorganisms such as Staphylococcus aureus, Escherichia coli O157:H7 and Salmonella Typhimurium. In addition, melissopalynological analysis was carried out.
Results: Results showed that the heather honey samples were adulterated with conifer tree honey, and only one sample was pure heather honey. In addition, the moisture content in one falsified heather honey sample was outside the regulated range, whereas the HMF content in two citrus honey samples was also outside the regulated range. Heather honey showed the highest vitamin C content (7.3 mg/100g–8.1 mg/100g), hydrogen peroxide (up to 30 mg/L), and total phenolic content (120 mg GAE/L–160 mg GAE/L). Finally, all samples showed antibacterial activity against the tested pathogens, with the higher concentration of honey (20% w/v) being the most influential.
Conclusions: The novelty of the study lies in the combination of different groups of parameters to evaluate the quality of commercial honey samples sold in the market in real market analysis research.
Honey is a food with medicinal properties, a religious symbol, and a commercial commodity of global importance [1]. It is the sweet substance produced by bees of the species Apis mellifera from the nectar of plants or from secretions of living parts of plants or secretions of plant-sucking insects found on the living parts of plants, which the bees collect, transform by mixing with special substances of their body, deposit, dehydrate, store, and preserve in the honeycombs of the hive, to mature [2].
In Greece, the rich beekeeping flora has made honey a product of particular value, with characteristic varieties such as thyme, pine, fir, heather, and orange honey, which stand out internationally for their quality and distinctive organoleptic characteristics [3]. The differentiation of honey according to its botanical origin is the subject of continuous scientific research, as it is linked to authenticity, its commercial value, and the assurance of quality. The official method, however, remains melissopalynology, which in some cases has some drawbacks, such as time of analysis, experienced analysts to identify the pollen morphology correctly, and the cases of under-represented pollen in some types of honey, such as citrus [4]. Previous studies have shown that in conjunction with melissopalynology or sensory analysis, physicochemical parameters such as moisture, pH, electrical conductivity, and inorganic content, as well as bioactive compounds such as phenolics and organic acids, minerals, volatile compounds, or sensory data differ significantly between honey varieties [3–7].
Furthermore, the antioxidant and antimicrobial activity of honey have also been correlated with its chemical composition, reinforcing the interest in its characterization as a functional food. This action is attributed to a complex combination of physicochemical properties (i.e., acidic pH, high concentration of sugars) and bioactive molecules (i.e., gluconic acid, hydrogen peroxide, methylglyoxal, caffeic acid, quercetin, catechin, and apigenin, antimicrobial proteins and peptides, such as bee defensin-1) which make honey particularly resistant against pathogenic microorganisms such as Escherichia coli, Salmonella spp., and Staphylococcus aureus [8–10].
The antimicrobial effect of honey has been confirmed in previous studies against bacteria and fungi. Pathogens such as Staphylococcus aureus, Pseudomonas aeruginosa, and Candida albicans are sensitive to exposure to honey. This effect is not uniform but varies depending on the botanical and geographical origin of the honey, which explains why varieties such as thyme, heather, or other nectar honey varieties show enhanced effectiveness [11, 12]; however, there is scarce data regarding the antimicrobial activity of certain types of Greek honey [13].
On the other hand, the falsification of the botanical or geographical origin of honey happens very often nowadays, leading to adulteration scandals and cheating of the consumers [14]. Among the most common adulteration practices is the false claim of the botanical origin of honey and its adulteration with cheap sugars. The frequently used technique to verify the adulteration of honey with derived syrups from C4 plants (i.e., sugarcane, corn, etc.) is isotopic analysis. This technique is based on the fact that C3 plants (i.e., beet, rice, wheat, etc.) use different photosynthetic pathways than C4 plants mentioned previously, to produce sugars with distinct δ13C isotopic values, which can be measured in honey and its protein fraction [15].
Despite the rich international bibliography, the field still presents gaps, especially regarding the comprehensive comparison of Greek honey varieties or commercially available honey samples with the systematic use of melissopalynological, physicochemical, and biochemical analyses, in combination with chemometric tools [7].
Considering the above, and the available consumables/samples for analysis, the present study aimed to characterize the quality and purity of commercially available honey samples claimed as heather, orange, and fir based on melissopalynological, physicochemical, biochemical, and antimicrobial analyses. To date, limited studies address the real market analysis of representative commercial honey samples, this comprising an alternative hypothesis to the current literature.
Commercial honey samples were purchased from beekeepers in semi-covered glass containers during 2023 and 2024. In total, nine samples consisting of 3 heather, 3 citrus, and 3 fir honeys, as declared on the package, were collected. Heather honey samples originated from Portes (Achaia), Volos (Thessaly), and Evia. Similarly, orange honeys originated from Argos (Peloponnese). Finally, the fir honey samples originated from Erimanthos (Peloponnese), Agrafa (Central Greece), and Panachaiko (Peloponnese). Samples were shipped to the laboratory, stored at room temperature (20 ± 2°C) in a dark place, and analyses began immediately within 24 h.
Absolute ethanol (100% purity) (CH3CH2OH) and phenolphthalein indicator (C20H10O4) were supplied by Merck (Darmstadt, Germany). Sodium carbonate (Na2CO3) and sodium acetate buffer (CH3COONa·3H2O) were supplied from Penta (Prague, Czech Republic). Sodium hydroxide (NaOH) was supplied by Lach-Ner (Zagreb, Croatia). Iodine (I2) was supplied by Riedel-de Haën (Germany). Potassium iodide (KI), potassium hexacyanoferrate (II) (K4Fe(CN)6·3H2O) (Carrez solution I), and zinc sulfate heptahydrate (ZnSO4·7H2O) (Carrez solution II) were purchased from Merck. Starch (from potatoes) was purchased from RDH GmbH & Co (Seelze, Germany). Gallic acid (3,4,5-trihydrobenzoic acid) 99% isolated from Rhus chinensis Mill. was purchased from JNK Tech. Co. (Republic of Korea). The stable free radical 2,2-diphenyl-1-picryl-hydrazyl was supplied by Tokyo Chemical Industry-TCI (Tokyo, Japan). Folin-Ciocalteu reagent was supplied by Sigma-Aldrich (Darmstadt, Germany).
To ensure that the packaging label of honey samples included the correct botanical origin, melissopalynological analysis was carried out according to von der Ohe et al. [4]. More specifically, 10 g of each honey sample was diluted in 20 mL of distilled water and centrifuged at 700× g-force for 10 min. The sediment was dried at 40°C and mounted with Entellan Rapid (Merck, 1.07961.0500) mounting medium for microscopical analysis. The honeydew elements and pollen grains were counted and identified in 20 optical areas at 200× magnification using an OLYMPUS BX 40 light microscope.
The moisture and sugar content of honey was measured using a portable refractometer (ATC, Bellingham+ Stanley, UK). First, the spectrometer prism was carefully cleaned with distilled water and absorbent paper. Then 0.2 g of honey was placed on the surface of the prism to completely cover the surface. The instrument was placed towards the light, and the indication of the dividing line (blue in color) is recorded in degrees Brix (°Bx), which corresponds to the percentage of soluble solids (i.e., sugars) and moisture. After each measurement, the prism was cleaned. Sugars and moisture were expressed as g/100g. Reported results are the average ± standard deviation of three replicates.
For pH, 10 g of each honey sample was weighed using a balance. Then, 90 mL of distilled water was added, and the solution was stirred until complete homogenization. The pH measurement was performed using a pH meter (pHEP+, HANNA Instruments, HI9808, Greece), the electrode of which was immersed in the honey solution until the reading stabilized. The results were expressed as the average ± standard deviation of three replicates.
To determine the free acids in honey, a titration was performed with 0.1N NaOH. 10 g of honey was weighed and dissolved in 75 mL of distilled water in a conical flask, stirring until the sample was completely homogenized. Then, 100 μL of phenolphthalein was added as an indicator, and the solution was placed under a burette containing the NaOH solution. The titration was performed with continuous stirring until a pale pink color appeared, which remained stable for a few seconds, indicating the end point of the reaction. The volume of NaOH used was recorded, and the free acid content was calculated in meq/kg of honey according to the equation:
where V is the volume of NaOH in mL, N is the normality of the solution (0.1 N), and m is the mass of the sample. The results were expressed as the average ± standard deviation of three replicates.
For the measurement of electrical conductivity, a calibrated Handylab LF1 conductivity meter (SI Analytics, Myanmar) with potassium chloride was used. Honey was dissolved in distilled water at a ratio of 20% (w/v). The solution was homogenized at 20°C, and then, with the help of the conductivity meter, the results of electrical conductivity (μS/cm) were recorded.
Using the results of the electrical conductivity (transformed to mS/cm), the ash was also calculated based on the following equation:
where C is the electrical conductivity, and A is the ash [16].
To assess the color of honey, spectrophotometric analysis was performed according to the Pfund method. More specifically, 5 g of honey was weighed and transferred to a 50 mL beaker. Then, 5 mL of distilled water was added to obtain a 50% (w/v) solution. The mixture was placed in a heating bath at 50°C for approximately 5 min to achieve complete homogenization. The spectrophotometer (SHIMADZU UV/VIS, UV-1280, Kyoto, Japan) was set to a wavelength of 635 nm, with distilled water as a blank sample. Then, the honey sample was transferred to a 10 mm cuvette, and absorbance measurements were performed. The Pfund scale value was obtained from the equation [17]:
where Abs is the absorbance at 635 nm.
HMF was determined according to the method given in detail in the International Honey Commission methods [18]. Absorbance measurements were carried out using a Hitachi U-2001 UV-VIS (Triad Scientific Inc., New Jersey, USA) double-beam spectrophotometer at 284 nm and 336 nm. The sodium bisulfite solution (0.2% v/v) served as the reference solution for HMF determination. The HMF results were expressed as milligrams per kilogram of honey and are the average ± standard deviation of three replicates.
For the determination of vitamin C, 10 g of the honey sample was weighed and dissolved in 100 mL of distilled water in a beaker. The solution was stirred until completely dissolved. The sample was filtered, if necessary, to remove insoluble impurities. After the sample preparation was complete, 20 mL of the sample was pipetted into a 250 mL conical flask. Then, 150 mL of distilled water and 1 mL of starch indicator (0.5% w/w) were added, while the burette was filled with the iodine solution. The titration was performed by gradually adding iodine (0.005 mol·L−1), under continuous stirring, until a permanent blue/black color appeared that did not disappear after stirring. The results were expressed as mg of vitamin C per 100 g of honey [19]. Reported results are the average ± standard deviation of three replicates.
To measure hydrogen peroxide (H2O2), 10 g of the honey sample was weighed accurately and transferred to a beaker. Then, 100 mL of distilled water (ratio 1:10 w/v) was added, and the solution was stirred until complete homogenization was achieved. In case of suspended particles or turbidity, the solution was filtered or centrifuged to obtain a clear supernatant. This solution was used for measurement. A strip was taken from the peroxide test strip container (MQuant Peroxid-Test, Supelco, Germany), and the tube was stored closed again, protected from light and moisture. The active area of the strip was immersed in the prepared solution for 1 second and then removed. After 5 seconds, the developed color of the strip was compared with the manufacturer’s color scale, and the reading in mg/L of peroxide (H2O2) was recorded. Three repetitions were performed for each sample, and the average ± standard deviation of the values was recorded.
To determine the phenolic index, we developed a methodology in the laboratory. Approximately 1 g of the honey sample was diluted with 10 mL of distilled water. Using a pipette, 1 mL was taken and centrifuged for 5 min at 1,250× g-force. Then it was filtered and transferred to a volumetric flask, where distilled water was added up to the 100 mL mark. The spectrophotometer was set to a wavelength of 280 nm, and the absorbance values were measured. The phenolic index was calculated from the equation:
where OD is the spectrophotometer reading (absorbance), and the sample dilution is 100. Reported results are the average ± standard deviation of three replicates.
For the determination of total phenolic compounds in honey, the Folin-Ciocalteu method was used. A honey solution was prepared by dissolving 1 g of honey in 10 mL of distilled water in order to achieve complete homogenization. Then, 0.20 mL of this solution was transferred to a 50 mL Falcon tube. Afterward, 2.50 mL of distilled water and 0.25 mL of Folin-Ciocalteu reagent were added by shaking gently. After 3 min, 0.50 mL of saturated Na2CO3 solution (30% w/v) and distilled water were added to a final volume of 5 mL. The solution was placed in a dark environment for 2 h, so that the blue color development was complete. The absorbance was measured at 760 nm using distilled water as a blank. To calculate the total phenolic compounds, a calibration curve was constructed with standard solutions (mg/L) of gallic acid. The results were expressed as mg gallic acid equivalents per liter of honey (mg GAE/L) according to the equation previously prepared by Karabagias et al. [20]:
Reported results are the average ± standard deviation of three replicates.
To measure the antioxidant activity, 1 mL of sodium acetate (100 mM) and 2 mL of DPPH (40 mg/L) were placed in a cuvette, and the initial absorbance was recorded. In another cuvette, 100 μL of honey solution (0.12 g/mL), 1 mL of the sodium acetate solution, and 1.9 mL of the DPPH were placed. The spectrophotometer was set to a wavelength of 517 nm, while the cuvettes were covered with aluminum foil and placed for 30 min in a dark place. Absorbance measurements were taken every 30 minutes until constant values were obtained (4 h) [19]. The calculation of antioxidant activity was done by using the equation:
where A0 = the initial absorbance of the DPPH solution, and At is the absorbance measured after reaction of the antioxidant compounds of honey with the DPPH. Reported results are the average ± standard deviation of three replicates.
The antimicrobial activity of honey against three microorganisms, Escherichia coli O157:H7 (NCTC 12900), Staphylococcus aureus (NCTC 6571), and Salmonella enterica subspecies serovar Typhimurium (NCTC 12023), was tested. The honey extracts used had a concentration of 10% and 20% (w/v). To study the antimicrobial activity of honey, stock strains (100 μL) were subcultured in Trypticasein Soy Broth (TSB) and incubated at 37°C for 18 to 24 h. After incubation, a nutrient medium was prepared. Approximately 9 g of TSB, 9 g of agar, and 300 mL of distilled water were added to a 500 mL glass bottle (Shimax) and stirred until the solid materials were completely dissolved, before being placed for sterilization. Three different nutrient media were prepared, one for each microorganism to be studied. After sterilization, 1% of the produced subcultures were added and placed on plates. Once the nutrient medium was stabilized, 3 punctures were made at the central point of the plate, where the honey extracts were placed (100 μL) and left to stand for 24 h. The inhibition zone diameter was measured using a vernier caliper with 0.1 mm accuracy. Reported results are the average ± standard deviation of three replicates.
One-way analysis of variance (ANOVA) was implemented to investigate any statistically significant (p < 0.05) differences among the average values of the determined parameters, in relation to the botanical origin of honey. The botanical origin of honey was considered as the group factor variable, whereas the determined parameters were considered as the independent variable. A multiple comparison test (post-hoc analysis) was also carried out to indicate any statistically significant (p < 0.05) differences between each different honey type in relation to the determined parameters, according to Tukey’s honestly significant difference (HSD). Correlation analysis was done using Pearson’s bivariate statistics (r) to find negative or positive correlations (–1 ≤ r ≤ +1) at the confidence level p < 0.05 between selected parameters. Statistical analysis was done using the SPSS (Statistical Package for the Social Sciences) statistics software, version 28.0 (SPSS, IBM Inc., 2021, Armonk, USA).
Table 1 shows the analytical data of the melissopalynological analysis. The analysis of the heather honey samples revealed significant differences in their botanical composition. Sample 3 contained Erica sp. pollen grains at a rate of 38%, lower than the 45% threshold required to characterize a honey as heather honey [4]. The presence of Trifolium sp. at 24% and Brassicaceae at 13% indicates a mixed origin, probably from a combination of flower honeys and honeydew. Sample 2 showed a high percentage of Erica sp. pollen, at 66%, confirming its authenticity as heather honey. Sample 1 presented a different pollen spectrum, as no heather pollen was identified, but mainly pollen grains from Trifolium sp., Rhamnaceae, and Castanea sativa. This profile refers to coniferous honey or a mixture of honeydew, which shows a discrepancy with the product labeling as ‘heather honey’. Therefore, the pollen spectrum excludes its classification as heather honey.
Melissopalynological analysis results of the commercial honey samples studied.
| Honey sample | Predominant pollen (> 45%) | Secondary pollen (16–45%) | Important minor pollen (3–15%) | Minor pollen (< 3%) | Isolated pollen | Remarks |
|---|---|---|---|---|---|---|
| Heather sample 1 | None | Trifolium sp. (27%), Rhamnaceae (22%), Smilax sp. (18%), Castanea sativa (17%) | Boraginaceae (4%), Umbelliferae (3%), Liliaceae (3%), Robinia sp. (3%) | Arbutus unedo, Asteraceae | Quercus ilex, Cistaceae, Ephedra, Phlomis fruticosa, Asphodelus sp., Scrophulariaceae, Tribulus sp. | This coniferous honey does not contain any heather as stated on the label. |
| Heather sample 2 | Erica sp., Ericaceae (66%) | Trifolium sp. (16%) | Rhamnaceae (6%), Brassicaceae (5%), Umbelliferae (3%) | Boraginaceae, Compositae | Quercus ilex, Cistaceae, Arbutus unedo, Hypericum sp., Convolvulus arvensis, Polygonum aviculare, Liliaceae, Rubus, Genista sp. | This is heather honey. |
| Heather sample 3 | Erica sp., Ericaceae (38%) | Trifolium sp. (24%) | Brassicaceae (13%), Liliaceae (13%), Rhamnaceae (5%), Umbelliferae (3%) | Boraginaceae, Asteraceae, Myrtaceae | Quercus ilex, Cistaceae, Arbutus unedo, Hypericum sp., Convolvulus arvensis, Genista sp. | It is a mixture of heather and conifer honey. To be classified as heather honey, the percentage of heather pollen grains must be ≥ 45% [4]. The honey is also sour, and the moisture content was measured higher than 19%, which is very high for Greek honey. |
| Orange sample 1 | Trifolium sp. (50%) | Brassicaceae (16%) | Rubus (7%), Erica sp., (7%), Boraginaceae (6%), Hedera helix (5%), Asteraceae (5%), citrus (3%) | None | Quercus ilex, Cistaceae, Olea europaea, Liliaceae, Umbelliferae, Hypericum sp., Verbascum sp. | This is orange honey. HMF is higher than the regulated levels. |
| Orange sample 2 | None | Brassicaceae (25%), Trifolium sp. (18%) | Hedera helix (9%), Liliaceae (8%), Pyrus/Prunus (7%), Rubus (7%), Umbelliferae (6%), Boraginaceae (6%), Asteraceae (6%), citrus (3%), Phlomis fruticosa (3%) | Erica sp. | Cistaceae, Olea europaea, Hypericum sp. | This is orange honey. HMF is higher than the regulated levels. |
| Orange sample 3 | None | Brassicaceae (32%), Trifolium sp. (29%) | Erica sp. (15%), Boraginaceae (8%), Liliaceae (5%), citrus (3%), Asteraceae (3%), Pyrus/Prunus (3%) | Phlomis fruticosa | Umbelliferae, Cistaceae, Olea europaea, Hypericum sp., Arbutus unedo | This is orange honey. |
| Fir sample 1 | Castanea sativa (60%) | Erica sp., Ericaceae (19%) | Rhamnaceae (8%), Brassicaceae (5%), Trifolium sp. (3%), Asteraceae (3%) | Pyrus/Prunus, Boraginaceae | Quercus ilex, Cistaceae, Verbascum sp., Hypericum sp. | This is fir honey. |
| Fir sample 2 | Castanea sativa (79%) | None | Rhamnaceae (8%), Brassicaceae (5%), Trifolium sp. (3%) | Asteraceae, Erica sp., Asteraceae Boraginaceae, Vicia sp., Boraginaceae | Quercus ilex, Cistaceae, Hypericum sp., Salix sp., Umbelliferae, Verbascum sp., Arbutus unedo, Convolvulus arvensis | This is fir honey. |
| Fir sample 3 | Castanea sativa (60%) | None | Erica sp., Ericaceae (15%), Trifolium sp. (15%), Brassicaceae (6%) | Asteraceae, Erica sp., Asteraceae Boraginaceae, Vicia sp., Genista sp., Pyrus/Prunus, Compositae, Umbelliferae, Vicia sp. | Quercus ilex, Cistaceae, Hypericum sp., Brassicaceae, Boraginaceae, Salix sp., Umbelliferae, Verbascum sp., Arbutus unedo, Convolvulus arvensis | This is fir honey. |
Sample 1 presented pollen grains of Trifolium sp. at 50%, as the dominant pollen, and of Brassicaceae at 16% as secondary, and with a citrus pollen grain percentage of 3%. Even in a low proportion of orange pollen grains, it reinforces the characterization of the sample as orange blossom [4]. Sample 3 did not present a dominant pollen, with the families Brassicaceae at 32% and Trifolium sp. at 29% being the main species. The presence of citrus at 3% indicates that the honey comes from orange blossoms. Finally, sample 2 showed pollen grains of Brassicaceae at 25% and of Trifolium sp. at 18% as the main groups, while citrus pollen accounted for 3%. This was also classified as orange blossom honey.
Sample 3 presented 60% pollen grains of Castanea sativa and 15% of Erica sp. Sample 2 presented the highest percentage of Castanea sativa at 79%. Its composition shows high purity and limited contamination from flowering plants. Sample 1 contained 60% Castanea sativa and 19% Erica sp., The presence of a smaller amount of heather pollen is expected, as the two species often coexist in mountainous collection areas, while the dominance of Castanea sativa is consistent with the identification of the product as Greek fir honey [3].
The pH values of the honey samples ranged from 3.7 to 5.4, indicating the natural acidity of the product (Table 2). In the heather samples, values such as 4.2, 5.4, and 4.8 were observed, with the heather 2 sample showing a slightly higher pH. This differentiation can be attributed to the geographical origin and the different content of organic acids and trace elements. The orange samples showed a more acidic character, with almost constant values around 3.6 to 3.7, as flower honeys are characterized by a lower pH. On the contrary, the fir samples showed the highest values, namely 4.6 to 5.2, characteristic of honeydews, which contain lower concentrations of organic acids.
Physicochemical parameters of commercial honeys according to the product’s label.
| Botanical origin | Soluble solids (°Brix) | Moisture (g/100g) | pH | Free acidity (meq/kg) | EC (μS/cm) | Ash (g/100g) | HMF (mg/kg) | Pfund (mm) | Vitamin C (mg/100g) |
|---|---|---|---|---|---|---|---|---|---|
| Heather (n = 3) | 82.5 ± 0.5a | 17 ± 2a | 4.8 ± 0.6a | 30 ± 10a | 1,100 ± 200a | 0.5 ± 0.1a | 9 ± 1a | 160 ± 40a | 7.7 ± 0.4a |
| Orange (n = 3) | 82 ± 2a | 16 ± 2a | 3.7 ± 0.0b | 19 ± 1a | 280 ± 20b | 0.1 ± 0.0b | 42 ± 4b | 21 ± 0b | 5.0 ± 1.0b |
| Fir (n = 3) | 82 ± 3a | 16 ± 3a | 4.9 ± 0.3a | 35 ± 6a | 1,154 ± 65a | 0.6 ± 0.0a | 11 ± 2a | 60 ± 20b | 7.2 ± 0.6a |
| F | 0.185 | 0.230 | 10.280 | 5.010 | 41.542 | 44.110 | 158.640 | 25.267 | 11.977 |
| p | 0.836 | 0.801 | 0.012 | 0.053 | < 0.001 | < 0.001 | < 0.001 | < 0.001 | 0.008 |
n: number of commercial honey samples. Different letters in each column indicate statistically significant differences at the confidence level p < 0.05 according to Tukey’s honestly significant difference (HSD) test. ANOVA to compare the average values of each parameter by the botanical origin of honey. F: F-statistic; p: probability.
The moisture content ranged between 13% and 19%, while the sugars (°Brix) showed values from 79 to 85%. In heather honey, the moisture ranged from 15% to 19%, with sample heather 1 having the highest value. The sugars ranged inversely with the samples. Heather 2 and 3 show higher values, namely 82.5 to 83 °Brix. In the orange samples, the moisture was similar, with values from 14 to 18%, while the sugars in two samples were high, with values of 82 to 84 °Brix. Fir honey exhibited the lowest moisture content, with values ranging from 13 to 19%, and at the same time a high concentration of sugars ranging from 79 to 85 °Brix.
The free acidity values ranged from 18 meq/kg to 41 meq/kg. Fir honey showed the numerically highest mean free acidity, although the difference among groups was not statistically significant. Free acidity is related to the biochemical activity of enzymes and the increased percentage of organic acids, which come from the natural fermentation of sugars. In contrast, orange honeys had the lowest acidity, with values from 18 to 20 meq/kg, a characteristic of flower honeys, which have a milder taste. The fir samples showed intermediate values, ranging from 29 to 41 meq/kg, indicative of their stability and high quality.
Conductivity ranged from 260 to 1,300 μS/cm, with higher values in heather and fir honeys, indicating a higher content of inorganic ions and ash, which was estimated at values from 0.4 to 0.6%. Orange honey, as a typical flower honey, presented much lower values from 0 to 0.1%, which confirms its classification.
The heather-labelled honey samples had HMF values within the regulated levels. The HMF values ranged between 8 mg/kg (sample 3) and 10 mg/kg (sample 1). On the other hand, orange blossom honey samples had higher values than the regulated levels, particularly sample 1 (HMF of 42 mg/kg) and sample 2 (HMF value of 47 mg/kg). Finally, the fir honey samples had low HMF values, confirming the excellent quality and absence of thermal deterioration, aging, or exposure to high temperature. The HMF ranged between 9 mg/kg (sample 3) and 12 mg/kg (sample 2).
Pfund values ranged from 21 to 200 mm, indicating a wide range of color. Heather honey presented the darkest color, ranging from 120 to 200 mm, indicating an increased content of minerals and phenolic compounds. Fir honey ranged from 40 to 80 mm, while orange honey was the lightest, with values of 21 mm.
Vitamin C content was measured between 4 and 8.1 mg/100g. Heather samples showed the highest values, ranging from 7.3 to 8.1 mg/100g. In contrast, orange honeys showed the lowest concentrations, with values ranging from 4.0 to 6.0 mg/100g. Fir samples also showed high values between 6.6 and 7.8 mg/100g.
Antioxidant capacity is directly correlated with phenolic compounds (Table 3). Fir honey showed the highest values, ranging from 24 to 34%, followed by heather with values from 23 to 33%, and orange with values from 11 to 19%.
Biochemical parameters of commercial honeys according to the product’s label.
| Botanical origin | AA (%) | TPC (mg/L) | Phenolic index | H2O2 (mg/L) |
|---|---|---|---|---|
| Heather (n = 3) | 28 ± 5a | 140 ± 20a | 50 ± 1a | 27 ± 6a |
| Orange (n = 3) | 15 ± 4b | 57 ± 5b | 19 ± 2b | 2 ± 1b |
| Fir (n = 3) | 29 ± 5a | 123 ± 19a | 27 ± 2c | 20 ± 0a |
| F | 7.622 | 25.342 | 326.908 | 44.802 |
| p | 0.023 | < 0.001 | < 0.001 | < 0.001 |
n: number of commercial honey samples. Different letters in each column indicate statistically significant differences at the confidence level p < 0.05 according to Tukey’s honestly significant difference (HSD) test. ANOVA to compare the average values of each parameter by the botanical origin of honey. AA: antioxidant activity; TPC: total phenolic content; F: F-statistic; p: probability.
Phenolic components are an important class of natural antioxidant compounds in honey, which contribute significantly to both its biological value and to the differentiation of varieties.
The determination of phenolic index is based on the strong absorption of the benzene rings of phenolic compounds in ultraviolet light, the maximum of which is observed around 280 nm [6]. It measures the absorbance of flavonoid phenols (anthocyanins, tannins), non-flavonoids (phenolic acids), and some non-phenolic substances that absorb at 280 nm. The phenolic index is a quick and easy method and gives repeatable results. A disadvantage of the method is the fact that some compounds, such as cinnamic acids and chalcones, do not show maximum absorption at 280 nm. This error is considered small since the content of the above substances in honey is typically low.
The values of total phenolic compounds in the samples ranged from 52 to 160 mg GAE/L, while the phenolic index ranged from 17 to 51, indicating significant differences between varieties and individual samples. The heather samples presented the highest phenolic values, from 120 to 160 mg GAE/L, and a phenolic index with values ranging from 49 to 51. The heather 2 sample showed the highest concentration of phenolic compounds, probably due to differences in botanical origin, nectar composition, and environmental collection conditions.
In contrast, orange honey samples showed the lowest phenolic values, ranging from 52 to 62 mg GAE/L and a phenolic index, with values from 17 to 21. Fir honey samples showed intermediate values from 104 to 142 mg GAE/L, while the phenolic index ranged from 25 to 29.
The hydrogen peroxide content varied greatly between the different honey varieties. Before going any further, it is important to stress that there are scarce data regarding hydrogen peroxide values of Greek orange honey [21], while heather and fir honey originated in Greece have never been measured before. Heather and fir honey showed values up to 30 mg/L, while orange honey showed only 1 to 2 mg/L. The strong presence of peroxide in dark-colored honeys is due to the favored activity of the enzyme β-glucosidase, which converts glucose into gluconic acid and H2O2.
Modern research has highlighted the ability of honey to act synergistically with antibiotics, increasing the sensitivity of microorganisms and reducing the risk of developing resistance. This property makes honey a promising food in the treatment of infections, especially in an era when antimicrobial resistance is a global public health problem. In summary, the microbiological capacity of honey is not the result of a single mechanism, but a combination of physicochemical parameters, enzymatic activity, and bioactive compounds. This multifactorial character makes it extremely resistant to microbial growth and gives it great value in both nutrition and pharmaceutical practice.
The antimicrobial activity of honey was evaluated against the microorganisms Staphylococcus aureus, Escherichia coli, and Salmonella Typhimurium, using concentrations of 10% and 20% (w/v) (Table 4). The results show that all three varieties exhibited slight numerical differences in antimicrobial activity, depending on the concentration and type of honey.
Antibacterial activity of commercial honeys according to the product’s label.
| Botanical origin | Staphylococcus aureusInhibition zone (mm) | Escherichia coli O157:H7Inhibition zone (mm) | Salmonella TyphimuriumInhibition zone (mm) | |||
|---|---|---|---|---|---|---|
| 10% (w/v) | 20% (w/v) | 10% (w/v) | 20% (w/v) | 10% (w/v) | 20% (w/v) | |
| Heather (n = 3) | 0.6 ± 0.4a | 1.2 ± 0.4a | 9.0 ±1.0a | 13 ± 2.0a | 8.0 ± 1.0a | 9.0 ± 1.0a |
| Orange (n = 3) | 0.3 ± 0.1a | 1.2 ± 0.1a | 9.2 ± 0.6a | 13 ± 2.0a | 7.5 ± 0.5a | 9.3 ± 0.7a |
| Fir (n = 3) | 0.7 ± 0.3a | 1.3 ± 0.3a | 9.2 ± 0.4a | 12 ± 2.0a | 8.1 ± 0.1a | 9.8 ± 0.6a |
| F | 0.625 | 0.105 | 0.114 | 0.006 | 1.574 | 0.714 |
| p | 0.567 | 0.902 | 0.894 | 0.994 | 0.282 | 0.527 |
n: number of commercial honey samples. Different letters in each column indicate statistically significant differences at the confidence level p < 0.05 according to Tukey’s honestly significant difference (HSD) test. ANOVA to compare the average values of each parameter by the botanical origin of honey. F: F-statistic; p: probability.
For Staphylococcus aureus, a clear growth inhibition was observed in all varieties (Figure 1). Orange honey had the lowest antimicrobial activity, especially at 10% (w/v) concentration, whereas in the case of 20% (w/v) concentration, fir honey samples showed the highest antimicrobial activity, demonstrating the effectiveness of fir honey against Gram-positive bacteria. Orange honey samples showed a slightly lower inhibitory activity, which is consistent with the lower content of phenolics and vitamin C.
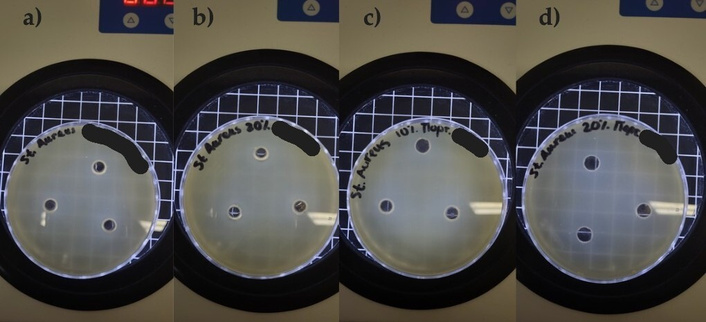
Representative antibacterial activity. a) Heather 10% sample 3, b) heather 20% sample 3, c) orange 10% sample 3, and d) orange 20% sample 3, against Staphylococcus aureus.
Regarding Escherichia coli, the inhibitory effect was strong for all three varieties (Figure 2), especially at a concentration of 20%, where the values ranged between 10 and 15 mm. Heather honey and orange honey showed the strongest antimicrobial effect, while fir honey showed slightly lower activity.
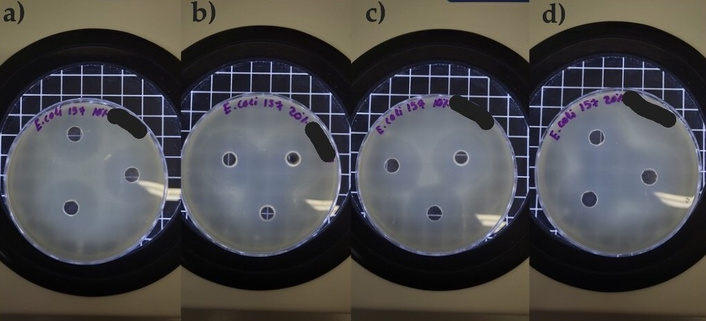
Representative antibacterial activity. a) Fir 10% sample 1, b) fir 20% sample 2, c) orange 10% sample 1, and d) orange 20% sample 1, against Escherichia coli O157:H7.
In the case of Salmonella Typhimurium, the heather and fir samples showed consistent antimicrobial activity at all concentrations, with values ranging from 7.0 to 10.4 mm. The heather 1 sample recorded the highest inhibition with a value of 10.4 mm at the 20% (w/v) concentration, while the orange samples showed lower but appreciable activity (Figure 3).
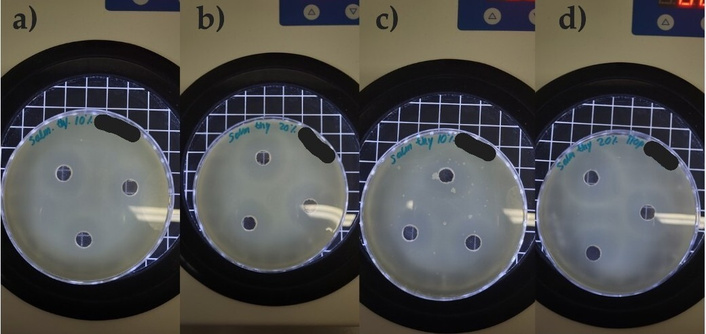
Representative antibacterial activity. a) Heather 10% sample 1, b) heather 20% sample 1, c) orange 10% sample 3, and d) orange 20% sample 3 against Salmonella Typhimurium.
Comparison with the international bibliography confirmed the agreement of the physicochemical, biochemical, and antimicrobial parameter analysis results. This was not the case for the melissopalynological analysis, during which, in the heather claimed honey, there was no reliable content of the dominant pollen grains. According to von der Ohe et al. [4], honeys of a distinguished botanical origin have the dominant pollen grains higher than 45%.
Effective acidity (pH) is a crucial parameter that can influence its shelf-life, stability, texture, and taste [6]. Generally, effective acidity increases from blossom honey to honeydew honey, which confirms their botanical separation [21–23].
According to Directive 2014/63/EU of the European Parliament and of the Council [2], the moisture content in honey should not exceed 20%, as it may cause microbial spoilage and fermentation. In our case, all the honey samples complied with this limit. Heather honey is characterized by its high moisture content [24, 25], while previous studies reported similar moisture content in fir and flower honey types [17, 26]. Following the Directive 2014/63/EU of the European Parliament and of the Council [2], when a honey sample has 20% moisture, it corresponds to 80 °Brix sugar content. The values recorded in this study were in agreement with previous studies concerning heather [18], orange [27], and fir honey [28].
The abovementioned Directive reports that honey of good quality has a maximum acidity value of 50 meq/kg. In general, fir, oak, and pine honey have higher acidity values due to their honeydew origin, while nectar honey, such as orange, flower thyme, and heather honey, have lower acidity values due to their nectar composition [26]. As we previously mentioned, high acidity values indicate poor preservation and fermentation. Also, the acidity factor plays a crucial and supplementary role in the antibacterial activity of honey [29]. However, the acidity values recorded in this study comply with the abovementioned European Directive standards and with previous studies [6, 26, 30, 31].
The electrical conductivity is an important physicochemical parameter to distinguish the nectar and honeydew honey. Honeydew honey has higher electrical conductivity than nectar, due to its higher mineral content and other charged molecules (i.e., proteins, peptides, organic acids, etc.), that are released when honey dissolves in water. Our study confirms this hypothesis, and these values are in line with the limits of European legislation, where flower honeys have a conductivity of less than 800 μS/cm [2, 26]. Ash content values are also in agreement with previous reports in the literature [32, 33].
HMF is a chemical parameter that indicates freshness quality and the degree of honey deterioration. This deterioration occurs from strong or prolonged thermal treatment or storage conditions [33]. The low HMF values in heather and fir honey represent their superior quality, while the orange samples confirmed high HMF values. This may be attributed to prolonged storage or exposure to high temperatures, given that the Argos region in the summer has temperatures higher than 40°C. The variability shown in HMF content in the honey samples analyzed is in agreement with the results reported by Turkut et al. [34] concerning pine, chestnut, and multifloral honeys from Turkiye. In addition, there was a strong negative (r = –0.930) and significant (p < 0.001) correlation between HMF and antioxidant activity in honey samples analyzed, indicating that in the present study, HMF did not contribute to the antioxidative stability of these samples, and generalizing the finding that HMF has a weak antioxidant activity. This observation is in agreement with the results reported previously by Turkut et al. [34].
The color of honey typically depends on its content of tannins and inorganic salts [26]. The high Pfund value of heather honey is confirmed in a previous study [19, 35]. Dalla et al. [26] reported quite close Pfund values in fir honey, while a low Pfund value is characteristic of flower honeys [23]. It is quite remarkable that an increase in Pfund value is positively correlated with antioxidant capacity and polyphenol concentration [19], as it can be confirmed by our study.
Vitamin C content in honey is usually an indicator of its antioxidant and antibacterial activity. There was a strong positive (r = 0.746) and significant (p = 0.021) correlation between vitamin C and antioxidant activity in the honey samples analyzed, indicating that vitamin C in honey contributes to its overall antioxidant activity. The high vitamin C content of fir and heather honey confirmed the presence of bioactive compounds, attributed to their rich phenolic profile and higher antioxidant capacity. The low content of orange honey is common, as flower honeys are usually characterized by low content of water-soluble vitamins. Vitamin C content can vary widely depending on botanical and geographical origin [37, 38]. In a previous study concerning Saudi Arabian honeys of different botanical origins [Talh (Acacia gerrardii Benth), Athel (Tamarix aphylla), and Sidr (Ziziphus spina-christi L.), spring flower and Langnese], Alshammari et al. [38] using high-pressure liquid chromatography determined varying amounts of vitamin C in the honey botanical origins mentioned above in the range of 0.25 ± 0.11 mg/100g to 2.59 ± 1.03 mg/100g. The highest value for vitamin C was obtained for Sidr honey, indicating that evergreen trees or plants belonging to the genus Ziziphus give honey with higher vitamin C content, as in our case, the heather and fir honey.
Furthermore, antioxidant activity and total phenolic content are generally positively correlated as specified biochemical parameters. Indeed, in the present study, there was a positive (r = 0.688) and significant (p = 0.040) correlation between total phenolic content and antioxidant activity in the honey samples analyzed, in agreement with the results reported by Ferrassi et al. [39] regarding Moroccan honey of different botanical origin (resin spurge, spurge, carob, oregano, thyme, etc.). Moreover, it has been clearly reported in the literature that honeydew honey possesses higher antioxidant capacity and total phenolic content than nectar honey [25, 37]. Herein, these differences suggest that dark honeys have a stronger free radical scavenging capacity compared to light honeys, which is linked to the composition of flavonoids and phenolic acids [29]. Considering the total phenolic content, a similar pattern was recorded. The high concentration of phenolics in heather is in agreement with previous studies, which reported that dark honeys, such as heather, are characterized by an increased content of flavonoids, phenolic acids, and tannins. These components are directly related to the antioxidant and antimicrobial capacity of honey [40]. Similarly, the high content of fir honey confirms that honeydew honey, although rich in minerals and enzymes, usually contains fewer phenolic compounds than dark flower honeys, but remains significantly antioxidant [19]. Finally, the orange honey values confirm the lower content of flower honeys in polyphenols compared to honeydew or dark honeys [26].
The presence of hydrogen peroxide (H2O2) in honey and its actions is strongly correlated with its antimicrobial activity. H2O2 is produced from glucose by the glucose oxidase (GOx), which is synthesized in the hypopharyngeal glands of honeybees [41, 42]. The results presented in this study are totally in agreement with previous reports in the literature where authors obtained values ranging from 1–47.56 ppm [41, 43]. The concentration of H2O2 is influenced by several parameters. The enzymatic production of H2O2 depends on the level of GOx and the contribution of nectar, while the rate of any enzymatic reaction is scavenged by low water activity. Finally, upon honey dissolution in water, several enzymatic and non-enzymatic reactions contribute positively or negatively to H2O2 concentration, such as its synthesis via polyphenol autoxidation and its destruction in the Fenton reaction [44].
Honey has also been recognized for its ability to break down biofilms, making bacteria more susceptible to its antimicrobial activity [45]. The inhibitory effect of all samples against Staphylococcus aureus may be due to the high content of phenolic acids and hydrogen peroxide, which act synergistically to cause oxidative stress in bacterial cells [46]. Regarding Escherichia coli, the strong antibacterial activity of darker honeys (heather and fir) is probably associated with low pH, low humidity, and the combined action of peroxidative agents [47]. The slightly lowest values of orange honey are possibly due to a lower concentration of enzymes such as β-glucosidase, which is responsible for the formation of hydrogen peroxide [45]. Finally, the strong antimicrobial properties of all honey samples against Salmonella Typhimurium demonstrate their remarkable action against foodborne pathogens and totally agree with previous reports [46, 49]. We should point out that the antimicrobial capacity of Greek samples, especially heather, was comparable to that of internationally recognized varieties such as Manuka [13], a fact that highlights the potential of Greek honeys as functional foods of high added value.
The present study highlighted the importance of melissopalynological, physicochemical, and biochemical analyses as a reliable way to differentiate the botanical origin of commercial honeys. Through the analysis of three characteristic varieties sold in the domestic market, more specifically, commercial heather, orange, and fir honey, it was found that each type of honey was characterized by a particular combination of pollen grains, physicochemical and bioactive properties, which can be used both for its identification and for the assessment of its quality and purity. In total, heather honey (even though only one sample was pure heather honey) presented the highest levels of phenolic compounds, antioxidant capacity, and antimicrobial activity, indicating the existence of a complex system of bioactive compounds with strong bioactive potential. Fir honey, as a honeydew honey, displayed high electrical conductivity, significant content of inorganic elements, and considerable antioxidant activity, demonstrating that conifer honeys have particular biological value and long-term stability. On the contrary, orange honey, although characterized by lower bioactivity, exhibited typical melissopalynological and physicochemical properties; however, the high HMF content indicated aging, heat treatment, or exposure to high temperatures in the regional environment. Finally, even though representative honey samples were analyzed, the study contributes to the quality control of commercial honey sold in the market, to real market analysis, and the reported data may provide a basis for further and more exhaustive control of honey samples introduced into the market.
HMF: 5-hydroxymethylfurfural
TSB: Trypticasein Soy Broth
MEG: Conceptualization, Formal analysis, Investigation. EI: Methodology, Formal analysis, Investigation, Writing—original draft. DGL: Methodology, Formal analysis, Investigation, Writing—original draft. MS: Methodology, Formal analysis, Investigation. SK: Methodology, Formal analysis, Investigation. KK: Supervision. NDA: Methodology, Resources, Supervision, Validation. IKK: Conceptualization, Methodology, Software, Validation, Investigation, Resources, Data curation, Writing—review & editing, Writing—original draft, Supervision, Visualization, Project administration. All authors read and approved the submitted version.
The authors declare that they have no conflicts of interest.
Not applicable.
Not applicable.
Not applicable.
All data presented in the article, including data cited from other publications, are traceable to their sources, and all references are closely relevant to and supportive of the content of the article. The datasets supporting the findings of this study are available from the corresponding author upon reasonable request.
The current study was partially funded by the funding programme “MEDICUS’’ of the University of Patras. The funders had no role in study design, data collection and analysis, decision to publish, or preparation of the manuscript
© The Author(s) 2026.
Open Exploration maintains a neutral stance on jurisdictional claims in published institutional affiliations and maps. All opinions expressed in this article are the personal views of the author(s) and do not represent the stance of the editorial team or the publisher.
Copyright: © The Author(s) 2026. This is an Open Access article licensed under a Creative Commons Attribution 4.0 International License (https://creativecommons.org/licenses/by/4.0/), which permits unrestricted use, sharing, adaptation, distribution and reproduction in any medium or format, for any purpose, even commercially, as long as you give appropriate credit to the original author(s) and the source, provide a link to the Creative Commons license, and indicate if changes were made.



View: 1111
Download: 42
Times Cited: 0


