Original Article

Affiliation:
1MASLD UNIT, Fondazione Italiana Fegato, 34149 Trieste, Italy
2Philippine Council for Health Research and Development, Department of Science and Technology, Taguig City 1631, Philippines
3Department of Life Sciences, University of Trieste, 34100 Trieste, Italy
4Nutrition and Dietetics Area, Colegio de San Juan de Letran, Intramuros, Manila 1002, Philippines
Email: melvin.bernardino@fegato.it; melvin.bernardino@letran.edu.ph
ORCID: https://orcid.org/0000-0002-3625-6775
Affiliation:
5Department of Nutrition and Dietetics, College of Education, University of Santo Tomas, Manila 1015, Philippines
Affiliation:
6Food Technology, Colegio de San Juan de Letran, Manila 1002, Philippines
Affiliation:
1MASLD UNIT, Fondazione Italiana Fegato, 34149 Trieste, Italy
ORCID: https://orcid.org/0000-0001-6596-7595
Affiliation:
1MASLD UNIT, Fondazione Italiana Fegato, 34149 Trieste, Italy
ORCID: https://orcid.org/0000-0002-4251-3547
Explor Foods Foodomics. 2026;4:1010171 DOI: https://doi.org/10.37349/eff.2026.1010171
Received: March 19, 2026 Accepted: June 17, 2026 Published: June 25, 2026
Academic Editor: Miguel Herrero, Tenured researcher at the Institute of Food Science Research (CIAL-CSIC), Spain
Aim: This study characterized pre-packaged foods in Southeast Asia using Nutri-Score, NOVA, and Multiple Traffic Light systems; cross-classified products by Nutri-Score and NOVA; and assessed their ability to discriminate products by nutrient content.
Methods: Data were obtained from Open Food Facts in October 2024. Of 29,789 products identified in Southeast Asia, duplicates and products with incomplete information were excluded, resulting in 4,668 pre-packaged food products from eight Southeast Asian countries. Salt, sugar, total fat, and saturated fat contents were evaluated using the Multiple Traffic Light system. Nutri-Score data were available for 4,565 products, while 2,068 products had complete information for both Nutri-Score and NOVA and were included in cross-classification analysis. Spearman correlation analyses examined relationships among Nutri-Score, NOVA, and nutrient profiles.
Results: Most products were of lower nutritional quality, with 52% classified as Nutri-Score D or E and 71% categorized as ultra-processed (NOVA 4). Multiple Traffic Light classification showed that beverages and sweet products had the highest proportion high in sugar, while beverages, cereals, and dish meals were most frequently high in salt. Sweets and snacks were the main contributors to products high in total fat and saturated fat. Cross-classification showed that as Nutri-Score decreased from A to E, the prevalence of ultra-processed foods consistently increased, while NOVA 1 became nearly negligible, indicating a trend between poorer nutritional quality and higher processing. Nutri-Score showed weak-to-moderate positive correlations with sugar (r = 0.355, p < 0.001), saturated fat (r = 0.364, p < 0.001), and salt (r = 0.190, p < 0.001). NOVA showed weaker but significant correlations with sugar (r = 0.149, p < 0.001) and salt (r = 0.138, p < 0.001).
Conclusions: Nutri-Score was associated with nutrient-rich foods, while NOVA highlighted processing levels. Combined use offers a more comprehensive evaluation than either system alone. Integrating nutrient profiling and processing classification in front-of-pack labeling may guide consumer choices and public health efforts to reduce diet-related NCDs in Southeast Asia.
Noncommunicable diseases (NCDs) account for at least three quarters of global mortality in 2021, as reported by the World Health Organization (WHO) [1]. These diseases affect individuals across all age groups, regions, and countries, highlighting their far-reaching impact. Various factors contribute to the increased risk of developing NCDs, with one significant modifiable factor being dietary choices. Diets high in salt, simple and added sugars, saturated fats, trans fats, and highly processed foods have been consistently linked to an increased risk of NCDs such as cardiovascular disease, diabetes, and certain types of cancer [2]. Southeast Asia represents an important context for evaluating front-of-pack labeling (FoPL) systems due to the region’s rising burden of diet-related non-communicable diseases, increasing availability of processed and ultra-processed foods, and varying stages of FoPL policy implementation across countries.
In the Southeast Asia region, there is evidence of a rapid nutrition transition marked by a shift in diets towards increasing consumption of unhealthy diet and increased prevalence of associated NCDs [3]. The nutrition transition is characterized by a substantial shift from traditional whole foods toward highly processed and packaged foods and beverages, which are typically energy-dense, high in sugar, sodium, and saturated fats, and relatively low in dietary fiber [4]. This is driven by fact that the food system in the region is transforming, characterized by a rapid expansion of retail outlets, particularly modern retail, which increases consumer access to processed foods, especially ultra-processed foods (UPFs) [5].
UPFs are industrially formulated products made from multiple ingredients, often bearing little or no resemblance to their original plant or animal sources [6, 7]. They contain ingredients that are not usually used in home-cooked meals, such as artificial colors, flavors, and preservatives, to improve the products’ shelf life and their sensory qualities. Designed for long shelf life and enhanced sensory appeal, UPFs are often mass-produced using low-cost ingredients, making them affordable and widely consumed [8, 9].
In response to the growing prevalence of diet-related diseases, public health efforts have increasingly focused on strategies that promote healthier food choices. One such strategy is the use of FoPL systems, which aim to provide consumers with simplified, accessible information about the nutritional quality of food products [10, 11]. These systems help guide purchasing decisions at the point of sale by translating complex nutritional data into more understandable formats. One of the most widely discussed FoPL schemes is the Nutri-Score. This system uses color coding and letter grades to assess a food product’s overall nutritional profile, considering factors such as energy, sugar, saturated fat, sodium, dietary fiber, protein, and the presence of fruits or vegetables. Foods are assigned scores from A (healthiest) to E (least healthy) to help consumers easily evaluate their relative healthfulness [12]. However, limited research has examined pre-packaged food products in Southeast Asia using both the Nutri-Score and NOVA classification systems. Understanding how these systems complement each other may provide a more comprehensive assessment of the nutritional quality and processing level of foods available in the region. Aside from Nutri-Score, another FoPL food labeling scheme developed by the United Kingdom (UK) Food Standards Agency is the Multiple Traffic Light (MTL) labeling system that uses green, amber, and red colors to indicate whether a food is low, medium, or high in nutrients of concern such as fat, saturated fat, sugar, and salt per 100 grams of food [13].
Another food classification gaining attention is the NOVA food classification, which categorizes foods based on their level of processing and purpose, rather than their nutrient content. NOVA food is divided into unprocessed or minimally processed (NOVA 1); Culinary ingredients (NOVA 2); Processed foods (NOVA 3); and UPFs (NOVA 4). This aims to reflect the potential health impact of industrial food formulations [14].
Each of these systems—Nutri-Score, MTL labeling system, and NOVA—offers a unique perspective on food quality, yet they may not always align in how they classify individual products; such misalignment could confuse consumers or lead to under-recognition of ultra-processed foods that appear nutritionally acceptable [15]. NOVA and Nutri-Score capture distinct dimensions of food quality, namely processing level and nutrient profile, respectively. Their combined use may offer complementary information for assessing dietary patterns and their potential health implications.
Given the increasing availability and consumption of processed and pre-packaged foods in Asia [16], there is a pressing need to evaluate how these labeling systems interact and whether they effectively differentiate foods based on critical nutritional components such as salt, sugar, total fat, and saturated fat [17]. In Southeast Asia, particularly in Malaysia, Thailand, the Philippines, and Vietnam, progress in updating food labeling regulations and implementing more comprehensive FoPL has been relatively slow, in part due to food industry involvement. This influence has contributed to delays in the development and implementation of effective FoPL policies, often through lobbying and recommendations for alternative policy approaches, resulting in a more prolonged policy development process [18].
In the context of the study, by applying the Nutri-Score, NOVA food classification, and MTL labeling systems to pre-packaged food products, this study seeks to provide a clearer and more comprehensive understanding of the pre-packaged food products available in the Southeast Asian market. Although these systems have not yet been implemented in the region, applying these international frameworks is expected to provide an initial overview of the nutritional quality and level of processing of pre-packaged foods in Southeast Asia. These findings may serve as a foundation for the future development of nutrient profiling models and FoPL systems in the region.
Hence, this study aims to characterized the pre-packaged food products available in Southeast Asia using Nutri-Score, NOVA classification systems and MTL labeling system. Furthermore, (1) the study will conduct a cross-classification of pre-packaged food products using the Nutri-Score and NOVA classification systems, and (2) to explore their ability to discriminate food products according to nutrients of concern such as salt, sugar, total fat, and saturated fat content.
Information about nutrient composition per 100 g (salt, saturated fat, total fat, sugars and dietary fiber), nutritional quality (Nutri-Score), and the degree of processing (NOVA) of pre-packaged food items was obtained from the Open Food Facts database [19]. It is a collaborative and freely accessible online database that contains nutritional information on more than 2.7 million food products globally. This crowdsourced repository is available under the Open Database License (ODBL). This database has been widely used as a data source in previous peer-reviewed studies published in reputable journals, supporting the validity and acceptability of this data acquisition approach [20, 21]. Using the advanced search function on the website, we searched all Southeast Asian countries, including Brunei, Cambodia, Indonesia, Laos, Malaysia, Myanmar, the Philippines, Singapore, Thailand, Timor-Leste, and Vietnam. The database’s advanced search function was employed to filter products by country of origin, with additional filters applied as needed to focus on relevant food categories, nutrient content (such as sugar, salt, and fat), and the presence of FoPL. Products meeting these criteria were retrieved, and detailed information on ingredients, nutrition, and labeling was recorded. Nutritional data were standardized to uniform units (e.g., per 100 g or mL), and food categories and FoPL types were consistently coded to enable comparative analysis. To ensure data quality, records were screened for completeness and consistency prior to analysis.
Nutritional information such as salt, saturated fat, total fat, and sugars per 100 g was obtained and interpreted using the MTL labeling system categorizing each food nutrient component as low, medium, and high. Tables 1 and 2 show the nutrient thresholds for FoPL UK’s MTL labeling per 100 g of food and beverages [22, 23]. For dietary fiber, pre-packaged food products were categorized into four groups based on fiber content per 100 g: high in dietary fiber (≥ 6 g), source of dietary fiber (3.0–5.9 g), low dietary fiber (0.1–2.9 g), and no dietary fiber (0 g) [24–26]. Nutritional quality was determined using the Nutri-Score, which is a rating system created by international research teams to assess the nutritional value of food products. A Nutri-Score calculation evaluates the nutritional value of a product based on its ingredients and assigns it to one of five color-coded letter grade classes: A, B, C, D, or E [21, 27].
Nutrient thresholds for front-of-pack Multiple Traffic Light labelling (per 100 g of food) [22].
| Nutrient | Green (Low) | Amber (Medium) | Red (High) |
|---|---|---|---|
| Fat | ≤ 3 g | > 3 g to ≤ 17.5 g | > 17.5 g |
| Saturates | ≤ 1.5 g | > 1.5 g to ≤ 5 g | > 5 g |
| Sugars | ≤ 5 g | > 5 g to ≤ 22.5 g | > 22.5 g |
| Salt | ≤ 0.3 g | > 0.3 g to ≤ 1.5 g | > 1.5 g |
Adapted from [23]. © Department of Health & Food Standards Agency & devolved administrations in Scotland, Northern Ireland and Wales & British Retail Consortium. Licensed under an Open Government Licence.
Nutrient thresholds for front-of-pack Multiple Traffic Light labelling (per 100 g of beverages) [22].
| Nutrient | Green (Low) | Amber (Medium) | Red (High) |
|---|---|---|---|
| Fat | ≤ 1.5 g | > 1.5 g to ≤ 8.75 g | > 8.75 g |
| Saturates | ≤ 0.75 g | > 0.75 g to ≤ 2.5 g | > 2.5 g |
| Sugars | ≤ 2.5 g | > 2.5 g to ≤ 11.25 g | > 11.25 g |
| Salt | ≤ 0.3 g | > 0.3 g to ≤ 0.75 g | > 0.75 g |
Adapted from [23]. © Department of Health & Food Standards Agency & devolved administrations in Scotland, Northern Ireland and Wales & British Retail Consortium. Licensed under an Open Government Licence.
The degree of food processing was based on the NOVA classification. The NOVA system categorized food into four groups: NOVA 1: “Unprocessed or minimally processed foods,” which include edible parts of plants or animals taken directly from nature or minimally modified/preserved; NOVA 2: “Culinary ingredients,” such as salt, oil, sugar, or starch, produced from NOVA 1 foods; NOVA 3: “Processed foods,” including items like freshly baked bread, canned vegetables, or cured meats, created by combining NOVA 1 and NOVA 2 foods; NOVA 4: “Ultra-processed foods,” which are ready-to-eat industrially formulated products made mostly or entirely from substances derived from foods and additives, with little if any intact group 1 food [28, 29].
Each food item was categorized into its respective food group [30]. Descriptive statistics, including frequencies and percentages, were used to summarize the distribution of food items according to the Nutri-Score, NOVA classification, and the MTL labeling system. Cross-classification analyses were also performed using frequencies and percentages to assess the alignment between these classification systems. To evaluate the relationship between the Nutri-Score and NOVA classifications in discriminating nutrient quality based on the MTL system, Spearman’s rank correlation coefficients were calculated. The Nutri-Score classification (A–E) was converted into an ordinal numeric scale (A = 1, B = 2, C = 3, D = 4, E = 5) prior to analysis. A p-value of < 0.001 was considered statistically significant.
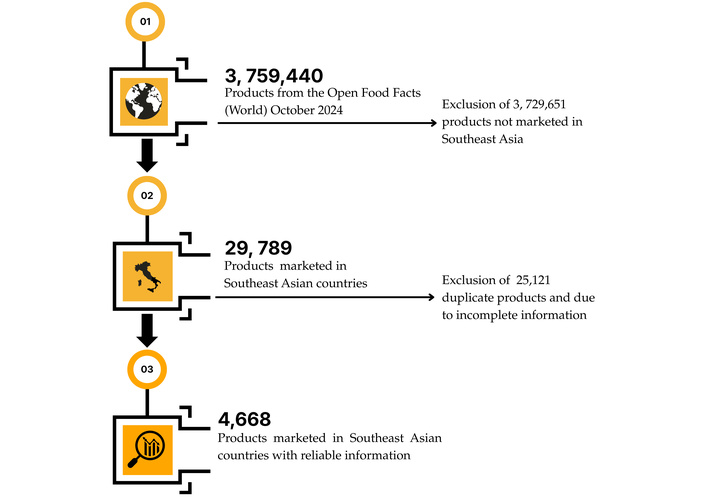
As of October 2024, the Open Food Facts (World) database contained 3,759,440 products. Using advanced search filters, we identified 29,789 products marketed in Southeast Asian countries. Products that were not marketed in Southeast Asia (3,729,651) were excluded, as well as 25,121 products that were duplicates or contained incomplete information. After these exclusions, a total of 4,668 products remained for analysis, representing foods from Southeast Asia with reliable nutritional and labeling information (Figure 1). To address the handling of incomplete entries, only products with available data for the variable of interest were included in each analysis. Nutri-Score information was available for 4,565 products, and these were included in analyses involving Nutri-Score. Data on NOVA classification were not available for all products; only 2,068 products had complete information for both Nutri-Score and NOVA classification. Moreover, the final dataset comprised products available in eight of the eleven Southeast Asian countries included in the search. Most products were recorded as available in Thailand (n = 3,014; 64.6%), followed by Singapore (n = 799; 17.1%), the Philippines (n = 281; 6.0%), Indonesia (n = 216; 4.6%), Malaysia (n = 147; 3.1%), Vietnam (n = 98; 2.1%), Cambodia (n = 70; 1.5%), and Brunei (n = 43; 0.9%). This distribution reflects the availability of products across countries in the database rather than their country of origin and should be considered when interpreting the regional representativeness of the findings.
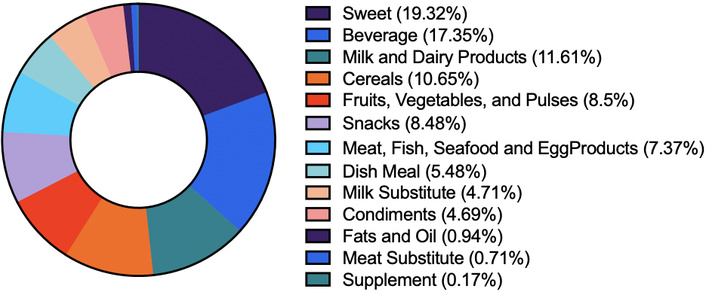
The analysis of 4,668 food product items revealed that sweet products (cakes, biscuits, pastries and chocolates) constituted the largest category, with 902 items accounting for 19.32% of the total. Beverages followed with 810 items (17.35%), while milk and dairy products comprised 542 items (11.61%). Cereal products were represented by 497 items (10.65%), and fruits, vegetables, and pulses accounted for 397 items (8.50%). Snacks closely followed with 396 items (8.48%). There were 344 meat, fish, seafood, and egg products (7.37%) and 256 dish meal items (5.48%). Milk substitutes made up 220 items (4.71%), and condiments included 219 items (4.69%). The least represented categories were fats and oils with 44 items (0.94%), meat substitutes with 33 items (0.71%), and supplements with just 8 items (0.17%). Figure 2 illustrates the distribution of food items by category.
In the analysis of 4,565 products, based on the Nutri-Score classification, 14% of the products fall under Nutri-Score A, 18% under Nutri-Score B, 16% under Nutri-Score C, 26% under Nutri-Score D, and the remaining products 26% are classified as Nutri-Score E. In the analysis of 2,068 food products, 12% were classified as NOVA 1 (unprocessed or minimally processed foods), 2% as NOVA 2 (processed culinary ingredients), 15% as NOVA 3 (processed foods), and 71% as NOVA 4 (ultra-processed foods). Figure 3 shows the distribution of foods according to Nutri-Score (A–E) and NOVA classification groups (1–4). Detailed summary of characterization of food products according to Nutri-Score classification and Nova food classification can be found in Tables S1 and S2.
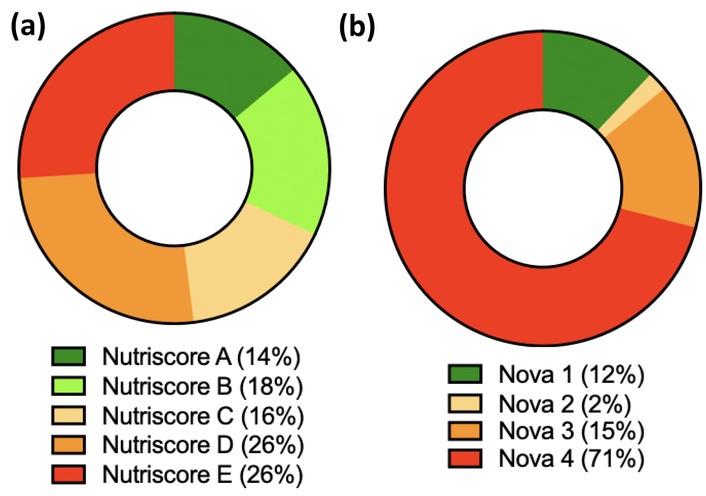
Distribution of foods according to (a) Nutri-Score and (b) NOVA classification groups. Nutri-Score groups (A, B, C, D, E). NOVA groups (1, 2, 3, 4).
The study also analyzes food products classified as NOVA 4 (UPFs) and exhibiting low nutritional quality, as indicated by Nutri-Score grades D and E, to identify the major contributors within these categories. Table 3 shows that sweet products (31.22%), beverages (22.13%) and cereal products (11.48%) cover over half of the food products belonging to NOVA 4. On the other hand, Table 4 shows that sweet products (29.99%), beverages (21.13%) and snacks (13.83%) cover over half of the food products belonging to Nutri-Score D and E.
Relative contribution of ultra-processed food (UPF) groups (NOVA 4).
| Food products | NOVA 4 (UPF) | |
|---|---|---|
| n | % | |
| Sweet | 457 | 31.22 |
| Beverage | 324 | 22.13 |
| Cereals | 168 | 11.48 |
| Milk and dairy products | 115 | 7.86 |
| Dish meal | 135 | 9.22 |
| Fruits, vegetables, and pulses | 79 | 5.40 |
| Meat, fish, seafood, and egg products | 75 | 5.12 |
| Condiments | 62 | 4.23 |
| Snacks | 29 | 1.98 |
| Meat substitute | 9 | 0.61 |
| Fats and oil | 7 | 0.48 |
| Supplement | 4 | 0.27 |
Relative contribution of Nutri-Score D and E.
| Food products | Nutri-Score D | Nutri-Score E | Total | |
|---|---|---|---|---|
| n | % | |||
| Sweet | 317 | 394 | 711 | 29.99 |
| Beverage | 150 | 351 | 501 | 21.13 |
| Snacks | 187 | 141 | 328 | 13.83 |
| Milk and dairy products | 58 | 111 | 169 | 7.13 |
| Cereals | 117 | 46 | 163 | 6.87 |
| Fruits, vegetables, and pulses | 102 | 39 | 141 | 5.95 |
| Meat, fish, seafood, and egg products | 84 | 51 | 135 | 5.69 |
| Dish meal | 43 | 8 | 51 | 2.15 |
| Milk substitute | 11 | 2 | 13 | 0.55 |
| Condiments | 89 | 33 | 122 | 5.15 |
| Fats and oil | 11 | 15 | 26 | 1.10 |
| Meat substitute | 9 | 1 | 10 | 0.42 |
| Supplement | 0 | 1 | 1 | 0.04 |
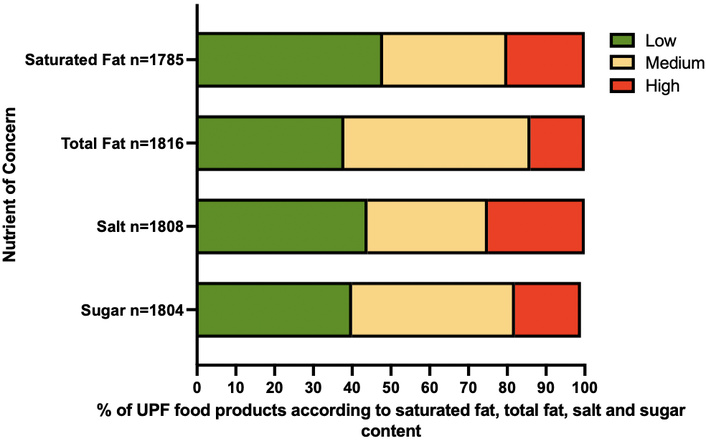
Figure 4 presents the distribution of food products based on their levels of nutrients: sugar, total fat, salt, and saturated fat. Figure 4a displays the percentage of products according to sugar content levels. The analysis revealed that beverages and sweet products had the highest proportion of items classified as high in sugar content, defined in this study as containing > 22.5 g/100 mL for solid food and > 11.25 g/100 mL liquid food like beverages. Figure 4b shows the percentage of products by salt content, highlighting that beverages, cereals, and dish meals had a higher percentage of products falling into the high-salt category, defined in this study as containing > 1.5 g/100 mL for solid food and > 0.75 g/100 mL liquid food like beverages. This finding underscores the often-underestimated sodium content in processed and ready-to-eat food products. Figure 4c illustrates the distribution by fat content, where sweets and snacks emerged as the leading contributors to products with high total fat content, defined in this study as containing more than 17.5 g of total fat per 100 g. Lastly, Figure 4d presents the distribution of food products based on saturated fat content. Similar to total fat, sweets and snacks had the highest share of items with high saturated fat content, defined in this study as containing more than 5 g of saturated fat per 100 g. A detailed summary of characterization of food products according to the MTL system can be found in Tables S3 and S4.
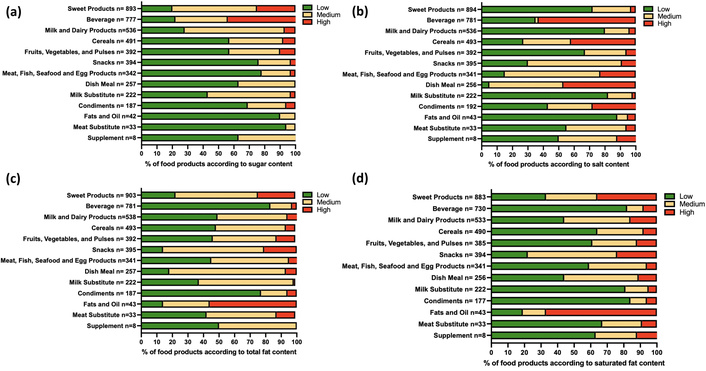
Distribution of food products by nutrient content level, including (a) sugar, (b) salt, (c) total fat, and (d) saturated fat, presented as percentages. The figure highlights the proportion of products within each nutrient category that fall into low, medium, and high content levels.
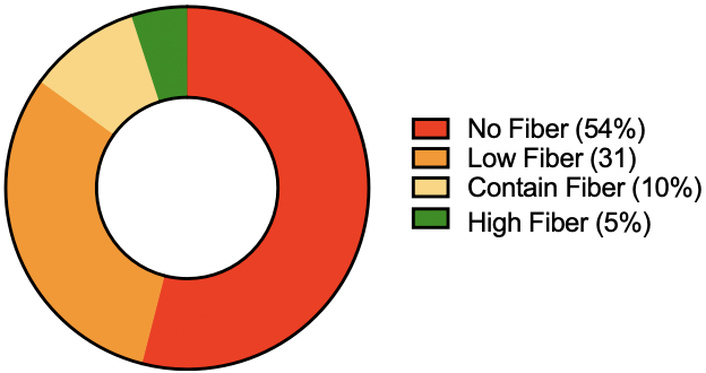
Furthermore, the study also gathered information on the dietary fiber content of various food products. A total of 4,243 food items across different food groups were analyzed. However, products from the meat category and from fats and oils were excluded from the analysis, as these are not natural sources of dietary fiber in a typical diet. Meat substitutes were retained, as they are commonly formulated from plant-based ingredients. Figure 5 shows the distribution of foods according to their level of dietary fiber content. The results showed that 2,270 products, or 54% of the total, contained no dietary fiber. This was followed by 1,325 products (31%) with low fiber content, 429 products (10%) that contained fiber, and only 219 products (5%) with high fiber content.
Figure 6 shows the distribution of food products according to fiber content, categorized as no fiber, low fiber, contains fiber, and high fiber, presented as percentages. The figure shows that beverages had the highest percentage of food items that belong to “no dietary fiber”. Furthermore, beverage products exhibited the highest percentages of items classified as high in sugar and, unexpectedly, high in salt. A detailed summary of characterization of food products according to dietary fiber content can be found in Table S5.
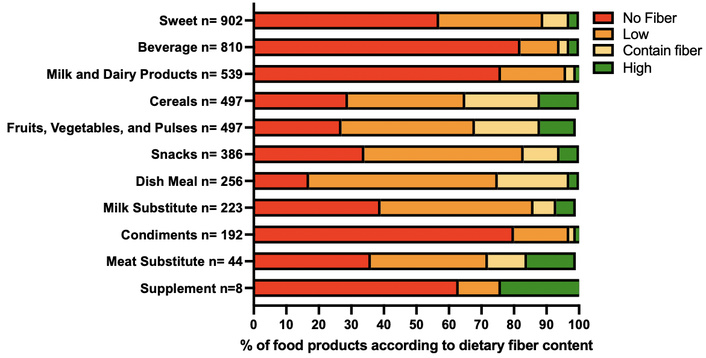
Distribution of food products according to fiber content, categorized as no fiber, low fiber, contains fiber, and high fiber, presented as percentages. The figure illustrates the proportion of products within each fiber category, highlighting the fiber presence across different food groups.
The distribution of UPFs based on their levels of key nutrients of concern, such as total sugar, salt, total fat, and saturated fat shown in Figure 7. Regarding total sugar, the majority of UPFs fall into the low (40%, n = 729) and medium (42%, n = 762) categories, while only 17% (n = 313) are high in sugar. This suggests that while sugar content is a concern, a relatively small proportion of UPFs are extremely high in sugar. In terms of salt content, a slightly different pattern emerges. Nearly half of UPFs (44%, n = 797) have low salt, but a substantial proportion falls into the medium (31%, n = 560) and high (25%, n = 451) categories. This indicates that a considerable number of UPFs have moderate to high levels of salt, which could be a notable public health concern. Total fat content shows that almost half of UPFs (49%, n = 880) are classified as medium, with 38% (n = 678) being low and 14% (n = 249) high. This suggests that while extreme fat content is less common, a majority of UPFs have moderate fat levels. Finally, saturated fat follows a similar trend. Nearly half of the foods (48%, n = 858) are low in saturated fat, while 32% (n = 567) fall into the medium category and 20% (n = 360) are high. Although fewer foods are extremely high in saturated fat, one-fifth of UPFs still exceed recommended levels, highlighting potential cardiovascular risks. Overall, it reveals that most UPFs are in the low to medium range for nutrients of concern, but a significant proportion still contain high levels of salt and saturated fat, with sugar and total fat being less frequently extreme. The distribution of foods across low, medium, and high categories for each nutrient, including absolute numbers and percentages, is shown in Table S6.
The cross-classification between Nutri-Score and the NOVA food classification is presented in Table 5. The distribution of food products across Nutri-Score categories and NOVA classification shows a notable trend toward higher levels of processing in lower nutritional quality scores. In Nutri-Score A, which represents the highest nutritional quality, 37.8% of the products are classified as NOVA 1 (unprocessed or minimally processed), 14.63% fall into NOVA 3 (processed), and 47.56% are NOVA 4 (ultra-processed). For Nutri-Score B, 70.42% of products are classified as NOVA 4, and 10.27% as NOVA 3, and only 19.32% belong to NOVA 1. This highlights that even among products with the best Nutri-Score, nearly half are UPFs, emphasizing the need to consider both nutritional value and degree of processing when assessing food quality.
Cross-frequency table between Nutri-Score and NOVA classification. Relative frequencies were calculated by row.
| Nutri-Score | NOVA 1 | NOVA 2 | NOVA 3 | NOVA 4 |
|---|---|---|---|---|
| A | 124 (37.80%) | 0 (0%) | 48 (14.63%) | 156 (47.56%) |
| B | 79 (19.32%) | 0 (0%) | 42 (10.27%) | 288 (70.42%) |
| C | 24 (5.58%) | 11 (2.56%) | 89 (20.70%) | 306 (71.16%) |
| D | 11 (1.66%) | 21 (3.18%) | 85 (12.86%) | 544 (82.30%) |
| E | 15 (2.49%) | 10 (1.66%) | 56 (9.29%) | 522 (86.57%) |
NOVA 1: Unprocessed or minimally processed foods; NOVA 2: Culinary ingredients; NOVA 3: Processed foods; NOVA 4: Ultra-processed foods.
The trend continues with Nutri-Score C, where 71.16% of products are NOVA 4, 20.70% NOVA 3, 2.56% NOVA 2, and 5.58% NOVA 1. For Nutri-Score D, 82.30% of products fall under NOVA 4, with smaller proportions in NOVA 3 (12.86%), NOVA 2 (3.18%), and NOVA 1 (1.66%). Finally, in Nutri-Score E—the lowest nutritional quality—86.57% of products are classified as NOVA 4, with 9.29% in NOVA 3, 1.66% in NOVA 2, and 2.49% in NOVA 1. This progression underscores a trend linking poor nutritional quality and higher levels of food processing. As Nutri-Score decreases from A to E, the prevalence of UPFs consistently increases, while the share of unprocessed or minimally processed foods (NOVA 1) becomes nearly negligible. These findings highlight that lower nutritional quality is typically accompanied by higher levels of industrial processing, reinforcing the importance of assessing both the nutrient quality (Nutri-Score) and the processing level (NOVA classification) when evaluating food products for healthfulness.
To further illustrate the relationship between Nutri-Score and NOVA food classification, Figure 8 shows the ternary diagram inspired by the study of Romero Ferreiro et al. (2021) [20]. The analysis omitted NOVA 2 since it only accounts for 2% of the food products. Each circle (A, B, C, D, E) represents the average position of that Nutri-Score group’s products in terms of NOVA classification. The closer a point is to a corner (NOVA 1, 3, or 4), the greater the proportion of that Nutri-Score group in that NOVA category. As Nutri-Score declines from A to E, the corresponding data points shift closer to the NOVA 4 vertex, indicating an increasing proportion of UPFs. Notably, Nutri-Score A includes a substantial share of NOVA 1 (unprocessed or minimally processed) products but also a significant proportion of NOVA 4 (47.56%), highlighting a discrepancy between nutritional quality and degree of processing. Nutri-Score E is positioned nearest to the NOVA 4 apex, reflecting its composition of predominantly UPFs (86.57%). Intermediate scores (B, C, D) demonstrate a gradual transition toward higher processing levels.
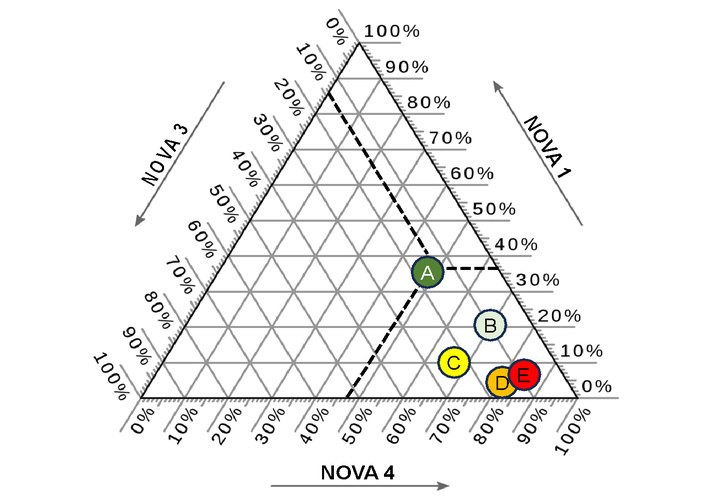
Ternary diagram for cross-classification between Nutri-Score and NOVA classification.
The statistical correlation analysis of the relationships between nutrient categories and both Nutri-Score and NOVA classifications is presented in Table 6. Nutri-Score demonstrated strong positive correlations with saturated fat (r = 0.364, p < 0.001), sugar (r = 0.355, p < 0.001), fat (r = 0.267, p < 0.001), and salt (r = 0.190, p < 0.001), while showing a significant negative correlation with fiber content (r = –0.175, p < 0.001). These results are consistent with Nutri-Score’s design, which penalizes high levels of negative nutrients and rewards positive components such as dietary fiber.
Correlation coefficients (R), t-values (T), and p-values between nutrient categories and Nutri-Score/NOVA classification.
| Nutrient category | R (Nutri-Score) | T | p-value | R (NOVA) | T | p-value |
|---|---|---|---|---|---|---|
| Fat | 0.267 | 13.399 | p < 0.001* | 0.085 | 4.152 | p < 0.001* |
| Saturated fat | 0.364 | 18.888 | p < 0.001* | 0.081 | 3.946 | p < 0.001* |
| Sugar | 0.355 | 18.385 | p < 0.001* | 0.149 | 7.305 | p < 0.001* |
| Salt | 0.190 | 9.349 | p < 0.001* | 0.138 | 6.749 | p < 0.001* |
| Dietary fiber | –0.175 | –8.584 | p < 0.001* | 0.084 | 4.074 | p < 0.001* |
*: Significant.
In contrast, correlations with NOVA classification were generally weaker but statistically significant. The highest correlations were observed with sugar (r = 0.149, p < 0.001) and salt (r = 0.138, p < 0.001), followed by fat (r = 0.085, p < 0.001), fiber (r = 0.084, p < 0.001), and saturated fat (r = 0.081, p < 0.001), reflecting its focus on the degree of food processing.
The WHO endorsed the FoPL as an evidence-based public health intervention as an effective strategy to prevent NCDs. However, despite demonstrated effectiveness globally, the most impactful types of FoPL systems have not yet been widely implemented across Southeast Asia [18].
Our study analyzed the pre-packaged food products available in Southeast Asia’s food market based on nutrition quality and degree of food processing. The study highlighted that the majority of products with lower Nutri-Score ratings, particularly D and E, were also classified as UPFs (NOVA 4). These findings align with previous research across various markets. Romero Ferreiro et al. (2021) [20] analyzed food products in the Spanish market, Fedde et al. (2022) [12] examined products in German food retail, Angelino et al. (2023) [31] focused on breakfast cereals in the Italian market, Sarda et al. (2024) [21] investigated the French market, and Onifade et al. (2025) [32] studied pre-packaged foods in Senegalese supermarkets. All of these studies reported a high prevalence of UPF with low nutritional quality.
Interestingly, the study by Valenzuela et al. (2022) [33] on Chile’s basic food basket found that many products labeled with high Nutri-Score ratings (A and B) were still classified as UPF. This is also evident in our study, where pre-packaged products with Nutri-Score A and B were found to be UPF. This highlights a key limitation of the Nutri-Score system that nutritional quality alone may not fully reflect a food’s overall healthfulness, especially when processing level is taken into account. In our study, nutrient-level analysis showed that UPF products often moderate levels of nutrients of concern; a notable proportion still contains high salt or saturated fat. Additionally, more than half of the analyzed products contained no dietary fiber, with beverages particularly dominant in this category.
These differences are not coincidental; they reflect the theoretical underpinnings of each system. Nutri-Score operates within the traditional nutrient-based paradigm, which assesses food based on individual nutrients and beneficial components. It focuses on the nutritional profile per 100 g of product, aiming to help consumers make quick, nutrient-informed choices [10, 34]. In contrast, the NOVA classification system reflects a processing-based paradigm, viewing the degree of industrial processing as a separate and independent determinant of food healthfulness [14, 35]. This includes factors such as the use of additives, changes to food structure and the presence of cosmetic ingredients that make products palatable and shelf stable. Thus, while food might be nutritionally adequate, it can still be classified as UPFs under NOVA, explaining why these systems sometimes assign conflicting ratings [36, 37]. This was reflected in some of the products analyzed in the study with a Nutri-Score A classification yet grouped under NOVA 4. For example, a seeded multigrain cereal was classified as Nutri-Score A because of its relatively favorable nutrient profile (295 kcal/100 g, medium fat, saturated fat, low sugar, low salt, and a source of fiber), yet it was simultaneously classified as NOVA 4 due to its level of industrial processing. This example highlights how Nutri-Score and NOVA capture different dimensions of food healthfulness.
While the nutrient profile of UPFs, typically high in added sugars, sodium, and saturated fats, is often highlighted in public health discussions, emerging evidence suggests that additional components inherent to processing may contribute to adverse health outcomes. UPFs commonly contain additives such as emulsifiers, artificial sweeteners, flavor enhancers, and preservatives [38], which, although generally recognized as safe, have been associated with alterations in gut microbiota, low-grade inflammation, and metabolic disturbances in both animal and human studies [39]. Future research should investigate the specific contribution of these additives within UPFs and their potential health implications.
Beyond intentional additives, UPFs often contain neo-formed compounds produced during high-temperature processing, such as acrylamide and advanced glycation end products (AGEs) [40]. These compounds are linked to oxidative stress, inflammation, and potential carcinogenicity. The widespread use of refined starches and hydrogenated oils further exacerbates metabolic risk by promoting rapid glucose absorption and increasing trans fat intake. Moreover, chemical contaminants from packaging materials, including bisphenol A (BPA) and phthalates, may act as endocrine disruptors, contributing to long-term metabolic and reproductive health concerns [41, 42]. The cumulative effect of these processing-related components suggests that the health risks of UPFs extend beyond nutrient profile.
While these theoretical differences help explain the inconsistencies in how foods are classified, it is also important to consider how these systems perform in specific cultural and regional contexts. Both classification systems have limitations that affect their applicability in Southeast Asian contexts. Nutri-score fails to account for portion sizes, sustainability considerations [43], and traditional food processing methods common in Southeast Asian cuisines. Parallel to this, NOVA food classification faces challenges in categorizing traditional fermented foods and culturally-specific processing techniques that may not align with Western industrial processing standards. These gaps raise concerns about the appropriateness and adaptability of global labeling systems when applied to diverse food environments, and they emphasize the need for culturally sensitive adaptations or even complementary tools [44]. Additional research is needed to evaluate the applicability of these classification systems to traditional and culturally specific foods commonly consumed in the region. Notably, statistical correlations support these patterns; in our study, Nutri-Score showed strong associations with key nutrients and NOVA classification aligning more closely with the degree of processing. Together, these findings underscore the need for a combined approach using both systems to accurately evaluate the health impact of food products.
Nutrient profiling is a method used to classify foods based on their nutritional quality. This effective approach integrates key nutritional factors—such as amount of sugar, fat, salt, the energy density, and portion size [45, 46]. An unexpectedly high proportion of beverages were classified as “high salt” (> 1.5 g/100 g). This finding contrasts with common consumer perceptions that beverages contribute minimally to salt intake. Such products may therefore constitute a less-recognized source of dietary sodium, emphasizing the need for improved consumer awareness and closer monitoring of sodium levels in beverage formulations. Studies from India have reported extremely wide variation in sodium content in packaged beverages, with values ranging from 222 to 22,640 mg/100 g in some product categories [47].
However, nutrient profiling systems do not account for the degree of food processing, which is captured by the NOVA classification system. NOVA classifies foods according to the extent and purpose of industrial processing, providing an additional dimension of food quality that is not reflected in nutrient composition alone [48]. Beyond classification systems, a growing body of epidemiological and experimental evidence has examined UPF in relation to health outcomes. For example, an inpatient crossover trial by Hall et al. (2019) [49] reported that diets high in UPF increased energy intake under controlled conditions, even when nutrient composition was matched. Evidence from an umbrella review of epidemiological meta-analyses highlights the health risks associated with high consumption of UPF. Specifically, greater exposure to UPF has been associated with an increased risk of adverse health outcomes, particularly cardiometabolic diseases, common mental disorders, and all-cause mortality [50].
For such strategies to be effective, consumers must be able to easily recognize UPF in the marketplace. However, the implementation of dual FoPL systems in Southeast Asia faces unique challenges related to consumer literacy, cultural food practices and regulatory frameworks. But given this WHO guidance that countries should implement a single FoPL; however, countries like Malaysia, and Thailand have two FoPL system [18].
Research indicates that interpretive labels show greater effectiveness across diverse socioeconomic groups, with warning labels proving particularly effective in this context [51]. In Singapore, Nutri-Grade is an interpretive FoPL system applied to both freshly prepared and pre-packaged beverages. It uses a four-level grading scale, from Grade A to Grade D, based on the beverage’s sugar and saturated fat content [52].
While FoPL systems like Nutri-Score provide useful information on nutrient content, they may not fully capture the health risks associated with food processing. Therefore, these systems should be complemented by indicators that reflect the degree of processing, such as the NOVA classification, to offer more comprehensive nutritional guidance. The lower nutritional quality of NOVA group 4 foods may at least partially explain the observed associations between UPF consumption and increased risk of chronic diseases. A classification system that incorporates both nutrient profile and processing level is critical to empower consumers and support public health interventions.
As evidence and interest in the degree of food processing grow, there is an ongoing discussion on the concern of including the processing level in dietary guidance [53, 54].
Given the significant healthcare costs associated with obesity and NCDs, it is critically important to implement impactful FoPL systems. Obesity and diet-related NCDs—such as type 2 diabetes, cardiovascular diseases, and certain cancers—impose a substantial economic burden on healthcare systems globally. A well-designed FoPL system can serve as a low-cost, high-reach public health tool that informs consumer choices at the point of purchase, nudging populations toward healthier dietary patterns [18].
This study provides valuable insights into the classification of pre-packaged foods, particularly in relation to the pressing issue of the degree of food processing, as documented across different studies. The study acknowledges the limitations of this classification system and notes the continuing debate about its reliability and validity as a tool for guiding the public toward healthier dietary choices.
Impactful FoPL systems help bridge the gap between complex nutritional information and consumer understanding, especially among populations with lower nutrition literacy [55, 56]. By providing clear, interpretive cues—such as color coding or warning symbols—effective FoPL systems can discourage the consumption of products high in added sugars, saturated fats, and sodium, and ultimately reduce population-level intake of unhealthy UPFs. In doing so, they contribute to the prevention of obesity and NCDs, potentially lowering long-term healthcare costs and improving quality of life [57, 58]. The implementation of FoPL and food classification systems may also be influenced by broader policy and stakeholder considerations, including differing perspectives among regulators, public health organizations, and the food industry. These factors may affect the adoption and harmonization of such systems across countries and should be considered in future policy discussions.
This study has several limitations. The use of Open Food Facts may introduce selection bias, as data are volunteer-entered and may overrepresent certain brands or product categories. The cross-sectional design limits the ability to draw causal inferences about health outcomes. Nutrient values from Open Food Facts were not validated against laboratory analyses or national food composition databases. Additionally, MTL thresholds were derived from UK FSA guidelines and may not fully reflect Southeast Asian contexts; currently, there is no harmonized or widely adopted MTL framework specific to Southeast Asia; therefore, the UK FSA MTL criteria were used as a standardized reference for comparative nutrient profiling. Furthermore, Nutri-Score categories (A–E) were converted into ordinal values for Spearman correlation analyses. While this approach is appropriate for rank-based assessment, the categories do not necessarily represent equal differences in nutritional quality, and therefore the resulting correlations should be interpreted with caution.
The analyses were also subject to missing data. Although 4,668 products were included in the dataset, only 2,068 products had complete information for both Nutri-Score and NOVA classification and were included in the cross-classification analyses. If the missing data were not random, this may have introduced bias into the observed associations. Finally, the generalizability of the findings may be limited, as Southeast Asia is a diverse region; results may differ between higher-income settings such as Singapore and lower-income contexts such as Myanmar, and no country-specific sub-analyses were conducted.
Our findings demonstrate that Nutri-Score and NOVA classification systems capture distinct but complementary dimensions of food healthfulness in Southeast Asian markets. Specifically, Nutri-Score shows strong correlations with sugar, saturated fat, and salt content, helping consumers identify nutrient-dense options. NOVA, on the other hand, identifies processing-related health risks that are independent of nutrient profiles, offering insight into structural and additive-related concerns. Notably, there are still products with favorable Nutri-Scores (A or B) that were classified as UPF (NOVA 4)—a critical policy gap. Our findings support further research into integrated FoPL that combine nutrient profiling and processing indicators. Pilot testing of such dual labels in Southeast Asian consumer settings is warranted.
Based on these findings, Southeast Asian countries may consider exploring the development of FoPL systems that integrate nutrient profiling with indicators of food processing to enhance interpretability and usefulness for consumers. If such systems are further developed, several aspects may be relevant for consideration, including: (1) broad and consistent coverage to minimize selective implementation; (2) adaptation of classification approaches to better reflect regional dietary patterns and traditional foods; (3) potential integration into digital and e-commerce environments to support wider accessibility; (4) accompanying consumer education initiatives to improve understanding of both nutrient-based and processing-based information; and (5) ongoing monitoring and evaluation to inform future refinement of such systems.
However, limited regulatory capacity and potential industry opposition should be considered as important constraints on implementation.
Despite these strengths, current systems still lack sensitivity to portion sizes, sustainability metrics, and culturally specific processing methods. Additionally, real-world implementation remains limited by low labeling uptake, regulatory differences, and consumer literacy challenges.
Given the well-documented adverse health effects associated with ultra-processed food consumption, there is a need to continue exploring public health strategies that help consumers make informed food choices. Emerging approaches, such as Nutri-Score V.2.0 [15], which combines information on nutrient profile and degree of processing, may provide a more comprehensive assessment of food healthfulness. Evidence from a randomized controlled trial suggests that this enhanced labeling system can positively influence purchasing intentions and consumers’ perceptions of healthier products. Future research should evaluate the applicability and effectiveness of such integrated labeling approaches within Southeast Asian food environments and consumer populations.
Additionally, future research should explore algorithm modifications for traditional foods, and assess behavioral and health outcomes in the context of policy interventions. By addressing both nutrient quality and food processing, FoPL systems can more effectively guide consumer choices, improve dietary patterns, and help reduce the burden of obesity and diet-related NCDs across Southeast Asia.
FoPL: front-of-pack labeling
MTL: Multiple Traffic Light
NCDs: noncommunicable diseases
UPFs: ultra-processed foods
The supplementary tables for this article are available at: https://www.explorationpub.com/uploads/Article/file/1010171_sup_1.pdf.
MB: Conceptualization, Methodology, Data curation, Investigation, Formal analysis, Visualization, Writing—original draft, Writing—review & editing. NKS: Conceptualization, Methodology, Data curation, Investigation, Formal analysis, Resources, Writing—original draft, Writing—review & editing. MTA: Data curation, Investigation, Formal analysis, Writing—original draft, Writing—review & editing. CT: Conceptualization, Supervision, Writing—review & editing. NR: Conceptualization, Supervision, Writing—review & editing. All authors read and approved the submitted version.
The authors declare that they have no conflicts of interest.
Not applicable.
Not applicable.
Not applicable.
The raw data supporting the findings and conclusions of this study are available from the corresponding author upon reasonable request. Data will be provided without undue restriction to any qualified researcher for the purpose of academic, non-commercial research.
MB’s scholarship is funded by the DOST-PCHRD (Department of Science and Technology—Philippine Council for Health Research and Development) 2023–2026. The funder(s) had no role in study design, data collection and analysis, decision to publish, or preparation of the manuscript.
© The Author(s) 2026.
Open Exploration maintains a neutral stance on jurisdictional claims in published institutional affiliations and maps. All opinions expressed in this article are the personal views of the author(s) and do not represent the stance of the editorial team or the publisher.
Copyright: © The Author(s) 2026. This is an Open Access article licensed under a Creative Commons Attribution 4.0 International License (https://creativecommons.org/licenses/by/4.0/), which permits unrestricted use, sharing, adaptation, distribution and reproduction in any medium or format, for any purpose, even commercially, as long as you give appropriate credit to the original author(s) and the source, provide a link to the Creative Commons license, and indicate if changes were made.

View: 486
Download: 21
Times Cited: 0