 Original Article


Affiliation:
1Laboratorio de Investigación, Desarrollo e Innovación en Proteínas Alimentarias (LIDiPA), Centro de Investigación y Desarrollo en Ciencia y Tecnología de los Alimentos (CIDCA), CCT La Plata-CONICET, CICPBA, UNLP, La Plata 1900, Argentina
ORCID: https://orcid.org/0009-0005-8526-755X

 ,
,
Affiliation:
1Laboratorio de Investigación, Desarrollo e Innovación en Proteínas Alimentarias (LIDiPA), Centro de Investigación y Desarrollo en Ciencia y Tecnología de los Alimentos (CIDCA), CCT La Plata-CONICET, CICPBA, UNLP, La Plata 1900, Argentina
ORCID: https://orcid.org/0000-0003-0105-6092
,
Affiliation:
2Instituto de Biología Agrícola de Mendoza (IBAM), CONICET-Facultad de Ciencias Agrarias (FCA)-Universidad Nacional de Cuyo (IBAM-FCA-CONICET-UNCuyo), Mendoza M5528AHB, Argentina
ORCID: https://orcid.org/0000-0002-8481-1219
,
Affiliation:
1Laboratorio de Investigación, Desarrollo e Innovación en Proteínas Alimentarias (LIDiPA), Centro de Investigación y Desarrollo en Ciencia y Tecnología de los Alimentos (CIDCA), CCT La Plata-CONICET, CICPBA, UNLP, La Plata 1900, Argentina
Email: vtironi@quimica.unlp.edu.ar
ORCID: https://orcid.org/0000-0003-3801-7281

Explor Foods Foodomics. 2026;4:1010155 DOI: https://doi.org/10.37349/eff.2026.1010155
Received: June 28, 2025 Accepted: March 25, 2026 Published: May 28, 2026
Academic Editor: Dilip Rai, Teagasc Food Research Centre Ashtown, Ireland
The article belongs to the special issue Natural Bioactive Compounds in Functional Foods: From Foodomics Insights to Clinical Relevance
Aim: This study focused on evaluating the bioaccessibility and antioxidant potential of the protein and phenolic compounds present in a beverage (
Methods: The
Results: After SGID, protein digestibility of
Conclusions: This product demonstrated potential as an antioxidant functional beverage, which should be further confirmed by additional in vitro and in vivo assays. It also remains pending sensory and microbiological safety evaluations to obtain a final product that is both organoleptically acceptable and safe for consumption.
Different nutritional/health/habits (milk protein allergies, lactose intolerance, vegetarian, vegan, and flexitarian diets, among others) and environmental impact (sustainability and carbon footprint of animal products) have driven a shift toward a more plant-based diet [1–4]. In this sense, plant-based milk alternatives are having a substantial growth in this industry and are currently the most consumed plant-based food products [5]. It is estimated that the annual growth rate will be about 10% between 2024 and 2031 [6]. Nowadays, beverages derived from a wide range of plant sources are available commercially and are also being developed experimentally. Cereal- and legume-based drinks differ in their macro- and micronutrient profiles, their bioactive compounds, and their content of antinutritional factors. Plant-based drinks generally contain beneficial bioactive molecules, including polyphenols and other antioxidant molecules. Antioxidants present in grain-based beverages can contribute to supporting the immune system, suppressing oxidative stress, and reducing the risk of morbidities such as cancer, type 2 diabetes, and hypertension [7]. For instance, kidney bean milk revealed higher antioxidant activity in the intestinal phase after the gastric phase, indicating bioaccessible antioxidant properties of 154%–295% by CUPRAC and 50%–186% by DPPH, along with a bioaccessible phenolic content of 207%–266% compared to kidney bean [8]. Peanut-based beverages contain resveratrol (approximately 81 μg/L [9]). Although this compound has been reported to exhibit a range of bioactivities—including antioxidant, antibacterial, hepatoprotective, cardiovascular, radioprotective, and anti-HIV effects [10]—there is currently no evidence demonstrating that these biological activities are present in the beverage itself. Duarte et al. [11] investigated the capacity of lupin and chickpea-based beverages to inhibit cancerous cells, by testing the in vitro inhibitory activity of the soluble protein fractions of both beverages on gelatinase MMP-9, a matrix metalloproteinase, which is related to inflammation and cancer disease, as well as their potential against colon cancer cell proliferation and migration, using an HT29 cultured cell line. Overall, protein extracts from both beverages (100 µg/mL) from both beverages presented very significant inhibitory activities on commercial MMP-9, which were considerably higher after in vitro digestion, particularly for the lupin beverage, with a 96% reduction in the MMP-9 activity, as opposed to the chickpea beverage, for which a 48% inhibition was obtained. In addition, some plant-based beverages based on almond, carob/almond, cashew, macadamia, quinoa and soy had low glycaemic index values (GI < 55 %, [12]), and some plant-based beverages can also act as prebiotics due to galacto- and fructo-oligosaccharides, resistant starch, and water-soluble fiber such as glucan and arabinoxylans [2–4]. The bioactive characteristics of the protein portion in plant-based beverages have received relatively little investigation so far. Pulse beverages have the most balanced composition, protein content, and digestion [11] similar to that of cow’s milk, but face technological problems often related to processing or preservation as well as allergy (e.g., soy proteins). Heat treatment, such as cooking and pasteurization, can eliminate flavors, the most difficult barrier to consumer acceptance. However, high temperatures (> 90°C) can cause excessive protein denaturation, decreased protein solubility, and can increase the viscosity of legume beverages, affecting their physical stability [13]. In recent years, there has been increasing interest in pea proteins as a suitable ingredient to reformulate foods and beverages, instead of animal proteins or soy proteins, maintaining adequate protein intake. Pea proteins are considered high-quality proteins as they are a rich source of essential amino acids, including arginine, phenylalanine, leucine, and isoleucine, and, more importantly, lysine. Although they are deficient in the sulfur-containing amino acids, mainly methionine and cysteine, the protein digestibility-corrected amino acid score (PDCAAS) of pea protein isolates and pea-protein concentrate was reported as good-quality proteins (0.82 and 0.9, respectively). Digestibility of unprocessed pea seeds was found to be lower than protein isolate due to the presence of anti-nutrients [14]. Current research indicates that the interesting functional properties of pea protein ingredients are strongly influenced by extraction (e.g., temperature and solvent) and production conditions (e.g., temperature and pH), and the complex interactions with other components of the food matrix (mainly starch, fiber, and lipids) [14]. In earlier studies [15, 16], high-protein beverages were produced from amaranth seeds. Using an alkaline treatment, researchers were able to solubilize the proteins while keeping the starch and other components insoluble, resulting in drinks with protein levels comparable to cow’s milk. In this study, the process was used as a foundation and further optimized to produce a yellow-pea-based beverage. After pasteurization, the physical and microbiological stability of the product was assessed. Once a stable beverage was achieved, the primary objective was to examine the bioaccessibility and potential antioxidant activity of its peptide and phenolic fractions. Additionally, a comparative analysis was performed using yellow pea flour and protein isolate to determine how the processing steps influenced the final beverage.
Alfa-amylase from Bacillus subtilis (10070, 57.4 U/mg), pepsin from porcine gastric mucosa P6887 (3,200–4,500 U/mg), porcine pancreatin 4XUSP P1750, bovine bile salts B3883, 2′,7′-dichlorofluorescindiacetate (DCFH-DA), trypan blue (T6146), Triton X-100, Trolox (6-hydroxy-2,5,7,8-tetramethylchroman-2-carboxylic acid, 238813), 2,4,6-trinitrobencenesulfonic acid (TNBS, P2297), and 2,2′-Azinobis-(3-ethylbenzthiazolin-6-sulfonic acid) (ABTS, A1888) were purchased from Sigma Chemical Co. (St. Louis, MO, USA). Fluorescein sodium (60045781) was from Fluka (Steinheim, Germany). AAPH (2,2´-Azo-bis-(2-methylpropionamidine) dihydrochloride, 82235) was from Aldrich (Wisconsin, USA). De Man, Rogosa & Sharpe medium (MRS, L4036-500), Chloramphenicol Yeast Glucose medium (YGC, BK007HA), and bacteriological agar (A1010HA) were from Biokar Diagnostics (Argentina). Nutritive broth (B0212305) was from Britania (Argentina). Dulbecco’s modified Eagle medium (DMEM, P3030-001) and DMEM without phenol red (L4036-500) were from Emeve (Microvet SRL, CABA, Argentina). Gentamycin, non-essential amino acids (NEAA), penicillin/streptomycin (PenStrep) (15140–122, 10,000 units/mL penicillin, 10,000 μg/mL streptomycin), and trypsin EDTA (15140-122) were from Gibco (Thermo Fisher Scientific, Waltham, MA, USA). Heat-inactivated fetal calf serum (FCS) was from Internegocios SA (FBI, Mercedes, Buenos Aires, Argentina). Hydrogen peroxide (17606) was from Riedel-del-Häen (Seelze, Hannover, Germany). Other reagents were of analytical grade.
Yellow pea seeds (Pisum sativum var. Yams) cultivated in 2023 in Buenos Aires province (Argentina) were ground in a Udy mill (0.5 mm mesh) to prepare the flour (F). A protein isolate (I) was also prepared by solubilization at pH 9.5, followed by isoelectric precipitation [17].
Beverage B was prepared according to [15] with some modifications. Pea flour F was added (1:6 w/w) in a dispersion of stabilizing hydrocolloids (0.015% w/w gellan gum (GG), 0.020% w/w xanthan gum (XG)), and ground in a colloid mill (ColMil AD 35-R, Argentina; 1 min, 7,000 rpm, 20°C). The pH (Seven easy pH, Mettler-Toledo GmbH 8603, Switzerland) was adjusted to 9.5 (10 M NaOH) and kept under magnetic stirring (2 h, 25°C). The dispersion was centrifuged (6,000× g, 20 min, 20°C, Beckman Coulter Avanti J-25, USA), and the supernatant was filtered. The filtrate was adjusted to pH = 7.3 using 5 M HCl. Pasteurization (63°C, 30 min) was performed in a water bath (Vicking Masson 1002, Argentina).
The protein content was determined by the micro-Kjeldahl method (Foss Tecator 2040 Digestor unit, SpectraLab Scientific Inc., Markham, ON, Canada) (f = 5.6 g protein/g N, [18]) followed by colorimetric determination [19]; moisture and ash (Oven model 331, Indef®, Córdoba, Argentina) were determined according to [20], lipids according to [21]. A Megazyme kit (Megazyme International Ltd., Wicklow, Ireland) was used to determine total dietary fiber (TDF) [22]. Total carbohydrates were obtained by difference (% total carbohydrate = 100 – % proteins – % lipids – % fibre – % ash – % water). The energy contribution of B was calculated by using Atwater’s factors [23].
Unpasteurized, freshly prepared, and pasteurized B samples were analysed in duplicate at different times (0–21 days) of refrigerated storage (4°C). Samples were serially diluted and plated in different agar media: nutritive agar (NA) incubated for 24 h at 30°C for total mesophilic bacteria; de Man Rogosa, and Sharpe (MRS) agar, incubated for 48 h at 30°C in anaerobiosis for lactic acid bacteria (LAB); and YGC incubated for 48 h at 30°C for yeasts and fungi.
Physical stability of unpasteurized and pasteurized B (before and after refrigerated storage at 4°C) was determined by measurements of dispersed light with a Vertical Scan Analyzer (Quick Scan, Coulter Corp., Miami, FL, USA). The beverage was transferred to the glass tubes used for the measurements in this equipment. The backscattering (BS) of monochromatic light (λ: 850 nm) was determined every 1 min for 40 min as a function of the height of the sample tube (ca. 65 mm), at room temperature (20°C) [24].
The flux behavior of unpasteurized and pasteurized B was analysed in a Discovery HR20 (TA Instruments, New Castle, USA) in its rotational viscometer mode using the smooth plate-plate geometry [15].
The COST-INFOGEST protocol [25] was applied to pasteurized B, obtaining the corresponding digest (DB). The process was performed according to previous works [26] in a bioreactor with a glass jacket connected to a water bath (LAUDA RMT6, Lauda-Königshofen, Germany) at 37°C with agitation (90 rpm oral and gastric phase, 100 rpm intestinal phase, vertical stirrer (Dlab OS20-PRO20L, Senai, Malaysia)). A digestion reagent blank (RB) was prepared identically but in the absence of the sample. Flour (F) and protein isolate (I) were also digested obtaining DF and DI, respectively.
Free amino groups were measured by the 2,4,6-trinitrobenzene sulfonic acid (TNBS) method. HD was calculated [27].
Freeze-dried samples were dispersed in sample buffer (0.0625 mol/L Tris-HCl, 2% SDS, 10% v/v glycerol, pH = 8.8) and centrifuged before loading in the gel. Separating and stacking gels (120 and 40 g/L acrylamide, respectively) were used. Runs were carried out in a Mini Protean II Dual Slab Cell (Bio-Rad, California, USA) at room temperature, applying a constant current (30 mA/gel). Gels were stained with Coomasie Brilliant Blue R-250 (1 g/L) [28].
Suspensions (20 mg/mL) of freeze-dried samples in PBS (1.5 mmol/L KH2PO4, 138 mmol/L NaCl, 3 mmol/L KCl, 8.1 mmol/L Na2HPO4, pH = 7.4) were prepared by agitation at 500 rpm (1 h, 37°C) (Termomixer, Eppendorf, Hamburg, Germany) followed by centrifugation (10,000× g, 10 min, room temperature, Hermle, Labortechnik GmbH, Germany). The supernatants were separated, forming the Bs, DBs, and RBs fractions, and the soluble protein concentration was determined by the Lowry method [29].
PBS-soluble fractions were analyzed in an ÄKTA purifier (GE Healthcare, Illinois, USA) using a molecular exclusion column. Superdex Peptide 10/300 GL (GE Healthcare) (exclusion limit: 10 kDa; separation range: 0.1–7 kDa) was calibrated with blue dextran (exclusion volume Vo = 7.60 mL), aprotinin (6.5 kDa), vitamin B12 (1.35 kDa) and hippuric acid (0.18 kDa) (log MM = 4.84–3.30 × Kav, where Kav = (Ve – Vo) / (Vt – Vo) (Ve: elution volume; Vo: void volume; Vt: total volume, 24 mL)). Samples were filtered by a 0.45 µm nylon filter, 200 µL of sample was loaded, and eluted with PBS buffer at 0.5 mL/min. Detection at 210 nm was performed.
Freeze-dried B, DB, and RB were extracted according to a previous optimization in our laboratory [30]. Ultrasound-assisted extraction (UAE) was performed in a VCX 750 ultrasonic processor (Sonics & Materials Inc., Newtown, USA) by using 60:40 ethanol/water as solvent and the following conditions: 15 min, 40% amplitude. The extractions were carried out in an ice bath to avoid excessive increases in temperature, which was maintained in all cases below 42°C. The extracts were centrifuged (Hermle, 5 min, 10,000× g, room temperature). The supernatants were evaporated (30°C, Concentrator plus/Vacufuge® plus, Eppendorf, Hamburg, Germany) and solubilized in PBS buffer, obtaining the Be, DBe, and RBe fractions.
TPC of Be, DBe, and RBe was determined using the Folin-Ciocalteu method [31]. A standard curve was made with gallic acid (0–0.06 mg/mL) in PBS buffer. Results were expressed as mg gallic acid equivalent (GAE)/mL and as mg GAE/g sample in dry base (d.b.).
For the determination of the qualitative and quantitative profiles of the PCs, dry extracts were dissolved in the initial mobile phase of the chromatographic method at the time of analysis. Separation and determination of PCs was performed in a high-performance liquid chromatography coupled with diode-array and fluorescence (HPLC-DAD-FLD) detectors (Dionex Ultimate 3000 system, Dionex Softron GmbH, Thermo Fisher Scientific Inc., Germering, Germany) and a reversed-phase Kinetex C18 column (3.0 mm × 100 mm, 2.6 mm; Phenomenex, Torrance, California, USA). The software Chromeleon 7.1 was used to control the run and to process the data. The list of PC determined, chromatographic, and detection conditions were those reported by [32], with little modifications [30].
The antioxidant activity of the PBS-soluble fractions (s) and the ethanol extracts (e) of B and DB (different dilutions) was evaluated.
ORAC was measured following the previous method [33]. The fluorescence intensity (λexc: 485 nm, λem: 535 nm) was read every minute in a SYNERGY HT– SIAFRT™ multidetection microplate reader (Biotek Instruments, Agilent, California, USA) to obtain the fluorescein-decay curve and the area under the curve (AUC). A blank without AAPH was included, and the % scavenging calculated as: %ROO· scavenging = [(AUCS – AUCNC) / (AUCB – AUCNC)] × 100; where S: sample, B: blank, NC: negative control. Scavenging % was plotted versus concentration, and the concentration that inhibits 50% of radicals (IC50) was obtained. Trolox (6.25–75 μmol/L) was used as a reference compound.
ABTS•+ was measured according to [34]. Trolox (0.05–0.20 mmol/L) was used as the reference compound. The % inhibition of the radical was calculated as [(AbsB0 – AbsS15) – (AbsB0 – AbsB15) × 100] / AbsB0; where AbsB0 and AbsB15 refer to the absorbance of the blank at 0 and 15 min, respectively, and AbsS15 refers to the absorbance of the sample at 15 min. The IC50 value was obtained.
Direct soluble fraction (DBd) was prepared by solubilization of lyophilized DB in milliQ water, homogenization (Thermomixer Eppendorf 37°C, 1 h, 500 rpm), and centrifugation (10,000× g, 10 min). To reduce the bile salt content of this fraction and also of the ethanol extract, they were treated with cholestyramine resin (10% w/v), homogenized (Eppendorf Thermomixer, 25°C, 1 h, 500 rpm), and centrifuged (10,000× g, 20 min), obtaining DBb and DBeb fractions, respectively. The supernatant was filtered (0.22 µm) [35].
Caco-2 TC7 cells (passages 51–52) used were from the American Type Culture Collection (ATCC, Manassas, VA, USA; ATCC performs the STR identification (https://www.atcc.org/products/htb-37#detailed-product-information)). Cells are regularly monitored for characteristic morphology and confirmed to be free of mycoplasma contamination (LookOut@ Mycoplasma PCR Detection Kit, Sigma Aldrich MP0035, St. Louis, MO, USA). Also, we work in a way that prevents cross-contamination between cell lines. The growth medium was DMEM (pH = 7.4) supplemented with 15% w/v FCS, 4.5 g/L glucose, 13 mL/L PenStrep, 2 g/L NaHCO3, 0.5 g/L gentamicin, and 1% w/v NEAA. All cell culture experiments were done at 37°C with a 5% CO2 atmosphere. For each determination, cell growth and assay conditions were previously optimized in our lab [16, 36]. DBb and DBeb fractions in different dilutions (direct, 1/5, 1/10, and 1/20 were analyzed). Bioaccessible fractions obtained from DF (DFb) and DI (DIb) were also analyzed for comparison.
Cells were seeded onto 96-well plates with a density of 2.5 × 10⁴ cells/well and incubated for 48 h to confluence. Cytotoxicity of samples was quantified in terms of lactate dehydrogenase (LDH) release to the extracellular medium [37]. Cells were incubated with 100 μL of the sample for 3 h, and the LDH-P UV Unitest kit (1521351, Wiener Lab, Rosario, Argentina) was used. LDH activity (λ: 340 nm) was determined in the supernatants using the microplate reader as: LDH (U/L) = (ΔA/min) × f (f = 4.921, 25°C). The %LDH release was expressed as (LDH / LDHtotal) × 100, where LDHtotal corresponded to the cellular death positive control (DMEM with 3% v/v Triton X-100) [38].
Intracellular ROS content in Caco-2 TC7 cells (2.5 × 10⁴ cells/well) cultured in 96-well plates, treated with 20 μmol/L DCFH-DA, sample, and finally 500 μmol/L H2O2 was determined according to [35]. Fluorescence (λexc: 485 nm, λem: 528 nm) was measured during 3 h (37°C). Control systems were analyzed: C1: H2O2-induced oxidation level (buffer, no antioxidant), C2 (baseline, no H2O2, no antioxidant), C3: intrinsic fluorescence (no DCFH-DA, no sample).
Statistical differences were analyzed by one-way ANOVA and Multiple comparisons. Significant differences (P < 0.05) among mean values were evaluated by the Tukey HSD test (Statgraphics Centurion XVI). All samples were analyzed at least in duplicate.
The production of B involved an alkaline treatment in which starch and other seed components remain insoluble, while proteins are brought into solution [39]. This step also represents the initial stage of the most widely used procedure for producing protein isolates. Following alkaline extraction and filtration, B formed a uniform, yellow-colored suspension (Figure 1A), and no visible changes were observed after pasteurization (Figure 1B). As storage time progressed, sedimentation was observed (Figure 1C), which could be reversed by manual homogenization (Figure 1D). BS values were monitored at different heights of the measuring tube, performing a previous manual homogenization in all cases. The values recorded in both the lower and upper sections of the tube remained unchanged throughout the 40-minute measurement period for samples stored for 0, 7, 14, and 21 days at 4°C, consistently ranging between 20% and 21% at both heights. After longer storage periods (e.g., 60 days), the initial %BS measured was higher than previously recorded, reaching approximately 39% in both sections of the measuring tube. Moreover, during the first 20-minute measurement period, the %BS in the lower section began to rise, suggesting particle sedimentation. As is well known, an increase in BS indicates shifts in the distribution, size, or concentration of suspended particles. Such changes may result from particle aggregation, sedimentation, alterations in physicochemical properties, or microbial activity [15, 40]. Based on these observations, the beverage derived from the protein fraction of pasteurized pea flour—despite exhibiting some settling during storage—can be readily resuspended with simple manual stirring. The beverage retained acceptable physical stability for at least 21 days under refrigerated conditions.
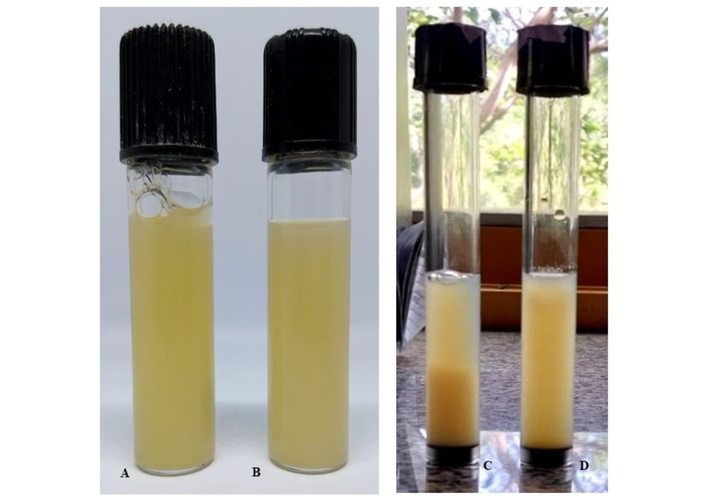
Yellow pea beverage (B). A. Freshly prepared; B. after pasteurization; C. after storage; D. after manual homogenization.
Both unpasteurized and pasteurized B exhibited non-Newtonian behavior characteristic of pseudo-plastic fluids, in which viscosity decreases as shear rate increases because the fluids offer less resistance to flow under stress. Similar pseudo-plastic behavior has been reported by other authors [40] for six different plant-based beverages (soybean, peanut, adlay, adzuki bean, oatmeal, and buckwheat). Apparent viscosity (ηapp) showed no significant differences (P > 0.05) after pasteurization when measured at a shear rate of 10 s–1 (47 ± 14 and 49 ± 14 mPa·s for unpasteurized and pasteurized B, respectively), values comparable to those reported for a commercial coconut drink (47.80 mPa·s) [41]. However, when ηapp was evaluated at 500 s–1, a slight but significant increase (P < 0.05) was observed following pasteurization (Table 1). Additionally, ηapp increased significantly (P < 0.05) over 14 days, with the most pronounced rise occurring during the first 7 days. Afterward, a small but significant decrease (P < 0.05) was noted at 21 days.
Viscosity, physical and microbiological properties of unpasteurized and pasteurized, and stored yellow pea beverage.
| Sample/Time (days) | Viscosity (mPa·s)* | pH | Microbial count (log CFU/g) | |||
|---|---|---|---|---|---|---|
| MRS | NA | YGC | ||||
| Unpasteurized B | 4.311 ± 0.006α | 7.31 ± 0.02β | nd | nd | nd | |
| Pasteurized B | 0 | 4.381 ± 0.005α | 7.31 ± 0.02β | nd | nd | nd |
| 7 | 7.76 ± 0.04β | 7.27 ± 0.01β | nd | nd | nd | |
| 14 | 8.48 ± 0.09δ | 7.29 ± 0.01β | nd | nd | nd | |
| 21 | 8.1 ± 0.1γ | 6.53 ± 0.02α | nd | 7.15 ± 0.08 | nd | |
Different letters in the same column indicate significant differences (P < 0.05) among all groups in the table. *: Calculated at a shear rate of 500 s–1. nd: not detectable at 10 CFU/g.
Regarding the microbiological behavior of the unpasteurized B, no colonies were detected on any of the three media tested, despite the product not undergoing heat treatment. The initial dispersion of F used to prepare B contained its own microbiota, consisting mainly of mesophilic bacteria at approximately 2.5 × 10³ CFU/g F, with LAB not detected, and fungi/yeasts at about 2.3 × 101 CFU/g F. The absence of detectable microorganisms in B (detection limit: 10 CFU/g) may be associated with the alkaline treatment (pH 9.5) applied during its preparation. Alkaline environments, much like acidic ones, impose stress on bacteria, which must maintain a cytoplasmic pH compatible with proper protein function and deploy various adaptive responses. Although many bacteria tolerate external pH values between 5.5 and 9.0, exposure to alkaline conditions often results in reduced viability [42, 43]. Additionally, the possibility that microorganisms were removed through sedimentation during centrifugation and subsequently retained during filtration—both steps involved in preparing B—cannot be excluded. For pasteurized B, no microbial growth was observed on any medium during the first 14 days of evaluation (Table 1). The lack of growth during this period suggests that the storage conditions (4°C) kept the beverage microbiologically safe. After 21 days of refrigerated storage, although fungi and yeasts remained undetectable, a significant increase in mesophilic bacteria was observed, reaching 1.4 × 10⁶ CFU/g. This rise was accompanied by a moderate but significant decrease in pH (P < 0.05; Table 1). Despite the increase in microbial load and the shift in pH, no noticeable changes in physical stability were detected, as previously described.
The composition of B is presented in Table 2. It corresponded to a drinkable product with a protein level slightly lower than that of cow’s milk and comparable to that of most commercially available plant-based beverages (0.3–3% w/v, [44]). Its fat and carbohydrate contents were low (for reference, in F they are 2% and 55%, respectively), which was expected because these macronutrients remain in the sediment following centrifugation during the preparation of B. Additionally, this process removes a substantial portion of the dietary fiber.
Centesimal composition (g/100 g) of yellow pea flour-based beverage (B) in dry (d.b.) and wet (w.b.) base.
| Sample | Lipids | Protein | Ash | Carbohydrates* | TDF | Moisture |
|---|---|---|---|---|---|---|
| B (d.b.) | 0.59 ± 0.01 | 55.02 ± 0.03 | 7.3 ± 0.3 | 41.6 ± 0.4 | 3.2 ± 0.1 | - |
| B (w.b.) | 0.029 ± 0.001 | 2.73 ± 0.04 | 0.36 ± 0.02 | 2.06 ± 0.07 | 0.16 ± 0.01 | 95.05 ± 0.07 |
*: Carbohydrates were obtained by difference, and the SD value was calculated taking into account this mathematical operation. TDF: total dietary fiber. Values are expressed as the mean ± standard deviation (SD).
The polypeptide profile of sample B was examined by SDS-PAGE and compared with those of F and I, which has been previously analyzed by Cipollone and Tironi [17]. Several bands (1, 3, 4, 6, 7, 9, 10, 11, 13, 15, and 16) showed reduced intensity in B (Figure 2B) relative to F and I (Figure 2A). These included convicilin (band 3), legumin (band 4), and both the acidic and basic subunits of legumin (bands 7 and 13). In contrast, bands 2, 5, and 8—corresponding to vicilin and its subunits—remained unchanged. In addition, B showed the appearance of new molecular species (not present in F or I) such as some of high molecular weight indicated at the top of the lane (circled in Figure 2B) and probably others of lower molecular mass (especially in the < 30 kDa range, and bands 12 and 14—primarily albumins) that enter the gel, which could decrease the resolution of the bands and produce a “spraying” effect. The observed changes may be attributed to: 1. Protein loss during the preparation of B, which involves alkaline solubilization and filtration; for example, band 10 (< 30 kDa) also decreased in sample I (Figure 2A). 2. Aggregate formation, including aggregates that remain soluble in the electrophoresis sample buffer, as indicated by the material accumulating at the top of the gel in B. The presence of insoluble aggregates that fail to enter the gel cannot be excluded.
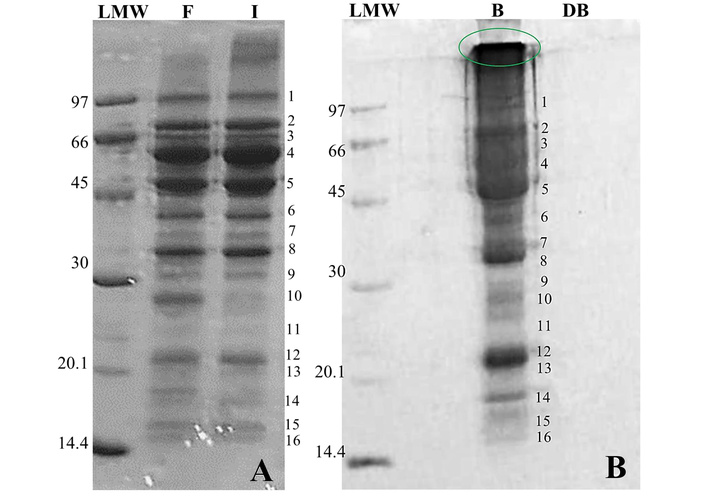
Electrophoresis SDS-PAGE of samples solubilized in electrophoresis buffer (kDa). A. Yellow pea flour (F) and protein isolate (I). B. Yellow pea flour-based beverage (B); gastrointestinal digest from the beverage (DB). LMW: low molecular weight standard.
After the SGID process, the SDS-PAGE profile of DB (Figure 2B) showed the absence of detectable bands (> 14 kDa), including the aggregates observed in sample B. Although the presence of remaining proteins in quantities undetectable by Coomassie-Blue staining (< 50 ng) cannot be ruled out, this result suggests that the proteins and peptides originally present in B were extensively hydrolyzed by the digestive enzymes. This outcome is consistent with the degree of proteolysis (HD) measured by the TNBS method, which was 49 ± 4%. This value was higher than those recorded for DF and DI (36% and 37%, respectively).
Protein contents in the PBS-soluble fractions (Bs and DBs) were measured (Table 3). The low protein solubility observed in sample B may be due to the formation of aggregates between polypeptides or with gums, which become insoluble upon centrifugation. SGID caused a significant increase (P < 0.05) in both soluble protein content (Table 3) and protein solubility in DBs.
Protein solubility, soluble protein content, and antioxidant activity (ORAC and ABTS assays) of different fractions from pea flour-based beverage (B) and its gastrointestinal digest (DB).
| Sample | Soluble protein (SP) (mg/mL) | Protein solubility (g SP/100 TP) | ORAC IC50 (mg/mL) | ABTS IC50 (mg/mL) |
|---|---|---|---|---|
| Bs | 1.7 ± 0.2α | 18.06 ± 0.01α | 0.27 ± 0.07β | 1.8 ± 0.1γ |
| DBs | 3.2 ± 0.8αβ | 83 ± 13γ | 0.025 ± 0.004αA | 0.19 ± 0.02αA |
| DBd | 3.7 ± 0.8β | 94.4 ± 0.1γ | 0.025 ± 0.003αA | 0.4 ± 0.1αβAB |
| DBb | 2.0 ± 0.2α | 51.7 ± 0.1β | 0.048 ± 0.006αB | 0.7 ± 0.1βB |
s: PBS-soluble fraction; d: direct soluble fraction; b: bioaccessible fraction (after cholestyramine treatment). Means followed by different superscript letters indicate significant differences between the groups (P < 0.05). Repeated superscript letters indicate that the means were not significantly different (P > 0.05). Greek letters: Tukey test, all samples; Capital letters: Tukey test, among DBs, DBd and DBb.
The PBS-soluble fractions were analyzed by size-exclusion FPLC (Superdex Peptide 10/300 GL column). In Bs, a marked reduction in the Vo peak (> 10 kDa) was detected compared with Fs, along with decreases in peaks 2, 3, and 4 (Figure 3A), indicating a loss of soluble molecules during the production of B. A new peak corresponding to very low molecular-weight species (peak 5) also emerged in Bs. Relative to Is, Bs displayed a narrower molecular-weight distribution in peak 1 (> 10 kDa) and a higher proportion of low-molecular-weight species (peaks 3, 4, and 5). DBs (Figure 3B) clearly reflected enzymatic activity during SGID, evidenced by the reduction in peak 1 and the appearance of new peaks with molecular weights < 6.5 kDa.
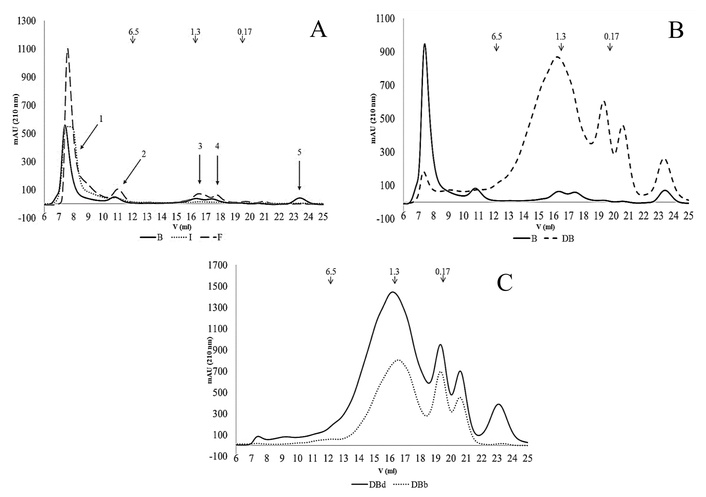
Gel filtration chromatograms (FPLC) using a Superdex Peptide 10/300 GL column (optimal separation range < 10 kDa) and normalized by the protein concentration. A. PBS-soluble fraction from yellow pea beverage (B) in comparison with flour (F) and protein isolate (I). B. PBS-soluble fraction from B in comparison with its gastrointestinal digest DB. C. Direct soluble fraction from DB (DBd) in comparison with this fraction after cholestyramine treatment (DBb). Molecular weight (kDa) markers are shown.
Following SGID, a direct soluble fraction (DBd) was also obtained. Considering that bile salts are known to exhibit cytotoxic and oxidative effects [16, 45], a treatment with cholestyramine was performed to yield the so-called “bioaccessible” fraction (DBb). As shown in Table 3, protein concentration presented no significant difference (P < 0.05) between DBd and DBs. However, DBb exhibited a notable decrease in soluble protein content, accompanied by a reduction of compounds across the molecular weight range in the gel filtration chromatograms (Figure 3C). Specifically, peak 1 was minimal in DBd and absent in DBb; additionally, DBb displayed a lower proportion of molecules with MW < 6.5 kDa and the disappearance of molecules smaller than 0.17 kDa (peak 2).
An initial assessment of the antioxidant activity of Bs, DBs, DBd, and DBb was carried out using two approaches: the ORAC and ABTS•+ scavenging assays, with IC50 values determined (Table 3). Using the ORAC method, Bs showed an IC50 value comparable to those reported for Fs and Is (0.24 ± 0.08 and 0.31 ± 0.02 mg protein/mL, [26]), suggesting that alterations in polypeptide composition of B did not affect this activity. In contrast, the SGID process led to a tenfold reduction (P < 0.05) in IC50, indicating the release of bioactive compounds, such as previously inactive peptides. This enhancement was greater than that observed for DFs (IC50 = 0.078 ± 0.008 mg protein/mL, approximately threefold higher than Fs) and DIs (IC50 = 0.068 ± 0.001 mg protein/mL, approximately 4.5-fold higher than Is) [26].
No significant differences (P > 0.05) were observed between the IC50 values of DBs and DBd. However, treatment of DBd with cholestyramine to obtain the DBb fraction resulted in a significant reduction (P < 0.05) of nearly 50% in ORAC antioxidant potency. A similar pattern was observed for the DIb and DFb. Notably, the IC50 value of DBb was approximately six times lower than that of DFb (0.28 ± 0.09 mg protein/mL) and 2.5 times lower than that of DIb (0.12 ± 0.01 mg protein/mL), indicating a higher antioxidant (ORAC) capacity of the aqueous soluble fraction of the DB. This trend aligns with the findings of [16], who reported higher ORAC values for amaranth beverage digests compared to the corresponding flour and protein isolate. SGID also led to an increase in antioxidant activity as measured by the ABTS method. DBs exhibited an IC50 value approximately one-tenth that of Bs. Moreover, although treatment with cholestyramine showed a tendency to reduce potency, the change was not statistically significant (P > 0.05) (Table 3).
Cellular assays were carried out to determine the capacity of aqueous soluble DB to inhibit intracellular ROS. First, the cytotoxicity on Caco2-TC7 cell cultures of DBb and RBb was evaluated.
As noted earlier, bile salts have the potential to induce cytotoxicity and promote cellular oxidation. For DBb, cytotoxicity was influenced by sample dilution; however, none of the tested concentrations caused significant LDH release, suggesting minimal impact on cell integrity (Table 4). In the case of RBb, cytotoxicity also varied with dilution, with LDH release remaining low—comparable to that observed for undiluted DBb—at a 1/20 dilution.
Cytotoxicity as LDH activity and intracellular ROS scavenging in Caco2-TC7 cells treated with bioaccessible fractions (DFb, DIb, DBb and RBb).
| Sample | Dilution | SP (mg/mL) | LDH (% cytotoxicity) | % ROS inhibition |
|---|---|---|---|---|
| DFb | - | 20 | 19 ± 1β | 92 ± 1δ |
| 1/5 | 4 | 16 ± 2αβ | 87 ± 2γδ | |
| 1/10 | 2 | 16 ± 5αβ | 80 ± 4βγ | |
| 1/20 | 1 | 14 ± 1α | 58 ± 5α | |
| DIb | - | 8.3 | 9 ± 1α | 92 ± 2δ |
| 1/5 | 1.66 | 8 ± 2α | 86 ± 1γ | |
| 1/10 | 0.83 | 8 ± 2α | 74 ± 3β | |
| 1/20 | 0.42 | 7 ± 4α | 59 ± 4α | |
| DBb | - | 2 | 27.9 ± 0.1δ | 76 ± 2δ |
| 1/5 | 0.4 | 1.0 ± 0.1α | 64 ± 1γ | |
| 1/10 | 0.2 | 6 ± 1β | 38 ± 2β | |
| 1/20 | 0.1 | 14 ± 3γ | 19 ± 6α | |
| RBb | - | 0.4 | 62 ± 1δ | - |
| 1/5 | 0.08 | 43 ± 1γ | - | |
| 1/10 | 0.04 | 31 ± 4β | - | |
| 1/20 | 0.02 | 16 ± 2α | - |
SP: soluble protein. Means followed by different superscript letters indicate significant differences between the dilutions of each sample (P < 0.05). Repeated superscript letters indicate that the means were not significantly different (P > 0.05).
The intracellular ROS levels were measured after exposing cells to the bioaccessible fractions, using H2O2 as an oxidative inducer [36]. In the basal control system (C2), ROS levels were half of those in C1, meaning that H2O2 treatment roughly doubled the basal cellular ROS content. Pretreatment with RBb, DFb, DIb, and DBb caused a substantially higher increase in fluorescence compared to C1. This phenomenon has been previously reported [16] and is likely related to the presence of bile acids/salts, which can induce ROS production in non-polarized Caco-2 cells [45]. To calculate the % inhibition for the different dilutions of DBb, the corresponding dilutions of RBb were used as the maximum oxidation control, and the percentage of viable cells in each sample was also considered. Similar to DFb and DIb, DBb exhibited a concentration-dependent inhibition of intracellular ROS based on the soluble polypeptide/peptide content within the tested range (Table 4). From the dose-response curve, the estimated IC50 values were 0.3 mg protein/mL for DBb, 0.26 mg protein/mL for DIb, and 0.62 mg protein/mL for DFb. These results suggest that DBb has a neutralizing potency comparable to DIb and greater than that of DFb.
The TPC content of the Be extract was 110 ± 1 µg GAE/mL, corresponding to 2.4 mg GAE/g d.b. (Table 5), higher than those previously obtained for Fe and Ie (0.68 and 0.98 mg GAE/g d.b. [30]).
TPC and antioxidant activities (ORAC, ABTS) of ultrasound-assisted extraction (UAE) extracts from the yellow pea flour-based beverage (Be), their simulated gastrointestinal digest (DBe), and their bioaccessible fraction (DBeb).
| Sample | TPC (µg GAE/mL) | ORAC IC50 (µg GAE/mL) | ABTS IC50 (µg GAE/mL) |
|---|---|---|---|
| Be | 110 ± 1α | 1.0 ± 0.2α | 19 ± 2β |
| DBe | 324 ± 4γ | 1.9 ± 0.4α | 6 ± 3α |
| DBeb | 163 ± 4β | 1.2 ± 0.2α | 7 ± 2α |
Means followed by different superscript letters indicate significant differences between the groups (P < 0.05). Repeated superscript letters indicate that the means were not significantly different (P > 0.05).
HPLC-DAD-FLD profiling of Be revealed some differences compared to Fe and Ie (Table 6). Compared with Fe, Be exhibited higher levels of OH-tyrosol, phenolic acids, and stilbenes, while flavonoid concentrations were similar. In contrast, when compared with Ie, Be showed increased levels of OH-tyrosol, phenolic acids, and flavonoids, but a reduction in total stilbene content. All PCs detected in Fe and Ie—namely OH-tyrosol, procyanidin B1, (+)-catechin, trans-resveratrol, genistein, gallic acid, p-coumaric acid, and syringic acid—were present at higher concentrations in Be. Moreover, Be contained additional compounds not detected in Fe or Ie, including sinapic acid and the flavonoids fisetin, quercetin, quercetin-3-galactoside, procyanidin B2, genistin, and (–)-epigallocatechin gallate (Table 6).
Phenolic compounds (PCs) profile of the yellow pea beverage (B) and their simulated gastrointestinal digest (DB).
| Phenolic compound | Sample | |
|---|---|---|
| B | DB | |
| OH-Tyrosol | 145 ± 1 | 99.9 ± 0.4 |
| Phenolic acids | ||
| Gallic acid | 23.1 ± 0.4 | nd |
| Syringic acid | 36 ± 2 | nd |
| Synapic acid | 24 ± 3 | nd |
| p-coumaric acid | 10.67 ± 0.01 | 2.39 ± 0.08 |
| Ferulic acid | 0.39 ± 0.01 | nd |
| Total phenolic acid | 93 ± 1 | 2.39 ± 0.08 |
| Stilbenes | ||
| trans-resveratrol | 38.6 ± 0.4 | 125 ± 3 |
| Total stilbenes | 38.6 ± 0.4 | 125 ± 3 |
| Flavonoids | ||
| Procyanidin B1 | 22.0 ± 0.3 | 22.6 ± 0.9 |
| Procyanidin B2 | 6.9 ± 0.4 | 8.4 ± 0.9 |
| Quercetin-3-galactoside | 5.3 ± 0.2 | nd |
| Kaempferol-3-glucoside | nd | 55 ± 5 |
| Genistein | 5.53 ± 0.01 | nd |
| Genistin | 1.67 ± 0.03 | nd |
| (+)-catechin | 6.5 ± 0.2 | 14 ± 2 |
| (–)-epigallocatechin galate | 9.28 ± 0.01 | 63.3 ± 0.2 |
| Naringenin | nd | 28 ± 1 |
| Hesperetin | nd | 23 ± 4 |
| Myricetin | nd | 18.23 ± 0.01 |
| Quercetin | 24.6 ± 0.2 | nd |
| Fisetin | 0.81 ± 0.01 | nd |
| Total flavonoids | 82.7 ± 0.5 | 233 ± 11 |
| Total | 360 ± 1 | 461 ± 8 |
nd: not detected. Contents are expressed as µg/g B d.b.
After SGID, DBe exhibited a significant (P < 0.05) and marked increase in TPC compared to Be (Table 5). The TPC reached 324 µg GAE/mL (18 mg GAE/g d.b.), surpassing the values previously reported for DFe and DIe (5.04 and 13.5 mg GAE/g d.b., respectively [30]). HPLC-DAD-FLD analysis of DBe confirmed that its quantified PC content was higher than that of Be. A similar trend was observed for DIe, whereas DFe showed a decrease in PC content compared to Fe. Several PCs present in Be were not detected in DBe; specifically, all phenolic acids were lost after SGID except for p-coumaric acid, which remained at a reduced concentration. With regard to flavonoids, quercetin-3-galactoside, genistein, genistin, quercetin, and fisetin were absent in DBe, whereas kaempferol-3-glucoside, naringenin, hesperetin, and myricetin were newly detected in DBe but were not present in Be. These results suggest a possible release of some compounds during SGID as well as different behaviors of the different compounds. The flavonoids have different chemical structures, which is associated to their interaction/bond with the food matrix and their abilities to be released during the digestion process. Thus, bioaccessibility is related to how the non-extractable polyphenols are released or not from each matrix during the specific conditions of in vitro digestion.
Following cholestyramine treatment, TPC decreased significantly (DBeb, Table 5). TPC was also measured in RBe and RBeb. RBe showed a value of 22 ± 2 µg GAE/mL, which is approximately 15 times lower than that observed in DBe (Table 5). This low value likely reflects the presence of other Folin-reactive compounds, such as amino acids or peptides, rather than polyphenols, due to the animal origin of all digestion reagents used. In RBeb, no Folin-reactive compounds were detected.
The antioxidant activities of Be, DBe, and DBeb were evaluated using both the ORAC method and the ABTS•+ assay. While SGID led to an increase in TPC, the ORAC activity of these compounds remained unchanged, as no significant differences (P > 0.05) were observed between the IC50 values of Be and DBe (Table 5). A similar pattern had previously been reported for Fe and DFe [30]. Likewise, DBeb showed no significant difference (P > 0.05) compared to DBe. In contrast, ABTS•+ scavenging showed a significant increase (P < 0.05) in antioxidant activity following SGID, which was unaffected by cholestyramine treatment (Table 5). A comparable trend had been partially observed for DIe, which exhibited higher activity than Ie, while no significant differences were noted between Ie and DIeb [30].
The cytotoxicity of DBeb and RBeb was assessed based on %LDH release (Table 7). Similar to the water-soluble fraction, RBeb exhibited high cytotoxicity (74%), likely due to residual bile salts remaining after cholestyramine treatment, which decreased upon dilution of the sample. No TPC was detected in this fraction. DBeb showed a substantial but lower cytotoxicity (47%), which also declined with sample dilution. These findings indicate that the cytotoxicity of the bioaccessible fractions is primarily attributable to residual digestion reagents and is mitigated due to the presence of PCs (or other bioactive components) in DBeb, consistent with observations reported for DFe and DIe [29].
Cytotoxicity as LDH activity and intracellular ROS scavenging in Caco2-TC7 cells treated with bioaccessible fractions from ethanol extracts (DBeb and BReb).
| Sample | Dilution | TPC (µg GAE/mL) | LDH (% cytotoxicity) | % ROS inhibition |
|---|---|---|---|---|
| DBeb | - | 163 | 47 ± 7γ | 73 ± 4δ |
| 1/5 | 32.6 | 23 ± 2β | 55 ± 3γ | |
| 1/10 | 16.3 | 7.3 ± 0.1α | 47 ± 2β | |
| 1/20 | 8.15 | 11 ± 2α | 21 ± 1α | |
| BReb | - | nd | 74 ± 2γ | - |
| 1/5 | nd | 55 ± 8β | - | |
| 1/10 | nd | 31 ± 2α | - | |
| 1/20 | nd | 23 ± 4α | - |
Means followed by different superscript letters indicate significant differences between the groups (P < 0.05). Repeated superscript letters indicate that the means were not significantly different (P > 0.05).
DBeb demonstrated a significant inhibition of intracellular ROS (73%, Table 7), although it exhibited a relatively high cytotoxicity of 47%. In comparison, DFeb showed slightly different results, with a lower TPC (141 µg GAE/mL), a higher cytotoxicity of 56%, and a ROS inhibition of 66%. On the other hand, DIeb presented a higher PC concentration (356 µg GAE/mL), lower cytotoxicity (33%), and a strong intracellular ROS inhibition of 83%. The IC₅₀ values were 30.1 µg GAE/mL for DBeb, 42 µg GAE/mL for DFeb, and 17 µg GAE/mL for DIeb.
A yellow pea beverage with a protein content close to that of cow’s milk and low starch and lipid levels was prepared. The energy content of the beverage was 17.87 kcal per 100 g, lower than that reported for the amaranth-based beverage (23.1 kcal) [16] and within the range reported for five almond drink varieties (15–25 kcal) [44]. Analysis of the macronutrient contribution to total energy showed that fats accounted for only 1.5%, while proteins and carbohydrates contributed the majority, at 61.1% and 37.4%, respectively.
The product remained physically and microbiologically stable for at least 14 days under refrigerated storage following pasteurization. However, despite the absence of detectable microorganisms during this period, the beverage’s pH (> 4.5) does not ensure microbiological safety, as it may still support the growth of pathogens. The potential presence of Clostridium botulinum spores, which could germinate and produce toxins during storage, cannot be ruled out. Therefore, ongoing microbiological monitoring is required to confirm the absence of pathogenic microorganisms and spores and ensure regulatory compliance. If pathogens or spores are detected, the heat treatment may need adjustment, or suitable preservatives may need to be added.
Regarding protein safety, evaluation is critical for novel foods. In addition to microbial toxins, certain plant proteins may be harmful, and protein toxicity should be assessed using in silico, in vitro, and/or in vivo methods [46]. However, studies indicate that pea protein isolates and hydrolysates show no acute or sub-chronic toxicity at high doses in animal models [47, 48]. Proteins that are identical or similar to those already in the food supply are considered Generally Recognized as Safe (GRAS) by the US FDA and do not require additional hazard characterization [47].
According to the electrophoresis results, B presented some protein aggregates. Similarly, partial or total decrease in bands in the SDS-PAGE profiles of amaranth beverages has been reported [15, 16], concluding that the addition of gums and the heat treatment could induce the formation of aggregates, some of which could be soluble in the sample buffer and others not. The viscosity increments registered could be related to the formation of particles with a larger hydrodynamic radius, for example, due to the formation of aggregates between proteins or between proteins and gums during refrigerated storage. When proteins and polysaccharides are mixed in water, thermodynamic incompatibility or compatibility can occur, in which repulsive and attractive electrostatic interactions are the main driving forces. Associative electrostatic interactions can produce structures such as gels, coacervates, or complexes, depending on environmental conditions (pH, protein-polysaccharide ratio, and total solids content) [49]. These facts also potentially explain the sedimentation of the beverage observed during storage.
Electrophoresis results indicated that B contained some protein aggregates. Similarly, previous studies have reported partial or complete reductions in SDS-PAGE bands in amaranth beverages [15, 16], suggesting that the addition of gums and heat treatment may promote aggregate formation, some of which are soluble in the sample buffer while others are not. The observed increases in viscosity could be linked to the development of particles with a larger hydrodynamic radius, potentially arising from protein–protein or protein–gum aggregation during refrigerated storage. When proteins and polysaccharides are combined in water, thermodynamic compatibility or incompatibility may occur, primarily driven by repulsive and attractive electrostatic interactions. These associative electrostatic interactions can lead to the formation of structures such as gels, coacervates, or complexes, depending on factors such as pH, protein-to-polysaccharide ratio, and total solids content [49]. These mechanisms may also account for the sedimentation observed in B during storage.
The analysis of the protein fraction of B, before and after SGID, revealed high digestibility and bioaccessibility. It also indicated that the processing used to produce B contributed to enhancing the digestibility of pea proteins (compared to F or I), even in the presence of aggregate formation, which could be nutritionally advantageous. Furthermore, the processing to obtain B added to the SGID process increased the ability of all aqueous soluble fractions to neutralize ROO• and ABTS•+ radicals. This suggests that the production process—particularly the heat treatment, which denatures proteins and improves digestibility—enhanced the non-cellular antioxidant activity of the digestion products relative to the original ingredients.
Bile salt concentrations in the small intestine rise to ~20 mM in the fed state. To simulate this, the INFOGEST protocol recommends adding fresh or frozen bile, or bile extract (preferably bovine), during the intestinal phase to achieve ~10 mM bile salts [50]. In our laboratory (unpublished data), bile levels measured by the Diazyme Total Bile Acids Assay in DF and DI samples ranged from 11–16 mM, while the bile remaining in bioaccessible fractions (soluble fractions treated with cholestyramine) was consistently 0.23 mM across samples. Bile salt cytotoxicity in Caco-2 cells is well established and salt-dependent. MTT assays showed deoxycholate as the most toxic (IC50 = 0.4 mM), taurodeoxycholate, cholate, and glycodeoxycholate as moderately toxic (IC50 = 4–6 mM), and taurocholate as least toxic (IC50 = 15 mM) [51]. Sodium deoxycholate also reduces mitochondrial membrane potential and induces cytotoxicity at concentrations from 0.5 to 10 mM [52]. Kondrashina et al. [50] recommended diluting gastrointestinal digests to achieve a bile concentration of ~1 mM for intestinal cell absorption assays. Our bioaccessible fractions exhibited low bile salt levels, yet still induced some cytotoxicity. Nevertheless, DBb, DFb, and DIb reduced cytotoxicity in Caco-2 TC7 cultures compared to RBb. DBb also decreased intracellular ROS levels, showing similar potency to DIb and greater than DFb. Since the initial digestion reagent concentrations were the same across RB, DF, DI, and DB, these results suggest that pea digestion products may protect cells, potentially through antioxidant effects or by interacting with bile salts, reducing their concentration and/or availability. Compounds in DF, DI, or DB—such as peptides, polypeptides, and fiber—may bind bile salts, promoting their removal during soluble fraction preparation or cholestyramine treatment.
Folin-Ciocalteau and HPLC analyses showed that the processing and thermal treatment used to obtain B increased the concentration, release, and/or extractability of PCs. SGID further affected the PCs, causing chemical modifications and instability, as well as releasing additional compounds. Post-digestion, PCs content increased, with enhanced ABTS•+ activity, while ORAC activity remained unchanged. These differences likely reflect the varying sensitivities and mechanisms of the antioxidant assays. Likewise, “milk” from two bean varieties subjected to INFOGEST SGID exhibited increased PC content and variable responses in CUPRAC and DPPH assays [8].
The intracellular antioxidant activity of the DBb fraction was higher than DFb but lower than DIb, likely due to the thermal treatment in process B. The PCs profile shifted after SGID. In DB, the main phenolic acid was p-coumaric acid, a phenylpropanoic acid derived from tyrosine and phenylalanine, whose antioxidant activity is attributed to its phenolic hydroxyl group [53] and whose intestinal absorption has been confirmed in vivo [54]. In DBe, flavanones such as naringenin, hesperetin, and myricetin were detected, though the dominant compounds were trans-resveratrol, OH-tyrosol, (–)-epigallocatechin gallate, and kaempferol-3-glucoside, all with notable bioactivities.
Trans-resveratrol exhibits antioxidant, anti-inflammatory, estrogenic, and anticancer effects, and is present in organs as glucuronide and sulfate conjugates [55, 56]. This compound increased by more than 3 times after SGID. Previously, our group reported increases in trans-resveratrol in gastrointestinal digests of yellow pea flour (but not in the protein isolate) [30], although the levels detected were lower in both the original matrix and—even more so—in the gastrointestinal digest. This again demonstrates the effect of the matrix and processing on the extractability and bioaccessibility of the compounds. OH-tyrosol acts as a free radical scavenger, metal chelator, and activator of cellular antioxidant defenses, with cardioprotective, anticancer, neuroprotective, and antimicrobial effects [57]. Kaempferol-3-glucoside (astragalin) demonstrates antioxidant, anti-inflammatory, anticancer, neuroprotective, and cardioprotective properties, with in vivo evidence for oxidative stress prevention [58]. (–)-Epigallocatechin gallate shows antioxidant, anti-inflammatory, antiangiogenic, antiproliferative, proapoptotic, and antimetastatic activities, neutralizing ROS via hydrogen atom transfer, electron transfer, and metal chelation [59]. We cannot rule out the presence of other PCs in B and DB that could not be detected with our methodology.
Although flavonoids generally have low bioavailability, dietary flavonols are known to provide various health benefits, including antioxidant, cardioprotective, antibacterial, antiviral, and anticancer effects [60, 61]. B, therefore, represents a promising source of potentially bioaccessible polyphenols, as indicated by in vitro assays. In the present study, B exhibited both a higher initial PCs content and greater protection against SGID compared to F, while showing closer similarity to I. These effects may stem from the combination of alkaline treatment (enhancing PC solubility), hydrocolloid presence, and thermal processing, which may promote hydrophobic interactions between PCs and proteins, forming complexes more resistant to SGID. Gel filtration chromatography of Be revealed two major peaks corresponding to molecules > 6.5 kDa (Figure 4), which were absent in DBe, where smaller molecules (< 6.5 kDa) predominated. This suggests solubilization of non-polyphenolic molecules, such as peptides/polypeptides, before and after SGID. The potential interactions between polyphenols and peptides/polypeptides, and their impact on the composition or particle types in B and DB extracts, will require further in silico and experimental investigation to confirm.
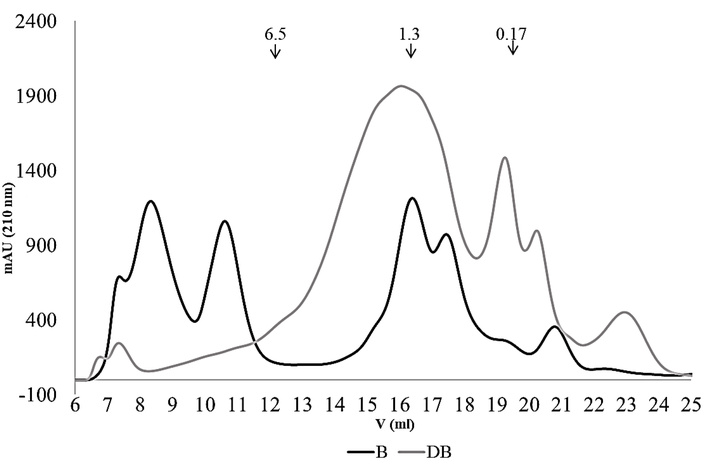
Gel filtration chromatograms (FPLC) using a Superdex Peptide 10/300 GL column (optimal separation range < 10 kDa) of ethanolic fractions resolubilized in PBS from beverage (B) and digested beverage (DB).
A yellow pea beverage with good protein content and low carbohydrate and lipid levels was obtained, physically and microbiologically stable for at least 14 days after pasteurization. Processing improved protein digestibility and protected PCs during gastrointestinal digestion. The bioaccessible fractions showed acellular antioxidant activity and protection against cytotoxicity and oxidative stress in Caco-2 cells, representing a first step in the development of a functional antioxidant beverage.
However, key aspects remain to be addressed: complete verification of safety, optimization of heat treatment and shelf life, sensory evaluation, and possible incorporation of additives to improve acceptability. Finally, confirmation of antioxidant activity will be necessary using other in vitro methodologies and in vivo bioavailability studies of the final product.
AAPH: 2,2´-Azo-bis-(2-methylpropionamidine) dihydrochloride
ABTS: 2,2′-Azinobis-(3-ethylbenzthiazolin-6-sulfonic acid)
AUC: area under the curve
B: beverage
Be: beverage ethanol extract
BS: backscattering
Bs: beverage PBS-soluble fraction
d.b.: dry base
DB: beverage gastrointestinal digest
DBb: bioaccesible fraction of the digested beverage
DBe: ethanol extract of the digested beverage
DBeb: bioaccessible ethanol extract of the digested beverage
DBs: PBS-soluble fraction of the digested beverage
DCFH-DA: 2′,7′-dichlorofluorescindiacetate
DF: flour gastrointestinal digest
DFb: bioaccessible fraction of the digested flour
DFe: ethanol extract of the digested flour
DFeb: bioaccessible ethanol extract of the digested flour
DFs: PBS-soluble fraction of the digested flour
DI: protein isolate gastrointestinal digest
DIb: bioaccessible fraction of the digested protein isolate
DIe: ethanol extract of the digested isolate
DIeb: bioaccessible ethanol extract of the digested isolate
DIs: PBS-soluble fraction of the digested isolate
DMEM: Dulbecco’s modified Eagle medium
F: yellow pea flour
Fe: flour ethanol extract
Fs: flour PBS-soluble fraction
GAE: gallic acid equivalent
GG: gellan gum
HD: protein hydrolysis degree
HPLC-DAD-FLD: high-performance liquid chromatography coupled with diode-array and fluorescence
I: yellow pea protein isolate
IC50: 50 % inhibition concentration
Ie: protein isolate ethanol extract
Is: protein isolate PBS-soluble fraction
LDH: lactate dehydrogenase
ORAC: Oxygen Radical Absorbance Capacity
PC: phenolic compounds
RB: digestion reagents blank
RBb: bioaccessible fraction of the reagent blank
RBe: ethanol extract of the reagent blank
RBeb: bioaccessible ethanol extract of the reagent blank
SDS-PAGE: Sodium Dodecyl Sulfate Polyacrylamide Gel Electrophoresis
SGID: simulated gastrointestinal digestion
TDF: total dietary fiber
TPC: total phenolic content
UAE: ultrasound-assisted extraction
XG: xanthan gum
The authors thank Bioseminis (https://bioseminis.com/) for providing yellow pea seeds and Dr. Fabricio Lareu (technical staff) for their assistance in handling cell cultures.
The authors M.A.C., S.G.F., and V.A.T. are members of the INNOPROT network (Network of Innovation in the processing of plant proteins endemic to Latin America), funded by CYTED (ref. 124RT0164).
MAC: Investigation, Methodology, Formal analysis, Visualization, Writing—original draft, Writing—review & editing. SFGF: Methodology, Formal analysis. AF: Methodology, Formal analysis, Writing—review & editing. VAT: Conceptualization, Methodology, Supervision, Writing—original draft, Writing—review & editing. All authors read and approved the submitted version.
There are no conflicts to declare.
Not applicable.
Not applicable.
Not applicable.
The raw data supporting the conclusions of this manuscript will be made available by the authors, without undue reservation, to any qualified researcher.
Support for this research came from grants X870 from Universidad Nacional de La Plata (UNLP) and PICT-2020-1367 from Agencia Nacional de Promoción Científica y Tecnológica (ANPCyT). The funders had no role in study design, data collection and analysis, decision to publish, or preparation of the manuscript.
© The Author(s) 2026.
Open Exploration maintains a neutral stance on jurisdictional claims in published institutional affiliations and maps. All opinions expressed in this article are the personal views of the author(s) and do not represent the stance of the editorial team or the publisher.
Copyright: © The Author(s) 2026. This is an Open Access article licensed under a Creative Commons Attribution 4.0 International License (https://creativecommons.org/licenses/by/4.0/), which permits unrestricted use, sharing, adaptation, distribution and reproduction in any medium or format, for any purpose, even commercially, as long as you give appropriate credit to the original author(s) and the source, provide a link to the Creative Commons license, and indicate if changes were made.



View: 1282
Download: 34
Times Cited: 0
Busra Sevim ... Evrim Gunes Altuntas


