Original Article

Affiliation:
1Postharvest Technology Division, Bangladesh Agricultural Research Institute (BARI), Gazipur 1701, Bangladesh
Email: biddutdey22@gmail.com
ORCID: https://orcid.org/0009-0000-7953-5689
Affiliation:
1Postharvest Technology Division, Bangladesh Agricultural Research Institute (BARI), Gazipur 1701, Bangladesh
ORCID: https://orcid.org/0000-0002-3851-7094
Affiliation:
1Postharvest Technology Division, Bangladesh Agricultural Research Institute (BARI), Gazipur 1701, Bangladesh
ORCID: https://orcid.org/0000-0001-8507-3054
Affiliation:
1Postharvest Technology Division, Bangladesh Agricultural Research Institute (BARI), Gazipur 1701, Bangladesh
Affiliation:
2Department of Agro Product Processing Technology, Jashore University of Science and Technology, Jashore 7408, Bangladesh
Affiliation:
3Agricultural Statistics and Information & Communication Technology Division, Bangladesh Agricultural Research Institute (BARI), Gazipur 1701, Bangladesh
Affiliation:
4Tuber Crop Research Center, Bangladesh Agricultural Research Institute (BARI), Gazipur 1701, Bangladesh
Explor Foods Foodomics. 2026;4:1010152 DOI: https://doi.org/10.37349/eff.2026.1010152
Received: February 09, 2026 Accepted: April 28, 2026 Published: May 22, 2026
Academic Editor: Ivana Cacciatore, “G. d’Annunzio” University of Chieti-Pescara, Italy
Aim: Sweet potato (Ipomoea batatas Lam.) is a nutritious root crop that remains underexploited. This study aimed to valorize sweet potato as a functional ingredient for biscuit formulation by reducing dependency on refined wheat flour with a focus on evaluating its nutritional value, bioactive phytochemicals, and mineral profile. By using purple-fleshed sweet potato flour (PFSPF) in biscuit recipes, food security and health concerns can be addressed by enhancing dietary intake.
Methods: Biscuits developed with PFSPF in different percentages (10%, 20%, 30%, 40%, and 50%), whereas the control included only wheat flour, were evaluated for physicochemical, nutritional, mineral profile, and sensorial qualities. Sensorial analysis was conducted with 54 participants to evaluate the acceptability, appearance, color, flavor, taste, and texture of the developed biscuits.
Results: Physicochemical analysis of the PFSPF revealed high crude fiber, protein, ash, and carbohydrate, along with bioactive phytochemicals, namely total phenolic content (TPC) (25.07 mg GAE/100 g), total carotenoid content (TCC) (27.90 mg/100 g), and antioxidant activity (DPPH: 43.51%). The PFSPF incorporated biscuits showed that dietary fiber and anthocyanin content increased significantly (p < 0.05), with values ranging from 0.46% to 6.38% and 0.28 to 2.64 mg/100 g, respectively. The TPC and TCC of the developed biscuits ranged from 1.44 to 6.91 mg GAE/100 g and 4.42 to 6.32 mg/100 g, respectively. The mineral profile also proportionally increased in the formulated biscuits. Biscuits fortifying 50% PFSPF (T6) showed more hardness (34.25 N) and the highest energy value (9.08 kcal/100 g). Sensory results indicated that the ideal acceptability level of the formulated biscuits achieved the maximum score for 50% PFSPF (T6) (7.60).
Conclusions: The utilization of PFSPF in biscuit formulation appears to be a promising approach for baking applications, offering more nutritional benefits, including mineral and bioactive phytochemicals, along with a distinctive color, appealing texture, and improved consumer acceptability.
Sweet potatoes (Ipomoea batatas Lam.), belonging to the Convolvulaceae family, are one of the most promising food crops in the world. They have enormous potential because they are nutritionally dense, climate-resilient, and economically viable root vegetables. In terms of quantity produced, sweet potatoes rank seventh in the production of staple foods worldwide, behind wheat, maize, rice, potatoes, barley, and cassava [1]. Being one of the most popular and common food crops worldwide, over 95% of its production is found in developing countries [2]. The annual production of sweet potatoes exceeds 90 MT per year, with the Asian and African states having the largest shares. The root crop is especially significant in Latin America, Oceania, and Southeast Asia. Globally, China is the largest producer of sweet potato cultivation with an estimated total annual production of 51,566,695.46 tons [3]. The other leading sweet potato-producing countries in Asia are India, Bangladesh, Indonesia, Japan, Vietnam, the Philippines, and the Republic of Korea. Bangladesh has been ranked 28th among South Asian countries, and its annual production reached 302,073 tons in 2024 [3]. Basically, sweet potato, a winter-season crop familiar with the Bengali name ‘mistialu’, is planted from October to November and harvested between mid-February and mid-April [4]. In Bangladesh, sweet potatoes are mostly cultivated in sandy soils of river basins, char lands, and coastal areas, and are capable of thriving under drought, low-fertility soils, and changing weather patterns [4].
With various types available in the sweet potato (white, cream, yellow, orange, pink, and red to purple flesh), these tubers are widely cultivated in our country as well as in the world. Sweet potatoes are traditionally consumed by boiling and, in some cases, cooked with other vegetables for their low glycemic index [5]. Many studies have reported the consumption of different parts of sweet potatoes for the prevention of vitamin A malnutrition. Sweet potato, as a strategic crop for enhancing food system resilience and dietary diversity, is recognized for its exceptional nutritional profile. These root crops are highly rich in macronutrients and bioactive compounds, including proteins, dietary fiber, vitamins (such as vitamin C & β-carotene), essential minerals, and phytochemicals such as carotenoids, polyphenols, and anthocyanins [6–9]. Numerous factors contribute to the variability regarding nutrient composition of sweet potatoes, including genetic diversity, cultivars, stage of root maturity, harvest time, geographic location, soil type, varietal diversification, flesh color, postharvest management, pretreatments, processing methods, and other factors [4, 6–11]. Usually, white-fleshed sweet potatoes are an abundant source of starch content, and yellow-fleshed sweet potatoes are a notable source of β-carotene. In contrast, purple-fleshed sweet potatoes are an excellent source of anthocyanins. Besides, sweet potato roots exhibit numerous health benefits, including antioxidant properties, cardioprotective, anti-inflammatory, anti-cancer, anti-diabetic, antimicrobial, and anti-obesity effects, as well as hepatoprotective and immunomodulatory properties [7, 8, 12].
Bangladesh Agricultural Research Institute (BARI) released 18 sweet potato varieties, including a purple-fleshed, anthocyanin-enriched variant (BARI Mistialu-17) that was newly introduced. All the released varieties are typically evaluated across several agro-ecological regions of Bangladesh to assess their adaptability, yield performance, and stability before release. Such evaluations demonstrate that varietal performance and root yield can vary significantly depending on genotype and environmental conditions such as soil type, climate, and location [13]. Furthermore, several factors such as soil fertility, irrigation practices, harvest maturity, drying techniques, and storage conditions may affect the accumulation of nutrients and bioactive compounds (e.g., phenolics and anthocyanins) in the storage roots [14]. The present study investigated the optimum utilization of the selected sweet potato variety in nutritious food product formulations.
Anthocyanins are powerful antioxidants and have been linked to a variety of health benefits, including anti-inflammatory, anticarcinogenic, and immunomodulatory properties, and their potential benefits in regulating blood glucose levels [15]. Purple-fleshed sweet potato variants owe their distinctive color to anthocyanins, pH-sensitive, water-soluble polyphenol substances that account for the characteristic red, blue, and purple pigments. Some purple sweet potato cultivars have illustrated antioxidant levels comparable to those of antioxidant-rich fruits and vegetables like grapes, berries, potatoes, etc. [16, 17]. The bioactivity of these cultivars is determined not only by their total anthocyanin content, but also by the unique anthocyanin profiles present [18].
Despite their nutritional value, sweet potatoes have a short postharvest life because of their high moisture content and ongoing metabolic activity, and are a largely neglected crop. However, the high perishability of raw sweet potatoes poses significant challenges for storage and transportation, particularly in Bangladesh [19]. These problems can be lessened by turning fresh sweet potatoes into shelf-stable products, like flour, which increases their usability, decreases postharvest loss, increases shelf life, and guarantees year-round availability. Several food items, such as bread, cakes, crackers, cookies, biscuits, noodles, and soup, have effectively used sweet potato flour as a partial substitute for wheat flour (WF) [20–26]. This addition enhances the values of food products by preserving color, flavor, and sweetness.
Biscuits are one of the most popular baked items in the world since they are cheap, last a long time, and most people like them [27]. They are easy-to-eat snacks that are commonly manufactured using flour, oil, sugar, and leavening agents [28]. The development of biscuits using sweet potato flour could be a significant step in increasing the use of sweet potatoes and offering consumers nutrient-enriched, value-added products [20]. This value addition not only expands the use of this underutilized crop but also contributes to food security during emergencies such as wars or natural disasters. Because sweet potatoes are an inexpensive and abundant source of carbohydrates, they also hold great promise for reducing dependency on more costly staple crops. The current study aimed to develop and define biscuits enhanced with flour from BARI Mistialu-17, focusing on evaluating their nutritional value, bioactive properties, mineral profile, and sensory qualities. Incorporating sweet potato flour into biscuit recipes may enhance dietary intake and lower postharvest losses, thereby tackling issues related to food security and health.
Freshly harvested purple-fleshed sweet potatoes (60 kg) were collected from farmers’ fields in Kapasia, Gazipur, Bangladesh (24°6′0″ N, 90°34′14.88″ E) and transported to the packhouse of the Postharvest Technology Division, Bangladesh Agricultural Research Institute (BARI), Gazipur. Upon arrival, the tubers were carefully sorted to eliminate any that were damaged, diseased, or rotten. The selected sweet potatoes (variety: BARI Mistialu-17) (Figure 1a) were then washed thoroughly under running tap water to remove soil, sand, and other extraneous materials. Peeling was carried out manually using a stainless-steel vegetable peeler (AYT0008, China), followed by a second wash in clean water to ensure cleanliness. The peeled BARI Mistialu-17 was sliced into small, uniform pieces (Figure 1b) (3 mm thickness) using a handy food slicer, and immersed in a freshly prepared solution containing 0.1% potassium metabisulfite (KMS) and 5 mL of lemon juice to prevent enzymatic browning. The pretreated slices were then blanched by steam using a Boiler free Steamer (Figure 1c) (Model: E64005D10000200; Accutemp Products Inc., Fort Wayne, IN, USA) at 100°C for 15 min to inactivate enzymes and to conserve their characteristic color. Subsequently, the blanched sweet potato pieces were dried using a laboratory freeze dryer (Alpha 1-2 LSC basic; Martin Christ, Germany). The sweet potato slices were frozen at –18°C for 24 h in a deep freezer (WCG-3J0-DDGE-XX; Walton, Bangladesh) prior to freeze-drying. Then frozen slices were immediately placed in the drying chamber (–56° temperature; 1.8 Pa vacuum) of the freeze-dryer and covered with aluminum foil paper for light shielding for 24 h. Next, freeze-dried sweet potato pieces were milled into a fine flour (Figure 1d) using a laboratory grinder (Jaipan CM/L-7360065; Japan) to achieve a particle size of approximately 0.2 mm. The resulting flour was sieved to ensure uniformity, packaged in airtight high-density polyethylene (HDPE) bags, and stored in a desiccator at ambient temperature (25 ± 2°C) until further analysis and food product development.
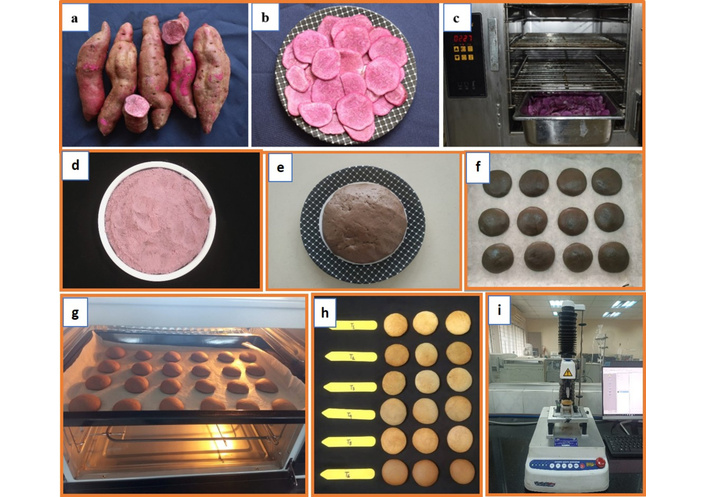
Photographic representation of purple-fleshed sweet potato biscuits. a) Selected sweet potato (BARI Mistialu-17), b) small potato pieces, c) blanching using a steam blancher, d) freeze-dried sweet potato flour, e) raw biscuit dough, f) raw biscuit for baking, g) baking at 170 ± 2°C, 13 min, h) manufactured PFSPF incorporated biscuits and i) textural hardness analysis.
The experiments were executed at the Post-harvest Food Processing and Analytical Laboratory of BARI, Gazipur, Bangladesh. Analytical-grade reagents were obtained from Merck (Germany) and Thermo Fisher Scientific (USA).
Wheat flour (WF, Sunshine Atta, 1 kg pack, Akij Flour Mills Ltd., 304, Wilson Road, Bandor, Narayangonj, Dhaka, Bangladesh), granulated sugar (Fresh Sugar, 1 kg pack), and table salt (Molla Super Salt, Molla Salt (Triple Refined) Industry Ltd., Fatullah, Narayanganj, Bangladesh) were procured for biscuit preparation. Other ingredients included unsalted butter (Milk Vita, 200 g pack, Gazipur, Bangladesh), refined vegetable oil (Fresh soyabean oil, 2 L bottle, Sonargaon Seeds Crushing Mills Ltd., Sonargaon, Bangladesh), fresh eggs (Paragon Brown Egg, Paragon Agro Ltd., Dhaka, Bangladesh), baking powder (AgroPure baking powder, 160 g, AgroPure Trading Corporation, Dobadia, Uttarkhan, Dhaka-1230, Bangladesh), and milk powder (Diploma, 1 L pack, New Zealand Dairy Products Bangladesh Ltd., Bhulta, Rupganj, Narayanganj, Bangladesh). Additional flavoring ingredients such as almonds and cardamom were also sourced. All materials were procured from Shawpno, Joydebpur Bus Stand Express Outlet, Gazipur Sadar, Gazipur, Bangladesh.
The formulations were selected based on a literature review regarding sweet potato incorporation (0 to 50%) and a preliminary trial for biscuit manufacture. Refined WF was substituted by purple-fleshed sweet potato flour (PFSPF) in different percentages (10%, 20%, 30%, 40%, and 50%) to formulate nutritious biscuits, with 100% WF serving as a control. WF and PFSPF were mixed in different amounts (%, w/w) to get the following ratios: 100:0 (T1: control), 90:10 (T2), 80:20 (T3), 70:30 (T4), 60:40 (T5), and 50:50 (T6). To ensure the mixes were evenly mixed, they were blended using a Kenwood mixer for 3 min at a speed of 8 rpm. Before being used again, the resultant flours were placed in airtight high-density polyethylene (HDPE) bags and kept at room temperature (25 ± 2°C). These flours were stored (3–15 days) for quality analysis and subsequently utilized to manufacture biscuits (Figure 1e, 1f, 1g, 1h) within 5 days (all the treatments were replicated 3 times) and were examined for quality parameters (Figure 1i).
The formulation of PFSPF incorporated biscuits is depicted in Table 1. The developed biscuits were prepared by supplementing the WF with PFSPF in different percentages (10%, 20%, 30%, 40%, and 50%), whereas the control included only WF. The standard procedure outlined by Dey et al. [29] was used to make the biscuits (Figure 1), with a few minor modifications. The recipes included about 200 g of composite flour (WF:PFSPF) for each formulation, as shown in Table 1, and 60 g of butter, 35 g vegetable oil, 45 g sugar, 1.2 g salt, 100 g egg, 1.74 g cashew powder, 0.80 g cardamom, 10 g milk powder, and 2.78 g baking powder.
Formulation of PFSPF incorporated biscuits
| Food ingredients | ControlT1 | Composite flours | ||||
|---|---|---|---|---|---|---|
| T2 | T3 | T4 | T5 | T6 | ||
| WF (g) | 200 | 180 | 160 | 140 | 120 | 100 |
| PFSPF (g) | 0 | 20 | 40 | 60 | 80 | 100 |
| Butter (g) | 60 | 60 | 60 | 60 | 60 | 60 |
| Vegetable oil (g) | 35 | 35 | 35 | 35 | 35 | 35 |
| Brown sugar (g) | 45 | 45 | 45 | 45 | 45 | 45 |
| Salt (g) | 1.2 | 1.2 | 1.2 | 1.2 | 1.2 | 1.2 |
| Egg (g) | 100 | 100 | 100 | 100 | 100 | 100 |
| Cashew powder (g) | 1.74 | 1.74 | 1.74 | 1.74 | 1.74 | 1.74 |
| Cardamom powder (g) | 0.80 | 0.80 | 0.80 | 0.80 | 0.80 | 0.80 |
| Milk powder (g) | 10 | 10 | 10 | 10 | 10 | 10 |
| Baking powder (g) | 2.78 | 2.78 | 2.78 | 2.78 | 2.78 | 2.78 |
T1: WF (100%) or control; T2: WF (90%) + PFSPF (10%); T3: WF (80%) + PFSPF (20%); T4: WF (70%) + PFSPF (30%); T5: WF (60%) + PFSPF (40%); T6: WF (50%) + PFSPF (50%); WF: wheat flour; PFSPF: purple-fleshed sweet potato flour.
Composite flours were used in accordance with the treatments to form biscuit dough, which was then kneaded and rolled out into a sheet with a thickness of 7.8 mm. In order to make raw biscuits, the sheet was then cut into a circle with a diameter of 6 cm using a biscuit cutter and placed on a tray to bake. After 13 min of baking at 170 ± 2°C in a free-standing baking oven, the baked biscuits were allowed to cool at ambient temperature. Finally, baked biscuits were properly sealed in airtight containers or foil pouch packets and stored at room temperature (25 ± 1°C) for further quality assessment. The color parameters, textural hardness, sensorial evaluation, and physical analyses were conducted on the day of biscuit manufacturing and the next days, but the physicochemical, nutritional parameters, bioactive phytochemicals, and mineral composition of PFSPF incorporated biscuits were analyzed within 25 days.
The moisture content of the experimental samples was ascertained using the standard procedure described by the AOAC, 934.01 [30] technique. The sample was dried for six hours at 105°C in an oven to eliminate any last traces of moisture. After drying, it was placed in a desiccator to cool before being weighed multiple times until the results were consistent. The percentage of moisture content was then ascertained by applying the following equation to the weight difference before and after drying.
The ash content was determined using the dry ashing procedure outlined by the AOAC, 942.05 [30]. A crucible that had been previously weighed was filled with approximately 5 g of the experimental sample. It was then burned in a muffle furnace at 600°C for six hours. The crucible was placed in a desiccator to cool to room temperature following the burning operation. The ash percentage was calculated by applying the following equation.
where Y is theweight of the crucible containing the sample before ashing (g), Z is the weight of the crucible with the remaining ash following full ashing (g), and X is the weight of the empty crucible (g).
The crude fat content was assessed using an organic solvent extraction method that followed the guidelines of the AOAC, 983.23 [30]. After carefully weighing 1 g of the experimental sample, it was put in a filter paper bag that had already been prepared. After that, the sample was placed inside a Soxhlet apparatus’s extraction chamber, which held a predetermined amount of petroleum ether as the solvent. To enable continuous solvent cycling and fat extraction, the Soxhlet apparatus was placed over a water bath. The petroleum ether-fat mixture was gathered in a round-bottom flask following the extraction process, and the solvent was evaporated by slowly heating it on a hot plate. To get rid of any remaining solvents, the excess fat was dried for four to five hours at 100°C in a hot air oven. To determine the crude fat yield, the flask was reweighed after cooling in a desiccator. The percentage of fat content was measured using the following equation.
The Kjeldahl method, as outlined by AOAC, 990.03 [30], was used to assess the crude protein concentration. By multiplying the nitrogen level of the sample by a conversion factor of 6.25, the protein amount was determined. Organic nitrogen was converted to ammonium sulfate by copper sulfate, which catalyzed the digestive process in the presence of concentrated sulfuric acid (H2SO4). Following digestion, the ammonia produced was distilled and absorbed in 0.1 N sulfuric acid. The remaining acid was titrated with 0.1 N sodium hydroxide (NaOH), using three drops of methyl red as an indicator. The percentage of crude protein content was then ascertained by applying the following formula.
where a is the weight of sample (g), b is the volume of NaOH (mL) used for the sample titration, c is the volume of NaOH (mL) used for back titration (blank), d is the normality of NaOH, and 6.25 is the protein-nitrogen conversion factor.
The method recommended by AOAC, 978.10 [30] was used to determine the crude fiber content. Approximately 1 g of the experimental sample was used in the analysis. To get rid of organic compounds, the residue was dried, processed with acid and alkali, and then burned at 600°C. The following equation was then used to estimate the crude fiber content.
The carbohydrate content was estimated using the technique published by the AOAC [30]. The moisture, ash, fat content, crude fiber, and crude protein were deducted from the organic matter, and the remainder can be regarded as total carbohydrates.
Total sugar (TS) content in flour samples was determined by the method reported by Ranganna [31]. A 25 mL sample extract filtrate was added to 2 mL of highly concentrated hydrochloric acid (HCl) and left at room temperature for approximately 3 days to hydrolyze. Using phenolphthalein as an indicator, the solution was neutralized with a 1 N NaOH solution. HCl was then added until the solution was colorless, and the volume was eventually increased to 100 mL. After that, Fehling's A and B solutions were used to titrate these extract solutions. The brick-red precipitates also served as an indicator of the endpoint. Using the formulas, the amount of TS was obtained using the titre value and expressed as percentage (%).
Total soluble solids (TSS) were measured (°Bx) by a digital hand-held refractometer (Model: PAL-α, Atago, Japan) as described by Farooq et al. [32].
A glass electrode digital pH meter (S220, Mettler, Toledo, Switzerland) was used to determine the pH according to the procedures stated by Ngoma et al. [33]. For preparing powder suspension, about 10 g of the PFSPF flour was poured into a beaker, and 50 mL of deionized water was added. The suspension was stirred for 10 min and then allowed to rest for 5 min. After being collected and centrifuged, the suspension was examined.
Titratable acidity (TA) was measured by titrating 10 mL of the sample solution with sodium hydroxide (0.1 N) solutions to the endpoint of pink hue, as explained by Sadler and Murphy [34]. Five grams of the flour sample were dissolved in ten times the amount of distilled water to generate the titration sample. The volume of alkali (NaOH) consumed was multiplied by a conversion factor of 0.064 to express the acidity as percentage citric acid equivalent. The following formula was then used to ascertain TA.
The sample extracts were generated using the modified procedure described by Assiéné Agamou et al. [35]. The sample (3 g) was extracted with 25 mL of methanol overnight at room temperature (25 ± 2°C). Following the extraction technique, the samples were filtered through Whatman No. 1 filter papers and dried in an evaporator at 40°C for 30 min. The remaining residues were removed again using the same techniques. The filtered extracts were collected for further examination.
The total phenolic content (TPC) was determined using the modified technique developed by Hasan et al. [36]. In a centrifuge tube, 0.5 mL of the sample extract was firmly combined with 0.5 mL of Folin-Ciocalteu reagent and 1 mL of sodium carbonate (7.5% concentration). Next, distilled water (8 mL) was added and vortexed. The mixture was then centrifuged for 8 minutes at 5,000 rpm and left to incubate for 1 h at ambient temperature. The ability to absorb light of the supernatant was measured at 765 nm using a UV-Vis spectrophotometer (UV 1900i, Shimadzu, Japan). The TPC content was expressed in milligrams of gallic acid equivalents per 100 g of dry matter (mg GAE/100 g), with gallic acid serving as the reference solution [37].
With a few little adjustments, the total flavonoid content (TFC) was found using the standard method outlined by Zeb and Rahman [38]. In short, 0.3 mL of 5% w/v NaNO2 was combined with 1 mL of extract and 4 mL of distilled water. After that, the mixture was given five minutes to sit. 0.3 mL of 10% w/v AlCl3 was added, and the mixture was then allowed to settle for another one minute. Next, 2.4 mL of deionized water (H2O) and 2 mL of 1 M NaOH were combined and immediately agitated. After 15 min in the dark, the mixture was centrifuged for 5 min at 3,000 rpm. The results were obtained using the supernatant absorbance at 510 nm and were represented in milligrams of quercetin equivalents per 100 g of dry matter (mg QE/100 g).
Using a modified method developed by Baria et al. [39], the total carotenoid content (TCC) was determined. Approximately 1 g of the experimental sample was mixed with 5 mL of 75% acetone, and the mixture was then allowed to settle for 30 min. Afterward, 2.5 mL of hexane was added, and the mixture was agitated for an additional 30 min. After adding the solvent mixture (15 mL; hexane:acetone:methanol, 2:1:1), it was stirred for an additional 30 min. The mixture was centrifuged for 8 min at 4,000 rpm after 2.5 mL of distilled water was added and stirred for 5 min. After collecting the supernatant, the residue was extracted twice. Using hexane as the blank, the combined extracts were examined at 450 nm using a UV-Vis spectrophotometer. The TCC was calculated using the following equation.
where A is the absorbance of the sample, V is the volume of the hexane layer (mL), ε denotes the extinction coefficient of carotenoid mixtures in hexane (2,500 dL·g–1·cm–1), and W is the weight of the sample (g).
The ascorbic acid content of the experimental samples was ascertained using the standard procedure described by the AOAC [30] technique. As a reference, a typical 10 mL solution of vitamin C was titrated using 2,6-dichlorophenol indophenol dye. A total of 4 g of the experimental sample was homogenized with 3% metaphosphoric acid, filtered through double-layered muslin cloth, and centrifuged for 10 min at 3,000 rpm. The concentration of ascorbic acid was calculated using the following equation after the supernatant was titrated against the dye solution.
Following the procedure described in AOAC [30], which includes solvent extraction and spectrophotometric measurement, the amount of β-carotene was determined. A test tube was filled with 20 mL of n-hexane to extract 5 g of the experimental material. The mixture was gently mixed and vortexed for 5 min in order to obtain homogeneity. The top layer of hexane was transferred to a 25 mL volumetric flask after phase separation. Five milliliters of n-hexane were added to the residue until it became clear in order to resume the extraction. Using n-hexane as a blank, a UV-Vis spectrophotometer was used to determine the absorbance of pooled hexane extracts at 480 nm. β-carotene concentration was estimated by using the following equation.
where A stands for absorbance, E for extinction coefficient (2,592), L for cuvette path length (1 cm), M for molecular weight of β-carotene (536.8), D for dilution factor, V for final volume (mL), and W for sample weight (g).
Molla et al. [40] elucidated that the pH differential method was employed to measure the total anthocyanin content. It was necessary to make buffer solutions with pH 1.0 and pH 4.5. The filtered extract was then mixed with the extraction solvent to place the absorbance readings within the instrument’s best range. The diluted extract was mixed with each buffer one at a time and left to sit for 2 h. The absorbance was measured at 520 nm and 700 nm for both pH 1.0 and pH 4.5 solutions. The anthocyanin concentration was then expressed as mg per 100 g of sample (mg/100 g) based on the sample weight and extract volume using the formula.
where A is (A520 − A700) pH 1.0 − (A520 − A700) pH 4.5, MW is the molecular weight of cyanidin-3-glucoside (449.2 g/mol), DF is the dilution factor, ε is the molar absorptivity (extinction coefficient) of cyanidin-3-glucoside (26,900 L·mol–1·cm–1), l is the path length of the cuvette (usually 1 cm), V is the final volume and w is the weight of sample, and w for sample weight (g).
The antioxidant capacity of PFSPF extract was assessed using a standard procedure obtained from Akter et al. [41]. About 50 mL of methanol (approximately 0.3 mM) was used to dissolve 6 mg of freshly prepared DPPH (2,2-diphenyl-1-picrylhydrazyl) solution. After that, 1.9 mL of DPPH solution and 1 mL of fruit extract were properly combined and allowed to sit at room temperature for 30 min in the dark. Using an ultraviolet-visible spectrophotometer, the absorbance was accurately calculated at 517 nm, whereas methanol was used as a blank solution. The antioxidant capacity (DPPH scavenging activity) was expressed as a percentage.
where A0 represents the control’s absorbance and A1 represents the sample’s absorbance.
The concentrations of Na, K, Ca, Mg, P, S, B, Cu, Mn, Fe, and Zn were determined using the method described by Molla et al. [40]. To digest 1 g of dry biscuit powder, a solution of nitric acid (HNO3) and perchloric acid (HClO4) was used at 320°C. After cooling, the digest was diluted with 30 mL of deionized water and filtered using Whatman filter paper. The resultant filtrate served as the stock solution for mineral analysis. An atomic absorption spectrophotometer (AAS; Shimadzu AA-6800, Japan) was used to detect the concentrations of Na, Ca, Fe, K, Zn, Mg, Mn, and Cu, while phosphorus content was assessed using UV-visible spectrophotometry (Shimadzu UV-3600). Boron was measured using the CaCl2 extraction method, whereas sulfur content was calculated using a turbidimetric process with BaCl2. Individual mineral levels were measured in relation to standard reference minerals received from Sigma Aldrich Chemical Co., USA.
The oil and water absorption capacities (OAC/WAC) of PFSPF were assessed by Dey et al. [29]. After being pre-weighed and thoroughly combined with 25 mL of either distilled water or culinary soybean oil, the sample (3.0 g) was placed in a 50 mL oil/water capacity centrifuge tube, allowed to sit at room temperature for 30 min, and then centrifuged for 20 min at 3,000 rpm. The extra water or oil was thrown away, leaving the sediment of the sample that was discovered at the tube’s bottom. After that, the centrifuge tube with sediment was reweighted. OAC/WAC was measured by the following equation.
where W0 stands for weight of sample, W1 for weight of centrifuge tube + sample and W2 for weight of centrifuge tube + sediment.
In accordance with Dey et al. [29], physical profile analysis of PFSPF-incorporated biscuits was conducted. The biscuits were weighed with an analytical scale as soon as they cooled. A ruler was used to measure the diameter of six biscuits; each biscuit was measured twice perpendicularly, and the mean diameter (mm) was computed from three repetitions. A digital Vernier caliper with an accuracy of ± 0.01 mm was used to measure the thickness. To assess biscuits’ capacity to expand and the quality of the flour, the spread ratio (diameter:thickness) was calculated. The area of the biscuit multiplied by its thickness (cm2) was used to determine its volume. By dividing the observed mass by the volume (g/cm3), the biscuit density was calculated.
The textural profile of the control and developed biscuits was evaluated using a texture analyzer (TA. XT Plus; Stable Micro Systems, Godalming, Surrey, UK) equipped with tensile grips (A/TG) mounted on a heavy-duty platform with a 5 kg load cell, following the method described by Kesselly et al. [42] with slight modifications. Three biscuit samples from each treatment were cut at the center using a biscuit-cutting probe (3PB). The biscuit strips were positioned in the texture analyzer such that the center of the strips was clamped between the stationary platform and the moving arm of the instrument at a fixed distance of 38 mm. Tensile tests were performed under the following conditions: pre-test speed of 1.5 mm/s, test speed of 5 mm/s, return speed of 10 mm/s, post-test speed of 10 mm/s, and a trigger force of 0.049 N. The clamps pulled the biscuit strips until rupture occurred. The rupture force (FR) for textural hardness was measured and expressed as force (kg), which was further converted to Newton (N) for convenience (1 kg force is equal to 9.80665 N).
A versatile chromameter (Model CR-400; Konica Minolta, Japan) was used for analyzing the color profile of the prepared biscuits in accordance with the methods outlined by Medhe et al. [43]. A standard white calibration plate was used to calibrate the apparatus before the measurement to verify accuracy. The CIE Lab* color space, where L* stands for brightness (0 = black, 100 = white), a* for the red-green axis (positive = red, negative = green), and b* for the yellow-blue axis (positive = yellow, negative = blue), was used to measure color parameters. The following formulas were used to figure out the hue angle (H°) and chroma (C) from the observed a* and b* values.
The energy profile of the control and BARI Mistialu-17 flour-incorporated nutritious biscuits was evaluated using a bomb calorimeter (Parr 6100 Calorimeter; Parr Instrument Company, Moline, IL, USA) using the technique stated by Molla et al. [40]. Approximately 1 g of each sample was placed into the crucible and combusted in pure oxygen following electrical ignition. The energy content of the biscuits was calculated as kilocalories per 100 g (kcal/100 g).
The sensory properties of the biscuits were assessed using the procedure established by Dey et al. [29], with minor changes. Sensory evaluation took place over three days at the Postharvest Technology Division’s Sensory Laboratory, which was outfitted with consistent fluorescent lighting and began on the day of biscuit production. There were 54 participants, including 27 men and 27 women, aged 21 to 59, who were diverse researchers, scientists, and technical experts from the Bangladesh Agricultural Research Institute (BARI) in Gazipur, Bangladesh. To assess the replication, they were divided into three groups at random, each consisting of eighteen (18) participants. Every member of the panel had some baking experience and was semi-trained. Smokers were not allowed to take part in this study. In compliance with ethical guidelines, the sensory evaluation of the formulated biscuits made with PFSPF was carried out without endangering any people or animals. The study complies with ethical principles outlined by the Helsinki Declaration (2024), where the exclusion criteria were applied to eliminate any potential risks associated with the study. Ethical approval for the sensory evaluation was obtained from the Research Committee (Expert Panel) at BARI (Experiment No. 5.2.2.14). Participants were told about the study methodology and provided their informed consent before testing. The biscuits were arranged on translucent plastic plates and coded with random three-digit numbers. The study did not explicitly isolate or quantify the halo effect (e.g., through blindfolded testing or separate evaluation of visual and non-visual attributes). A nine-point hedonic scale was used to rate sensory attributes (1 being “extremely unacceptable” and 9 being “extremely acceptable”). Panelists were given tissue paper, drinkable water for palate cleansing in between samples, a pen, and an assessment sheet. Ethical guidelines for participant privacy and rights were strictly followed.
Each quality attribute was fitted to a second-order (quadratic) polynomial of the form:
All models were statistically significant at p < 0.05, and most achieved very high coefficients of determination, supporting their use for prediction and optimization.
A simultaneous optimization approach was applied by normalizing each response to a [0, 1] desirability scale—maximizing fiber, TPC, TFC, DPPH scavenging activity, and Ca, while minimizing hardness. Individual desirabilities were averaged to compute an overall desirability score.
The Mantel test assessed the multivariate association between six groups of biscuit quality attributes (nutritional, physicochemical, bioactive, mineral, color, and texture) and eight key compositional/bioactive variables (fat, protein, fiber, carbohydrate, β-carotene, anthocyanin, TPC, TCC).
The experiment was laid out in a Completely Randomized Design (CRD) with three replications.
All analyses, with the exception of energy content and color parameters (conducted five times), were executed in triplicate, and the results are presented as mean ± standard deviation. One-way analysis of variance (ANOVA) was used for normally distributed data, and the Kruskal-Wallis (KW) test was used for non-normally distributed data to identify significant differences among the means. Post hoc comparisons were conducted with Tukey’s multiple comparison test in the case of ANOVA at a 95% confidence level (p < 0.05).
The physicochemical, nutritional, antioxidant, and bioactive constituents of PFSPF, including moisture, ash, crude fat, crude protein, crude fiber, carbohydrate concentrations, TS, pH, acidity, TSS, β-carotene, anthocyanin, ascorbic acid, total phenolic, flavonoid, and carotenoid content, are represented in Table 2. As per the findings, PFSPF had the following contents: total carbohydrate (81.30%), TS (27.50%), ash (1.92%), moisture (4.89%), crude fat (3.59%), crude protein (5.02%), crude fiber (3.28%), pH (6.43), acidity (0.68%) and TSS (2.57 °Bx).
Quality characteristics of PFSPF.
| Quality characteristics | Parameters | Values |
|---|---|---|
| Physicochemical and nutritive profile | Moisture content (%) | 4.89 ± 0.16 |
| Ash (%) | 1.92 ± 0.11 | |
| Protein (%) | 5.02 ± 0.21 | |
| Carbohydrate (%) | 81.30 ± 0.18 | |
| Crude fiber (%) | 3.28 ± 0.16 | |
| Fat (%) | 3.59 ± 0.18 | |
| Total sugar (%) | 27.50 ± 0.23 | |
| pH | 6.43 ± 0.01 | |
| Titrable acidity (%) | 0.68 ± 0.03 | |
| TSS (°Bx) | 2.57 ± 0.06 | |
| Antioxidant and bioactive phytochemical | Anthocyanin (mg/100 g) | 0.63 ± 0.02 |
| β-carotene (mg/100 g) | 4.96 ± 0.51 | |
| Ascorbic acid (mg/100 g) | 17.47 ± 1.14 | |
| TPC (mg GAE/100 g) | 25.07 ± 0.65 | |
| TFC (mg QE/100 g) | 13.71 ± 1.10 | |
| TCC (mg/100 g) | 27.90 ± 0.25 | |
| DPPH scavenging activity (%) | 43.51± 0.61 | |
| Color attributes | L | 63.48 ±0.07 |
| a* | 8.80 ± 0.01 | |
| b* | 10.15 ± 0.01 | |
| C | 13.43 ± 0.01 | |
| H° | 49.06 ± 0.08 | |
| Mineral profile | Ca (mg/100 g) | 45.60 ± 0.10 |
| Na (%) | 0.49 ± 0.02 | |
| Mg (%) | 1.13 ± 0.02 | |
| K (%) | 1.90 ± 0.03 | |
| Zn (ppm) | 9.00 ± 0.50 | |
| Fe (ppm) | 61.33 ± 1.52 | |
| Mn (ppm) | 44.67 ± 0.58 | |
| Functional properties | WAC (%) | 181.33 ± 1.20 |
| OAC (%) | 162.67 ± 1.34 |
Values represent mean ± SD from triplicate determinations of PFSPF (dry weight basis). TSS: total soluble solids; TPC: total phenolic content; TFC: total flavonoid content; TCC: total carotenoid content; WAC: water absorption capacity; OAC: oil absorption capacity; PFSPF: purple-fleshed sweet potato flour.
The antioxidant and bioactive phytochemical profile from Table 2 showed that TPC, TFC, TCC, β-carotene, anthocyanin, and ascorbic acid content of PFSPF were 25.07 mg GAE/100 g, 13.71 mg QE/100 g, 27.90 mg/100 g, 4.96 mg/100 g, 0.63 mg/100 g, and 17.47 mg/100 g, respectively. Besides, the antioxidant activity (DPPH radical scavenging) was 43.51%. The color parameters, including L*, a*, b*, C, and H° values, were found to be 63.48, 8.80, 10.15, 13.43, and 49.06, respectively. Table 2 displays the mineral composition and functional properties of PFSPF. For calcium, sodium, magnesium, potassium, zinc, iron, and manganese, the average concentrations were 45.60 mg/100 g, 0.49%, 1.13%, 1.90%, 9.00 ppm, 61.33 ppm, and 44.67 ppm, respectively. Additionally, the results demonstrated that PFSPF had an oil absorption capacity of 162.67% and a water absorption capacity of 181.33%.
Table 3 represents the physicochemical, nutritional, and bioactive profiles of the control and PFSPF-incorporated biscuits. The control biscuits and PFSPF developed biscuits with various formulations (0–50% substitution) are depicted in Figure 2. The moisture content of the formulated biscuits ranged from 4.26% to 5.92%. PFSPF contained less protein, as seen by the substantial decrease in protein content (from 11.02% in T1 to 6.18% in T6). From 0.46% (T1) to 6.38% (T6), the fiber content increased substantially, highlighting the function of PFSPF as a dietary fiber source. The levels of carbohydrates varied slightly, from 60.26% to 67.41%. The fat content gradually dropped from 22.83% to 12.36%. TS of the PFSPF incorporated biscuits ranged from 4.50% to 12.84%. The TSS went from 0.60 °Bx in the control (T1) to 2.40 °Bx in T6. The pH readings remained relatively constant, rising from 7.14 to 7.27, whereas the acidity moved slightly from 0.26% to 0.48%. The TPC increased markedly from 1.44 mg GAE/100 g to 6.91 mg GAE/100 g between T1 and T6. In the same way, the TFC went up from 3.41 mg QE/100 g in T1 to 9.06 mg QE/100 g in T6. The TCC went up from 4.42 mg/100 g in the control (T1) to 6.32 mg/100 g in T6. From 0.28 mg/100 g in T1 to 2.64 mg/100 g in T6, anthocyanin levels rose significantly, indicating that PFSPF is crucial in increasing antioxidants associated with pigments. β-carotene content of the PFSPF incorporated biscuits ranged between 1.05 and 3.29 mg/100 g. Because vitamin C is sensitive to heat during baking, the ascorbic acid content peaked in T4 at 8.43 mg/100 g and then slightly decreased in T5 and T6. The results, as shown in Table 3, demonstrate a significant increase in antioxidant activity (DPPH radical scavenging) from 5.30% in the control (T1) to 39.51% in T6.
Physicochemical, nutritional, and bioactive phytochemicals of PFSPF incorporated biscuits.
| Parameters | ControlT1 | Developed biscuits | ||||
|---|---|---|---|---|---|---|
| T2 | T3 | T4 | T5 | T6 | ||
| Moisture (%) | 4.26 ± 0.23d | 4.55 ± 0.30bcd | 4.41 ± 0.16cd | 5.33 ± 0.28abc | 5.92 ± 0.60a | 5.43 ± 0.33ab |
| Crude protein (%) | 11.02 ± 0.11a | 10.36 ± 0.13ab | 9.85 ± 0.18b | 8.01 ± 0.21c | 6.78 ± 0.34d | 6.18 ± 0.45d |
| Crude fiber (%) | 0.46 ± 0.09e | 1.42 ± 0.46d | 2.08 ± 0.24d | 3.64 ± 0.19c | 4.63 ± 0.39b | 6.38 ± 0.40a |
| Carbohydrate (%) | 60.26 ± 0.48c | 60.76 ± 0.42c | 63.18 ± 0.42bc | 65.43 ± 0.51ab | 66.41 ± 0.19a | 67.41 ± 0.77a |
| Crude fat (%) | 22.83 ± 0.50a | 21.36 ± 0.08b | 18.75 ± 0.21c | 15.76 ± 0.12d | 14.15 ± 0.79e | 12.36 ± 0.14f |
| Ash (%) | 1.17 ± 0.13d | 1.55 ± 0.10c | 1.73 ± 0.13c | 1.83 ± 0.06bc | 2.11 ± 0.19ab | 2.24 ± 0.13a |
| TS (%) | 4.50 ± 0.16f | 5.95 ± 0.19e | 7.82 ± 0.12d | 9.19 ± 0.18c | 11.02 ± 0.21b | 12.84 ± 0.24a |
| TSS (°Bx) | 0.60 ± 0.10c | 1.03 ± 0.15b | 1.10 ± 0.20b | 1.20 ± 0.10b | 1.33 ± 0.06b | 2.40 ± 0.10a |
| pH | 7.14 ± 0.04b | 7.23 ± 0.03a | 7.27 ± 0.01a | 7.25 ± 0.01a | 7.24 ± 0.03a | 7.24 ± 0.03a |
| Titrable acidity (%) | 0.34 ± 0.04b | 0.29 ± 0.02bc | 0.26 ± 0.02c | 0.37 ± 0.01b | 0.31 ± 0.04bc | 0.48 ± 0.03a |
| TPC (mg GAE/100 g) | 1.44 ± 0.01e | 2.27 ± 0.01d | 2.38 ± 0.01d | 3.50 ± 0.04c | 4.26 ± 0.58b | 6.91 ± 0.01a |
| TFC (mg QE/100 g) | 3.41 ± 0.23f | 4.47 ± 0.28e | 5.68 ± 0.23d | 6.38 ± 0.22c | 8.14 ± 0.13b | 9.06 ± 0.05a |
| TCC (mg/100 g) | 4.42 ± 0.14d | 4.64 ± 0.14d | 5.00 ± 0.12c | 5.24 ± 0.06bc | 5.49 ± 0.02b | 6.32 ± 0.19a |
| Anthocyanin (mg/100 g) | 0.28 ± 0.01d | 0.54 ± 0.03cd | 0.66 ± 0.02c | 0.86 ± 0.02bc | 1.08 ± 0.13b | 2.64 ± 0.30a |
| β-Carotene (mg/100 g) | 1.05 ± 0.07b | 1.33 ± 0.51b | 2.78 ± 0.05a | 3.18 ± 0.07a | 3.23 ± 0.22a | 3.29 ± 0.06a |
| Ascorbic acid (mg/100 g) | 2.10 ± 0.17f | 2.70 ± 0.17e | 5.60 ± 0.10d | 8.43 ± 0.06a | 8.00 ± 0.10b | 7.00 ± 0.10c |
| DPPH scavenging activity (%) | 5.30 ± 0.45f | 18.04 ± 0.97e | 22.96 ± 0.85d | 29.01 ± 0.44c | 33.77 ± 0.61b | 39.51 ± 0.56a |
Values are expressed as mean ± SD from three independent analyses of PFSPF incorporated biscuits on a dry weight basis. Means within a row bearing different superscript letters differ significantly (p < 0.05). T1: WF (100%) or control; T2: WF (90%) + PFSPF (10%); T3: WF (80%) + PFSPF (20%); T4: WF (70%) + PFSPF (30%); T5: WF (60%) + PFSPF (40%); T6: WF (50%) + PFSPF (50%). TS: total sugar; TSS: total soluble solids; TPC: total phenolic content; TFC: total flavonoid content; TCC: total carotenoid content; WF: wheat flour; PFSPF: purple-fleshed sweet potato flour.
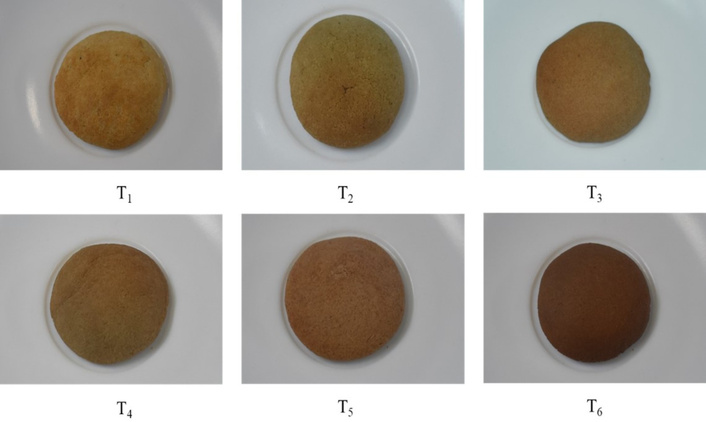
The control biscuits and PFSPF incorporated biscuits with various formulations (0–50% substitution). T1: WF (100%) or control; T2: WF (90%) + PFSPF (10%); T3: WF (80%) + PFSPF (20%); T4: WF (70%) + PFSPF (30%); T5: WF (60%) + PFSPF (40%); T6: WF (50%) + PFSPF (50%). WF: wheat flour; PFSPF: purple-fleshed sweet potato flour.
Table 4 illustrates the mineral and energy profile of the control biscuits (T1) and biscuits incorporated with PFSPF (T2–T6). The components that had been studied include calcium (Ca), phosphorus (P), sodium (Na), magnesium (Mg), potassium (K), sulfur (S), zinc (Zn), iron (Fe), manganese (Mn), copper (Cu), and boron (B). Results revealed that the mineral content of the flours increased with the substitution of PFSPF. The energy values of biscuits T1, T2, T3, T4, T5, and T6 were 7.65, 8.31, 8.51, 8.68, 8.88, and 9.08 kcal/100 g, respectively (Table 4).
Mineral and energy profile of PFSPF incorporated biscuits.
| Parameters | ControlT1 | Developed biscuits | ||||
|---|---|---|---|---|---|---|
| T2 | T3 | T4 | T5 | T6 | ||
| Ca (mg/100 g) | 19.21 ± 0.08c | 20.40 ± 0.05c | 24.84 ± 0.10b | 26.09 ± 0.11b | 27.21 ± 0.09b | 36.08 ± 0.11a |
| P (%) | 0.14 ± 0.01a | 0.12 ± 0.01ab | 0.13 ± 0.01ab | 0.11 ± 0.01b | 0.12 ± 0.01ab | 0.13 ± 0.01ab |
| Na (%) | 0.28 ± 0.02c | 0.32 ± 0.01bc | 0.36 ± 0.02b | 0.36 ± 0.01b | 0.36 ± 0.01b | 0.47 ± 0.04a |
| Mg (%) | 0.75 ± 0.01c | 0.84 ± 0.03b | 0.80 ± 0.01bc | 0.99 ± 0.04a | 1.04 ± 0.01a | 1.04 ± 0.02a |
| K (%) | 0.33 ± 0.02e | 0.37 ± 0.02de | 0.42 ± 0.02cd | 0.45 ± 0.01c | 0.53 ± 0.03b | 0.96 ± 0.05a |
| S (%) | 0.42 ± 0.03d | 0.33 ± 0.49e | 0.49 ± 0.02c | 0.62 ± 0.03b | 0.73 ± 0.03a | 0.69 ± 0.02a |
| Zn (ppm) | 7.08 ± 0.12d | 8.02 ± 0.03c | 8.32 ± 0.47bc | 9.05 ± 0.06ab | 9.24 ± 0.22a | 9.47 ± 0.41a |
| Fe (ppm) | 13.02 ± 1.02f | 25.01 ± 0.69e | 29.03 ± 0.26d | 34.01 ± 0.91c | 36.99 ± 0.55b | 55.04 ± 0.55a |
| Mn (ppm) | 12.03 ± 0.64e | 19.17 ± 0.16c | 14.23 ± 0.24d | 31.27 ± 0.25b | 31.56 ± 0.50b | 39.02 ± 1.02a |
| Cu (ppm) | 1.17 ± 0.21e | 2.13 ± 0.15d | 2.96 ± 0.16c | 3.33 ± 0.48c | 4.85 ± 0.19b | 5.95 ± 0.10a |
| B (ppm) | 15.93 ± 0.83f | 21.21 ± 0.22e | 31.96 ± 0.84d | 40.49 ± 0.51c | 48.09 ± 1.10b | 64.11 ± 0.96a |
| Energy (kcal/100 g) | 7.65 ± 0.02f | 8.31 ± 0.01e | 8.51 ± 0.01d | 8.68 ± 0.01c | 8.88 ± 0.01b | 9.08 ± 0.02a |
Values are expressed as mean ± SD from three independent analyses of PFSPF incorporated biscuits on a dry weight basis. Means within a row bearing different superscript letters differ significantly (p < 0.05). T1: WF (100%) or control; T2: WF (90%) + PFSPF (10%); T3: WF (80%) + PFSPF (20%); T4: WF (70%) + PFSPF (30%); T5: WF (60%) + PFSPF (40%); T6: WF (50%) + PFSPF (50%). WF: wheat flour; PFSPF: purple-fleshed sweet potato flour.
The physical properties of the control biscuits alongside those containing PFSPF are shown in Table 5. The weights of the formulated biscuits ranged from 11.28 g to 11.85 g, with the highest weight recorded in formulation T6. The diameter of the biscuit samples T3 (6.71 cm) was slightly higher than that of the control (T1: 6.25 cm), whereas the other formulations exhibited smaller diameters. Biscuits exhibited thickness values ranging from 0.79 cm to 0.85 cm. The spread ratio of the control biscuit (T1) was 7.91, while the values for T2, T3, T4, T5, and T6 were slightly lower at 7.76, 7.71, 7.46, 7.31, and 7.08, respectively. The volume of the control and PFSPF-enriched biscuits ranged from 23.60 cm3 to 23.95 cm3. Biscuit volume did not differ significantly (p > 0.05) among the formulations, except for T6. Similarly, biscuit density remained statistically non-significant (p > 0.05), ranging from 0.48 to 0.49 g/cm3.
Physical profile analysis of PFSPF incorporated biscuits.
| Biscuit samples | Diameter (cm) | Thickness (cm) | Spread ratio | Weight (g) | Volume (cm3) | Density (g/cm3) | Hardness (N) |
|---|---|---|---|---|---|---|---|
| T1 | 6.25 ± 0.02b | 0.79 ± 0.01c | 7.91 ± 0.02a | 11.28 ± 0.01e | 23.89 ± 0.12ab | 0.47 ± 0.01b | 21.97 ± 0.11f |
| T2 | 6.21 ± 0.02c | 0.80 ± 0.01c | 7.76 ± 0.13a | 11.62 ± 0.01d | 23.91 ± 0.15ab | 0.48 ± 0.01a | 23.71 ± 0.46e |
| T3 | 6.71 ± 0.01a | 0.80 ± 0.01c | 7.71 ± 0.11a | 11.65 ± 0.01d | 23.60 ± 0.22b | 0.49 ± 0.01a | 24.68 ± 0.03d |
| T4 | 6.14 ± 0.12d | 0.82 ± 0.01b | 7.46 ± 0.05b | 11.69 ± 0.01c | 24.08 ± 0.29ab | 0.49 ± 0.01a | 26.17 ± 0.01c |
| T5 | 6.09 ± 0.02d | 0.83 ± 0.01b | 7.31 ± 0.04b | 11.74 ± 0.02b | 23.95 ± 0.31ab | 0.49 ± 0.01a | 27.09 ± 0.01b |
| T6 | 6.04 ± 0.01e | 0.85 ± 0.01a | 7.08 ± 0.04c | 11.85 ± 0.01a | 24.30 ± 0.01a | 0.49 ± 0.01a | 34.25 ± 0.01a |
Values represent mean ± SD from triplicate determinations. Different superscripts within a column indicate significant differences (p < 0.05). T1: WF (100%) or control; T2: WF (90%) + PFSPF (10%); T3: WF (80%) + PFSPF (20%); T4: WF (70%) + PFSPF (30%); T5: WF (60%) + PFSPF (40%); T6: WF (50%) + PFSPF (50%). WF: wheat flour; PFSPF: purple-fleshed sweet potato flour.
The textural hardness of PFSPF incorporated biscuits is illustrated in Figure 3 and Table 5. The control biscuits (T1) had a hardness of 21.97 N (2.24 kg force), which progressively increased to 23.71 N (2.45 kg force) in T2, 24.68 N (2.52 kg force) in T3, 26.17 N (2.67 kg force) in T4, 27.09 N (2.76 kg force) in T5, and peaked at 34.25 N (3.49 kg force) in T6. The substitution of PFSPF significantly (p < 0.05) increased the hardness of the formulated biscuits.
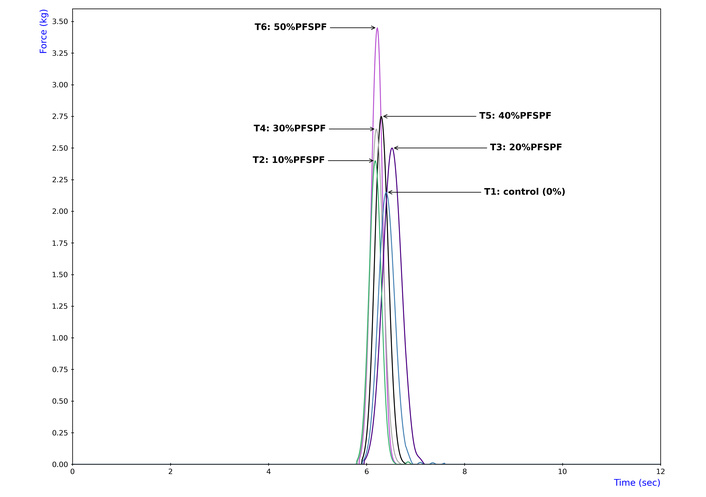
Textural profile analysis (TPA) curve of PFSPF incorporated biscuits. T1: WF (100%) or control; T2: WF (90%) + PFSPF (10%); T3: WF (80%) + PFSPF (20%); T4: WF (70%) + PFSPF (30%); T5: WF (60%) + PFSPF (40%); T6: WF (50%) + PFSPF (50%). WF: wheat flour; PFSPF: purple-fleshed sweet potato flour.
Figure 4 summarizes the color profile of the control biscuits and those formulated with PFSPF. The control biscuits (T1) exhibited the highest lightness (L*) value (48.24), which progressively decreased with increasing levels of PFSPF substitution. Both the redness (a*: 16.16 to 4.13) and yellowness (b*: 33.17 to 16.12) values also declined gradually, indicating a reduction in these color components as the proportion of PFSPF increased. Adding this flour also altered the chroma (C) and hue angle (H°), which affected the overall perception of color. Statistical analysis revealed that the color parameter differences among formulations were significant (p < 0.05).
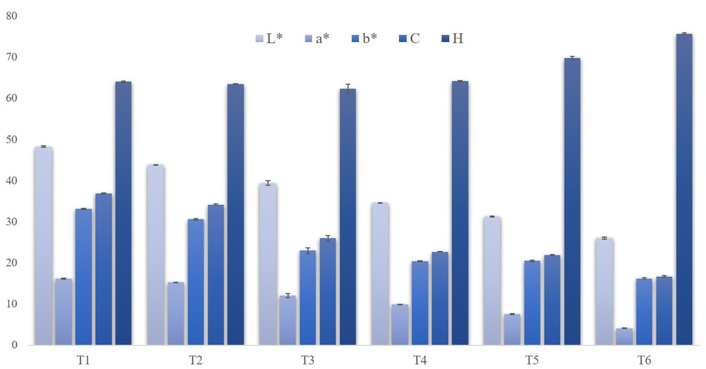
Color profile (mean ± standard deviation) of PFSPF incorporated biscuits. T1: WF (100%) or control; T2: WF (90%) + PFSPF (10%); T3: WF (80%) + PFSPF (20%); T4: WF (70%) + PFSPF (30%); T5: WF (60%) + PFSPF (40%); T6: WF (50%) + PFSPF (50%). WF: wheat flour; PFSPF: purple-fleshed sweet potato flour.
As illustrated in Figure 5, the sensory scores of the biscuits indicated noticeable changes with increasing levels of PFSPF. The sensory scores showed that the overall acceptability of the developed biscuits was highest for T6, followed by T5, T4, T3, and T2, compared to the control (T1). Significant differences (p < 0.05) were observed among the formulations in terms of color, flavor, taste, texture (crispiness), and overall acceptability.
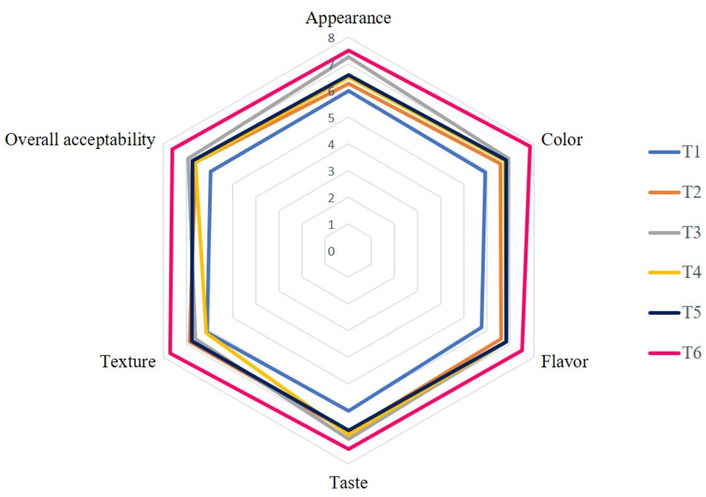
Sensory profile of PFSPF incorporated biscuits. T1: WF (100%) or control; T2: WF (90%) + PFSPF (10%); T3: WF (80%) + PFSPF (20%); T4: WF (70%) + PFSPF (30%); T5: WF (60%) + PFSPF (40%); T6: WF (50%) + PFSPF (50%). WF: wheat flour; PFSPF: purple-fleshed sweet potato flour.
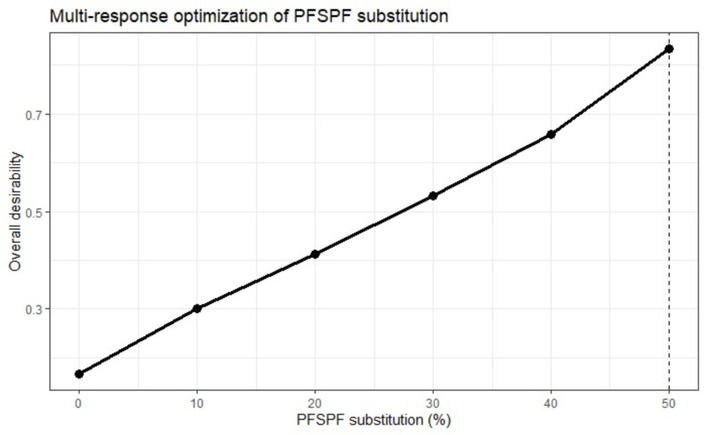
The study investigated the effect of substituting PFSPF at six levels (0%, 10%, 20%, 30%, 40%, and 50%) on biscuit quality. Three analytical approaches were applied: Polynomial Regression Modeling of individual responses (Figure 6), desirability-function-based multi-response optimization (Table 6 and Figure 7), and Mantel tests with a Pearson correlation heatmap to assess inter-variable associations (Figure 8).
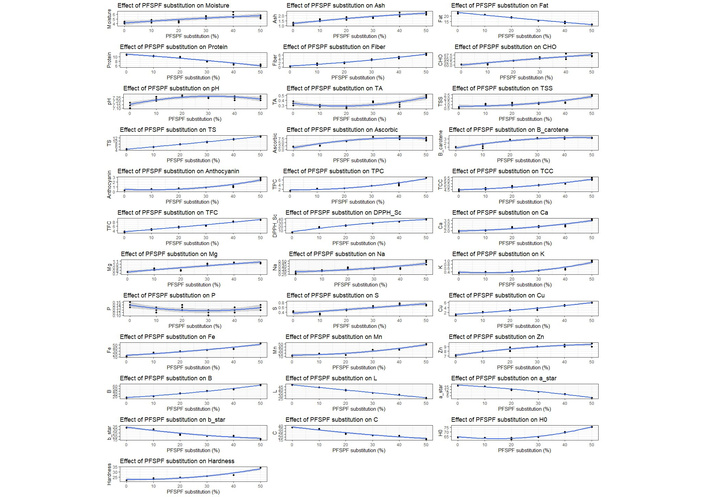
Polynomial Regression Models for PFSPF incorporated biscuits at different substitution levels (0–50%). CHO: carbohydrate; TA: titratable acidity.
Multi-response optimization of PFSPF substitution.
| Response | Desirability score |
|---|---|
| Fiber | 1.000 (maximum) |
| TPC | 1.000 (maximum) |
| TFC | 1.000 (maximum) |
| DPPH scavenging activity | 1.000 (maximum) |
| Ca | 1.000 (maximum) |
| Hardness | 0.000 (minimum = softest, fully desirable) |
| Overall | 0.833 |
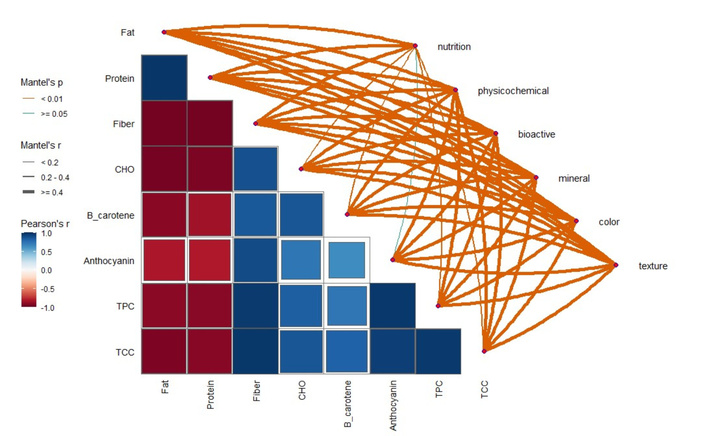
Mantel tests and correlation analysis among biscuit quality attributes (nutritional, physicochemical, bioactive, mineral, color, and texture).
The nutritional composition of sweet potato flour is highly variable and depends on cultivar, agro-ecological circumstances, post-harvest management, and processing methods [6, 9, 10]. The physicochemical properties represent the prime quality of the raw material, which will be incorporated in the final food products [44]. From Table 2, the value of moisture content below 10% attained by freeze drying techniques indicates that these flours have a longer shelf life or a lower possibility of microbial growth [45]. The ash content indicates the presence of total mineral concentrations of the sample, and a higher value may indicate a greater presence of essential minerals such as potassium, calcium, magnesium, and trace elements, which can enhance the nutritional value of the flour [7]. The relatively high ash content (1.92%) may be attributed to several factors, including the intrinsic mineral composition of the BARI Mistialu-17 variety, the soil characteristics where the sweet potatoes were cultivated, and the presence of fibrous material during processing. PFSPF is valued for its rich nutritional profile, being an excellent source of protein, dietary fiber, ascorbic acid, β-carotene, essential vitamins, along with biologically active phytochemicals like carotenoids, phenols, and anthocyanins (Table 2). These findings corroborate those obtained by Alam [7] and Ivane et al. [46]. Our findings in terms of anthocyanin content are similar to those of the previous study by Ekaputra and Pramitasari [47]. The flour’s richness in phenolic compounds, anthocyanins, flavonoids, and carotenoids contributed to significant enhancements in antioxidant and bioactive potential in the formulated biscuits [46]. Previous studies have revealed noteworthy differences in macronutrients, mineral composition, and bioactive phytochemicals across varieties, postharvest handling or pretreatment and drying techniques [6–9]. Results showed that postharvest pretreatment with potassium metabisulfite and lemon juice is an excellent choice for better color retention and antioxidant qualities in freeze-dried flours. The findings for color attributes were consistent with a former study by Bakar et al. [45]. The mineral contents are noticeably found in this flour. The findings interpreted that PFSPF contained valuable minerals, namely iron, potassium, calcium, zinc, and magnesium. The results also indicated that PFSPF has good water and oil absorption capacities. Our findings are corroborated with the previous study described by Badiora et al. [8] who found that yellow fleshed sweet potato contained 106.5 to 531% WAC and 83.5 to 168.5% OAC. High PFSPF absorption of water and oil results in competitive hydration, where water is bound by fiber and damaged starch, preventing the production of gluten. As a result, the gluten network becomes weaker, less elastic, and more viscous. Consequently, the dough becomes less extensible and firmer, which reduces spread and increases the hardness of the biscuits [48]. Moreover, these functional properties are useful in structure interaction in food, especially in flavor retention, palatability improvement, and shelf-life extension, particularly in bakery products [49].
Table 3 presents the physicochemical, nutritional, and bioactive profiles of the control and PFSPF-incorporated biscuits. Better moisture retention was demonstrated by PFSPF at higher substitution levels (T4–T6), most likely as a result of the fiber content's stronger water-holding capacity over refined WF. Asrat et al. [50] noted comparable patterns and credited the hydrophilic qualities of dietary fibers with the higher moisture content of sorghum-enriched biscuits. Besides, there was minimal risk of microbiological spoiling because all moisture levels were within the recommended range for biscuit shelf stability (< 10%) [45]. As shown in Table 3, the protein content of the formulated biscuits (11.02% to 6.18%) notably decreased with higher levels of PFSPF substitution because they contained lower amounts of protein. Sweet potato proteins interact with the wheat-based protein matrix, which is mostly made up of gluten-forming proteins (glutenins and gliadins), in the biscuit formulation. Sweet potato proteins don't have the ability to make gluten, so adding them dilutes the gluten network. The dough matrix becomes less cohesive and elastic as a result [51]. These proteins can, however, still engage in non-covalent interactions with gluten proteins and starch components, such as hydrogen bonding and hydrophobic interactions, which affect the viscosity and moisture retention of dough [52]. The fiber content of the PFSPF incorporated biscuits significantly increased with higher substitutions of that flour. This improvement is comparable to the previous study documented by Tortoe et al. [53]. Moreover, researchers stated that fiber enrichment not only increases the nutritional content but also helps individuals feel fuller and regulate blood sugar levels [54]. The intrinsic fiber composition of PFSPF, which includes both soluble dietary fiber and insoluble dietary fiber fractions, is responsible for the significant increase in dietary fiber content from 0.46% (T1) to 6.38% (T6). The main components of sweet potato dietary fiber are cellulose, hemicellulose, lignin (an insoluble component), and pectin (a soluble component). Based on the proportions described by the previous study of Mei et al. [55], insoluble fiber predominates, but soluble fiber is also found in significant amounts. Soluble fiber may partially offset these effects by enhancing water retention and lubricity within the dough system, but increased fiber incorporation, especially insoluble fiber, can result in denser texture, decreased spread ratio, and increased hardness from a sensory standpoint [55]. Sweet potato dietary fibers have been demonstrated to have prebiotic effects, supporting good gut bacteria like Lactobacillus and Bifidobacterium while inhibiting harmful species [56]. Fiber-rich formulations can prolong feelings of fullness and potentially help with weight management by delaying stomach emptying and modulating the postprandial glucose response. Consequently, adding PFSPF to biscuits improves their functional and health-promoting qualities in addition to changing their physicochemical and sensory characteristics [48, 57]. Due to the greater fiber contents of PFSPF, which largely replace digestible carbohydrates, the amounts of carbohydrates varied considerably; however, no discernible trends were seen [58]. From Table 3, the slight increase in carbohydrate levels at higher PFSPF substitution levels emphasizes the possible advantages of such formulations for developing functional food products. The carbohydrate amount remained nutrient-sufficient to provide energy [59]. The combination of starch, dietary fiber, and the protein matrix probably affects the biscuits’ glycemic response, even if the variations in overall carbohydrate content were marginal. By increasing digesta viscosity and limiting enzymatic accessibility, increased fiber content, especially soluble fractions, may decrease starch digestibility and glucose release, lowering the expected glycemic index [60, 61]. In order to determine these associations, more research utilizing in vitro starch digestibility tests or an in vivo glycemic index study of the developed biscuits via PFSPF inclusion is recommended. PFSPF has less lipid than WF, hence the fat level decreased over time. The findings of Khrisanapant et al. [62], who found that legume fortification enhances the fatty acid profile and decreases fat levels, confirm this tendency. The majority of the lipids in sweet potatoes are unsaturated, which could improve flavor but make them more prone to oxidation, which could shorten their shelf life [63]. The texture of PFSPF incorporated biscuits may also be affected by lower fat content. People who are health-conscious and looking for lower-calorie options can find these formulations more enticing because of the noted reduction in fat content. Results found that adding composite flour instead of refined WF to baked items made them have higher levels of minerals. It additionally suggests that PFSPF might be utilized to supplement food with additional minerals [64]. A higher TSS content in formulated biscuits may result in a sweeter taste, requiring less sugar during initial formulation. Since biscuits are frequently categorized as low-moisture items, it is important to note that an increase in TSS is usually linked to a decrease in free water availability, which may improve shelf stability. Furthermore, additional research will be carried out to investigate microbial growth patterns, water activity, and storage stability in order to thoroughly evaluate the safety and quality consequences of elevated TSS. The acidity changed slightly, but the pH values stayed mostly the same for all the formulations. Nutritive and physicochemical components such as proteins, minerals, and phosphates in composite flour can contribute to buffering action, assisting to maintain a relatively stable pH during processing. Ionic strength also influences water binding and protein interactions, which are important factors that determine the final biscuit texture and dough rheology. Similar findings have been documented by Tanger et al. [65], who demonstrated that pH stability and structural characteristics in food products are influenced by buffering effects and ionic strength.
The results indicated that replacing PFSPF in formulated biscuits enhanced the TPC and TFC (Table 3). The results align with the Dinu et al. [66] publication. By reducing oxidative stress, these substances are recognized to play a crucial role in their anti-inflammatory and antioxidant properties. This increase is consistent with the presence of total phenolic and flavonoid compounds, which are well known for their health benefits, including heart protection and inflammation reduction [37]. The enrichment of the carotenoid profile makes the developed biscuits more nutritious and able to combat free radicals [67]. Significant increases in anthocyanin levels in the developed biscuits suggest that PFSPF plays a critical role in boosting pigment-related antioxidants. The higher anthocyanin content points to potential health benefits, especially in reducing inflammation and oxidative stress. This study supports the findings of Guclu et al. [68]. Results revealed that the amount of β-carotene in the formulated biscuits was more than tripled than control biscuits. In line with previous research, the rise in β-carotene emphasizes the nutritional advantages of using PFSPF as a precursor of vitamin A [69]. Results demonstrated that ascorbic acid levels continued to be nutritionally significant, which helped to boost the biscuit’s antioxidant capacity [70]. As shown in Table 3, results also demonstrated a significant rise in antioxidant activity, indicating that the prepared biscuits are healthier when additional PFSPF is added. Eid et al. [64] have shown comparable improvements in antioxidant capacity. Antioxidant chemicals can interact with macromolecules, including proteins, lipids, and carbohydrates, to increase their stability during processing by decreasing their accessibility to heat and oxygen [71]. Due to the high moisture content and latent heat of water evaporation, the internal temperature of the biscuit matrix stays much lower for the majority of the baking period, even though the oven temperature during baking exceeds the typical 170°C. This phenomenon has been extensively documented in baked systems [72]. The properly stored biscuits in airtight containers or foil pouch packets may be consumed for 2 months.
As shown in Table 4, the calcium content of the developed biscuits progressively increases across all the treatments indicates a dose-dependent effect of PFSPF substitution. The enhancement in calcium aligns with the previous study of Roger et al. [73]. Phosphorus levels have no clear trend across treatments. The minimal variation and absence of significant differences (p > 0.05) indicate that the phosphorus concentration is not significantly affected by the substitution of this flour. The prior study, as reported by Eid et al. [64], supports these findings. The sodium level of the manufactured biscuits increased because of the inherent sodium content of the substituted flour and the retention of added salt during baking. Similar trends were reported by Ozgolet et al. [74]. The increase in magnesium content can be attributed to the naturally high magnesium content of PFSPF, which aligns with the research conducted by Mengeneh and Chukwuma Ariahu [75]. The comparable trend for potassium is consistent with the findings of the Garg and Sharma [76] investigation. The initial loss of sulfur during high-temperature baking may be attributed to sulfur loss, whereas the subsequent increase is probably caused by an elevated concentration of sulfur-containing amino acids [50]. According to studies by Ozgolet et al. [74], which emphasized the significance of composite flour in zinc enrichment, zinc deficits in diets based on cereals can be reduced. The research findings, as shown in Table 4, indicate that PFSPF serve as a potential iron-rich fortifier. Moreover, this notable rise aligns with the findings of Ozgolet et al. [74], who highlighted the effectiveness of composite flour in enhancing the iron content of baked goods. The differences in the manganese content of the formulated biscuits may be the reason for the substitution level of the composite flour, as supported by the previous findings of Roger et al. [73]. Roger et al. [73] also assert that this consistent increase validates the role of composite flour in copper enrichment. The presence of boron in the formulated biscuits varied among different substitution levels of PFSPF, which supports its potential to improve bone health and metabolic processes [64]. Therefore, instead of refined WF, the incorporation of PFSPF can be used as a functional ingredient to add valuable macro- and micronutrients to baked biscuits to make them healthier and fill in mineral gaps.
Food energy is released during the oxidation of proteins, lipids, carbohydrates, and other organic compounds [44]. When the primary calorigenic macronutrients (carbohydrates, fats, and proteins) in a food portion are completely burned in the presence of enough oxygen, they release energy in the form of calories [77]. The heat of combustion, which is essential for sustaining fundamental metabolic processes, physical activity, growth, and general health, is frequently measured using a bomb calorimeter [78]. Results showed that the energy content of T6 biscuits (50% PFSPF incorporated) was significantly higher (p < 0.05) than that of the other formulations (Table 4). This increase is likely attributable to the higher concentrations of calorigenic nutrients present in PFSPF, suggesting its potential as a richer energy source compared to refined WF (T1).
The weights and thickness of PFSPF incorporated biscuits were slightly increased (Table 5). Variations in biscuit weight were primarily attributed to differences in dough piece weights, which are influenced by spatial inconsistencies in the thickness of the dough sheet during cutting. A gradual increase in both weight and thickness was observed with the incorporation of PFSPF as a partial replacement for WF; however, the test samples showed a notable reduction in diameter. The diameter of the biscuit sample T3 (6.71 cm) was slightly higher than that of the control (T1: 6.25 cm), whereas the other formulations exhibited smaller diameters. These alterations in diameter and thickness were reflected in the spread ratio. The decrease in diameter, coupled with an increase in thickness, resulted in lower spread ratios in the developed biscuits, which appeared to be directly influenced by the flour composition [29, 79]. The reduced diameter and spread ratio in the enriched formulations may be attributed to the higher content of hydrophilic sites and water-soluble proteins in PFSPF, which tend to compete for the scarce free water available within the dough matrix. Consequently, reduced water availability during dough mixing increases viscosity, ultimately leading to smaller diameters and lower spread ratios [80]. The volume of the control and PFSPF-enriched biscuits did not differ significantly (p > 0.05) among the formulations, except for T6. Similarly, biscuit density remained statistically non-significant (p > 0.05).
Texture is the most noticeable physical attribute of biscuits to attract the consumer after color. Adding BARI Mistialu-17 flour significantly (p < 0.05) increased the hardness of the formulated biscuits (Figure 3). The results indicated that the hardness of composite biscuits was comparable to that reported by Dey et al. [29]. The lower gluten concentration resulting from partial substitution with PFSPF most likely contributed to the formation of a weaker gluten network, which affected the textural hardness of the biscuit samples. The PFSPF has a higher dietary fiber content, which contributes to the significant (p < 0.05) improvement in biscuit hardness. These results indicate that differences in fat and fiber content markedly affect the texture of the produced biscuits. Saeed et al. [80] have reported similar trends.
Color is one of the main physical characteristics that influences consumer perception of food [59]. Anthocyanins are primarily responsible for the distinctive purple color of PFSPF; however, these pigments are heat-sensitive and may break down or change during baking, resulting in a decrease in color intensity and a shift toward brown hues. This is in line with the biscuits’ observed darker hue, which may be explained by both the breakdown of anthocyanins and the production of brown pigments via non-enzymatic browning reactions [81]. The higher PFSPF content resulted in darker colors, and the lightness decreased in all formulations [82]. The decrease in lightness (L*) is probably due to the presence of bioactive phytochemicals in PFSPF, particularly anthocyanin pigments. These components impart the manufactured biscuits’ dark and purple color. As the a* and b* values decrease, the formulated biscuits gradually lose their redness and yellowness (Figure 4). Fortifying PFSPF also altered the chroma and hue angle, which influenced the overall perception of color quality. The Maillard reaction during baking, which generates colored compounds, is the primary cause of the color development in the manufactured biscuits [83]. Moreover, anthocyanin or purple pigments, water activity, dough composition, baking temperature, baking time, and the presence of sugars, starches, and proteins are some of the variables that affect the color intensity of the PFSPF incorporated biscuits [45].
From the questionnaires, Figure 5 depicted that T6 (50% PFSPF) had the highest overall acceptability score, while all biscuit samples received scores above the minimum acceptable threshold of 5 on a 9-point hedonic scale, indicating that the formulations remained within the range of consumer acceptability. Sensory evaluation results interpreted that a slight improvement in visual appearance was noted at higher substitution levels, possibly attributable to anthocyanin pigments and uniform porosity of PFSPF, which may have contributed to optimum appearance scores. These findings are comparable to those documented by Amani et al. [84]. Moreover, fortifying PFSPF also changed the flavor of the formulated biscuits. As substitute levels increased, sensory panelists observed a progressive loss of the unique biscuit flavor, most likely as a result of reduced gluten network development and increased fiber content. Furthermore, taste and texture (crispiness) showed comparable trends. Texture and taste evaluations increased marginally as the amount of PFSPF increased. This might be the result of the optimized biscuits being less cohesive and harder [85]. According to the sensory scores, panelists’ opinions of the various treatments were strongly correlated with important sensory characteristics, especially color, texture, and flavor. Samples with more desirable natural color (dark color for PFSPF), suitable textural qualities (like optimal crispness), and balanced flavor profiles received higher acceptable scores. The sensory assessment ratings showed that T6 biscuits were the most popular overall (7.60), which means that test panelists mostly preferred PFSPF incorporated biscuits. These findings indicated that PFSPF is a promising enhancement for the nutritional quality of bakery food items while maintaining consumer appeal.
Moisture content showed a moderate fit (R2 = 0.6273, p = 0.0006) with a small positive linear trend, indicating a slight moisture increase with PFSPF addition. Ash (R2 = 0.8994) and fat (R2 = 0.9829) were highly significant, with fat declining linearly (β1 = −0.241), consistent with the lower fat content of PFSPF compared to WF. Protein decreased significantly (R2 = 0.9580), while fiber increased markedly (R2 = 0.9781, positive linear and quadratic terms), as expected from the high dietary fiber content of sweet potato flour. Carbohydrate showed a moderate-to-good fit (R2 = 0.8763).
pH (R2 = 0.6584) and TA (R2 = 0.6618) showed moderate fits, suggesting PFSPF modestly alters dough acidity. TSS (R2 = 0.8328) and total solids (R2 = 0.9960, exceptionally well-fitted) were strongly influenced by substitution level. All bioactive parameters were highly significant (p < 0.0001). DPPH radical scavenging activity (DPPH scavenging) showed the strongest linear response (β1 = 0.959, R2 = 0.9840), reflecting the potent antioxidant contribution of PFSPF. TPC (R2 = 0.9558), TFC (R2 = 0.9848), TCC (R2 = 0.9467), and anthocyanin (R2 = 0.8854) all increased with substitution. β-Carotene (R2 = 0.8923) and ascorbic acid (R2 = 0.8503) also increased significantly but with negative quadratic terms, suggesting a plateau or slight decline at very high substitution levels. Calcium (R2 = 0.9122), magnesium (R2 = 0.8471), sodium (R2 = 0.7669), potassium (R2 = 0.8986), sulfur (R2 = 0.7998), copper (R2 = 0.9696), iron (R2 = 0.9275), Manganese (R2 = 0.9070), and zinc (R2 = 0.9161) were all significantly improved with PFSPF substitution, with most showing positive linear trends. Phosphorus was the only mineral with a weaker model fit (R2 = 0.3556, p = 0.0370), suggesting less consistent phosphorus variation across treatments. Textural hardness data were included in the optimization framework, but its regression model output is embedded within the optimization step (minimization objective), indicating it responded negatively to higher substitution.
An overall desirability of 0.833 is considered highly satisfactory for multi-response optimization in food science contexts, indicating that 50% substitution simultaneously maximizes functional and nutritional quality while minimizing textural toughness. The desirability curve (Figure 7) was monotonically increasing across the 0–50% range, suggesting that even higher substitution levels might yield further improvements—a point worth discussing in the manuscript as a study limitation.
Bioactive compounds showed the strongest associations with environmental variables—the Mantel r reached 1.000 with fat and 0.934 with protein (both p = 0.001), confirming that changes in macronutrient composition were tightly coupled with antioxidant content across treatments. Mineral content likewise showed very strong associations: r = 1.000 with protein, r = 0.897 with fiber, and r = 0.848 with carbohydrate (all p = 0.001), highlighting that PFSPF enrichment simultaneously improved mineral profiles. Color properties were strongly correlated with all variables (r ≥ 0.599–1.000, all p = 0.001), with especially high associations with fiber (r = 1.000), TCC (r = 0.925), and TPC (r = 0.905), consistent with the deep pigmentation contributed by purple anthocyanins.
Physicochemical properties showed high associations with fiber (r = 0.813), fat (r = 0.768), TCC (r = 0.711), and protein (r = 0.702), all significant at p = 0.001. Texture showed strong associations with fat (r = 0.893) and protein (r = 0.848), indicating that macronutrient shifts driven by PFSPF substitution were primary drivers of textural change. Nutritional composition showed moderate-to-strong associations with most variables (r = 0.199–0.597), with the notable exception of anthocyanin (r = 0.199, p = 0.084, not significant), suggesting that anthocyanin variation was not strongly linked to overall proximate composition differences—possibly due to its more variable, concentration-dependent behavior.
This study illustrates that PFSPF could be used as a functional ingredient to make the biscuits more nutritious. The abundance of phenolic compounds, anthocyanins, and carotenoids in the sweet potato flour greatly increased the antioxidant and bioactive potential of the PFSPF incorporated biscuits. However, the substitution of more PFSPF altered the color parameters, leading to a decrease in whiteness and an increase in brownness. The ideal substitution level was found to be 50%, which strikes a balance between desired sensory and physical qualities and functional benefits. Lastly, it can be said that T6 biscuits with PFSPF (50%) demonstrated favorable overall acceptability, a unique color, and a desirable texture, and gave people more energy than control biscuits. Our future research direction will mainly focus on assessing the glycemic index in vitro or in vivo of the PFSPF developed biscuits to substantiate the potential health benefits.
BARI: Bangladesh Agricultural Research Institute
PFSPF: purple-fleshed sweet potato flour
TA: titratable acidity
TCC: total carotenoid content
TFC: total flavonoid content
TPC: total phenolic content
TS: total sugar
TSS: total soluble solids
WF: wheat flour
The authors express their sincere gratitude to the Postharvest Technology Division, Bangladesh Agricultural Research Institute (BARI), Bangladesh, for their valuable support and assistance in conducting the laboratory work.
BCD: Writing—original draft, Investigation, Formal analysis, Data curation, Project administration, Supervision, Fund acquisition. MMM: Investigation, Data curation, Writing—review & editing, Methodology. MHHK: Conceptualization, Visualization, Validation. MAH: Methodology, Validation. MA: Writing—review & editing, Software. IA: Visualization, Software. MSA: Validation, Resources. All authors read and approved the submitted version.
The authors declare that they have no conflicts of interest.
Ethical approval for the sensory evaluation was obtained from the Research Committee (Expert Panel) at Bangladesh Agricultural Research Institute (BARI) (Experiment No. 5.2.2.14). In compliance with ethical guidelines, the sensory evaluation of the formulated biscuits made with PFSPF was carried out without endangering any people or animals.
Informed consent to participate in the study was obtained from all participants. Participants were fully informed about the study’s purpose, the nature of the products (biscuits), any potential risks, and the evaluation process. They are assured of their right to withdraw at any time without consequence. Participants know their role and rights to maintain ethical standards in the research.
Not applicable
The raw data supporting the conclusions of this manuscript will be made available by the authors, without undue reservation, to any qualified researcher.
The study received funding assistance from the Bangladesh Agricultural Research Institute (BARI) for executing research (Experiment No. 5.2.2.14). The funder(s) had no role in study design, data collection and analysis, decision to publish, or preparation of the manuscript.
© The Author(s) 2026.
Open Exploration maintains a neutral stance on jurisdictional claims in published institutional affiliations and maps. All opinions expressed in this article are the personal views of the author(s) and do not represent the stance of the editorial team or the publisher.
Copyright: © The Author(s) 2026. This is an Open Access article licensed under a Creative Commons Attribution 4.0 International License (https://creativecommons.org/licenses/by/4.0/), which permits unrestricted use, sharing, adaptation, distribution and reproduction in any medium or format, for any purpose, even commercially, as long as you give appropriate credit to the original author(s) and the source, provide a link to the Creative Commons license, and indicate if changes were made.

View: 1015
Download: 46
Times Cited: 0